


Not all traffic is created equal. When a database is overwhelmed, you want the important queries to keep executing, even if that means shedding lower-priority work. This is a much better outcome than the alternative: a total database outage.
PlanetScale's Traffic Control makes this feasible at the database level by introducing resource budgets. These let you apply strict limits on slices of traffic, protecting resources for high-priority queries even when there's a surge in requests.
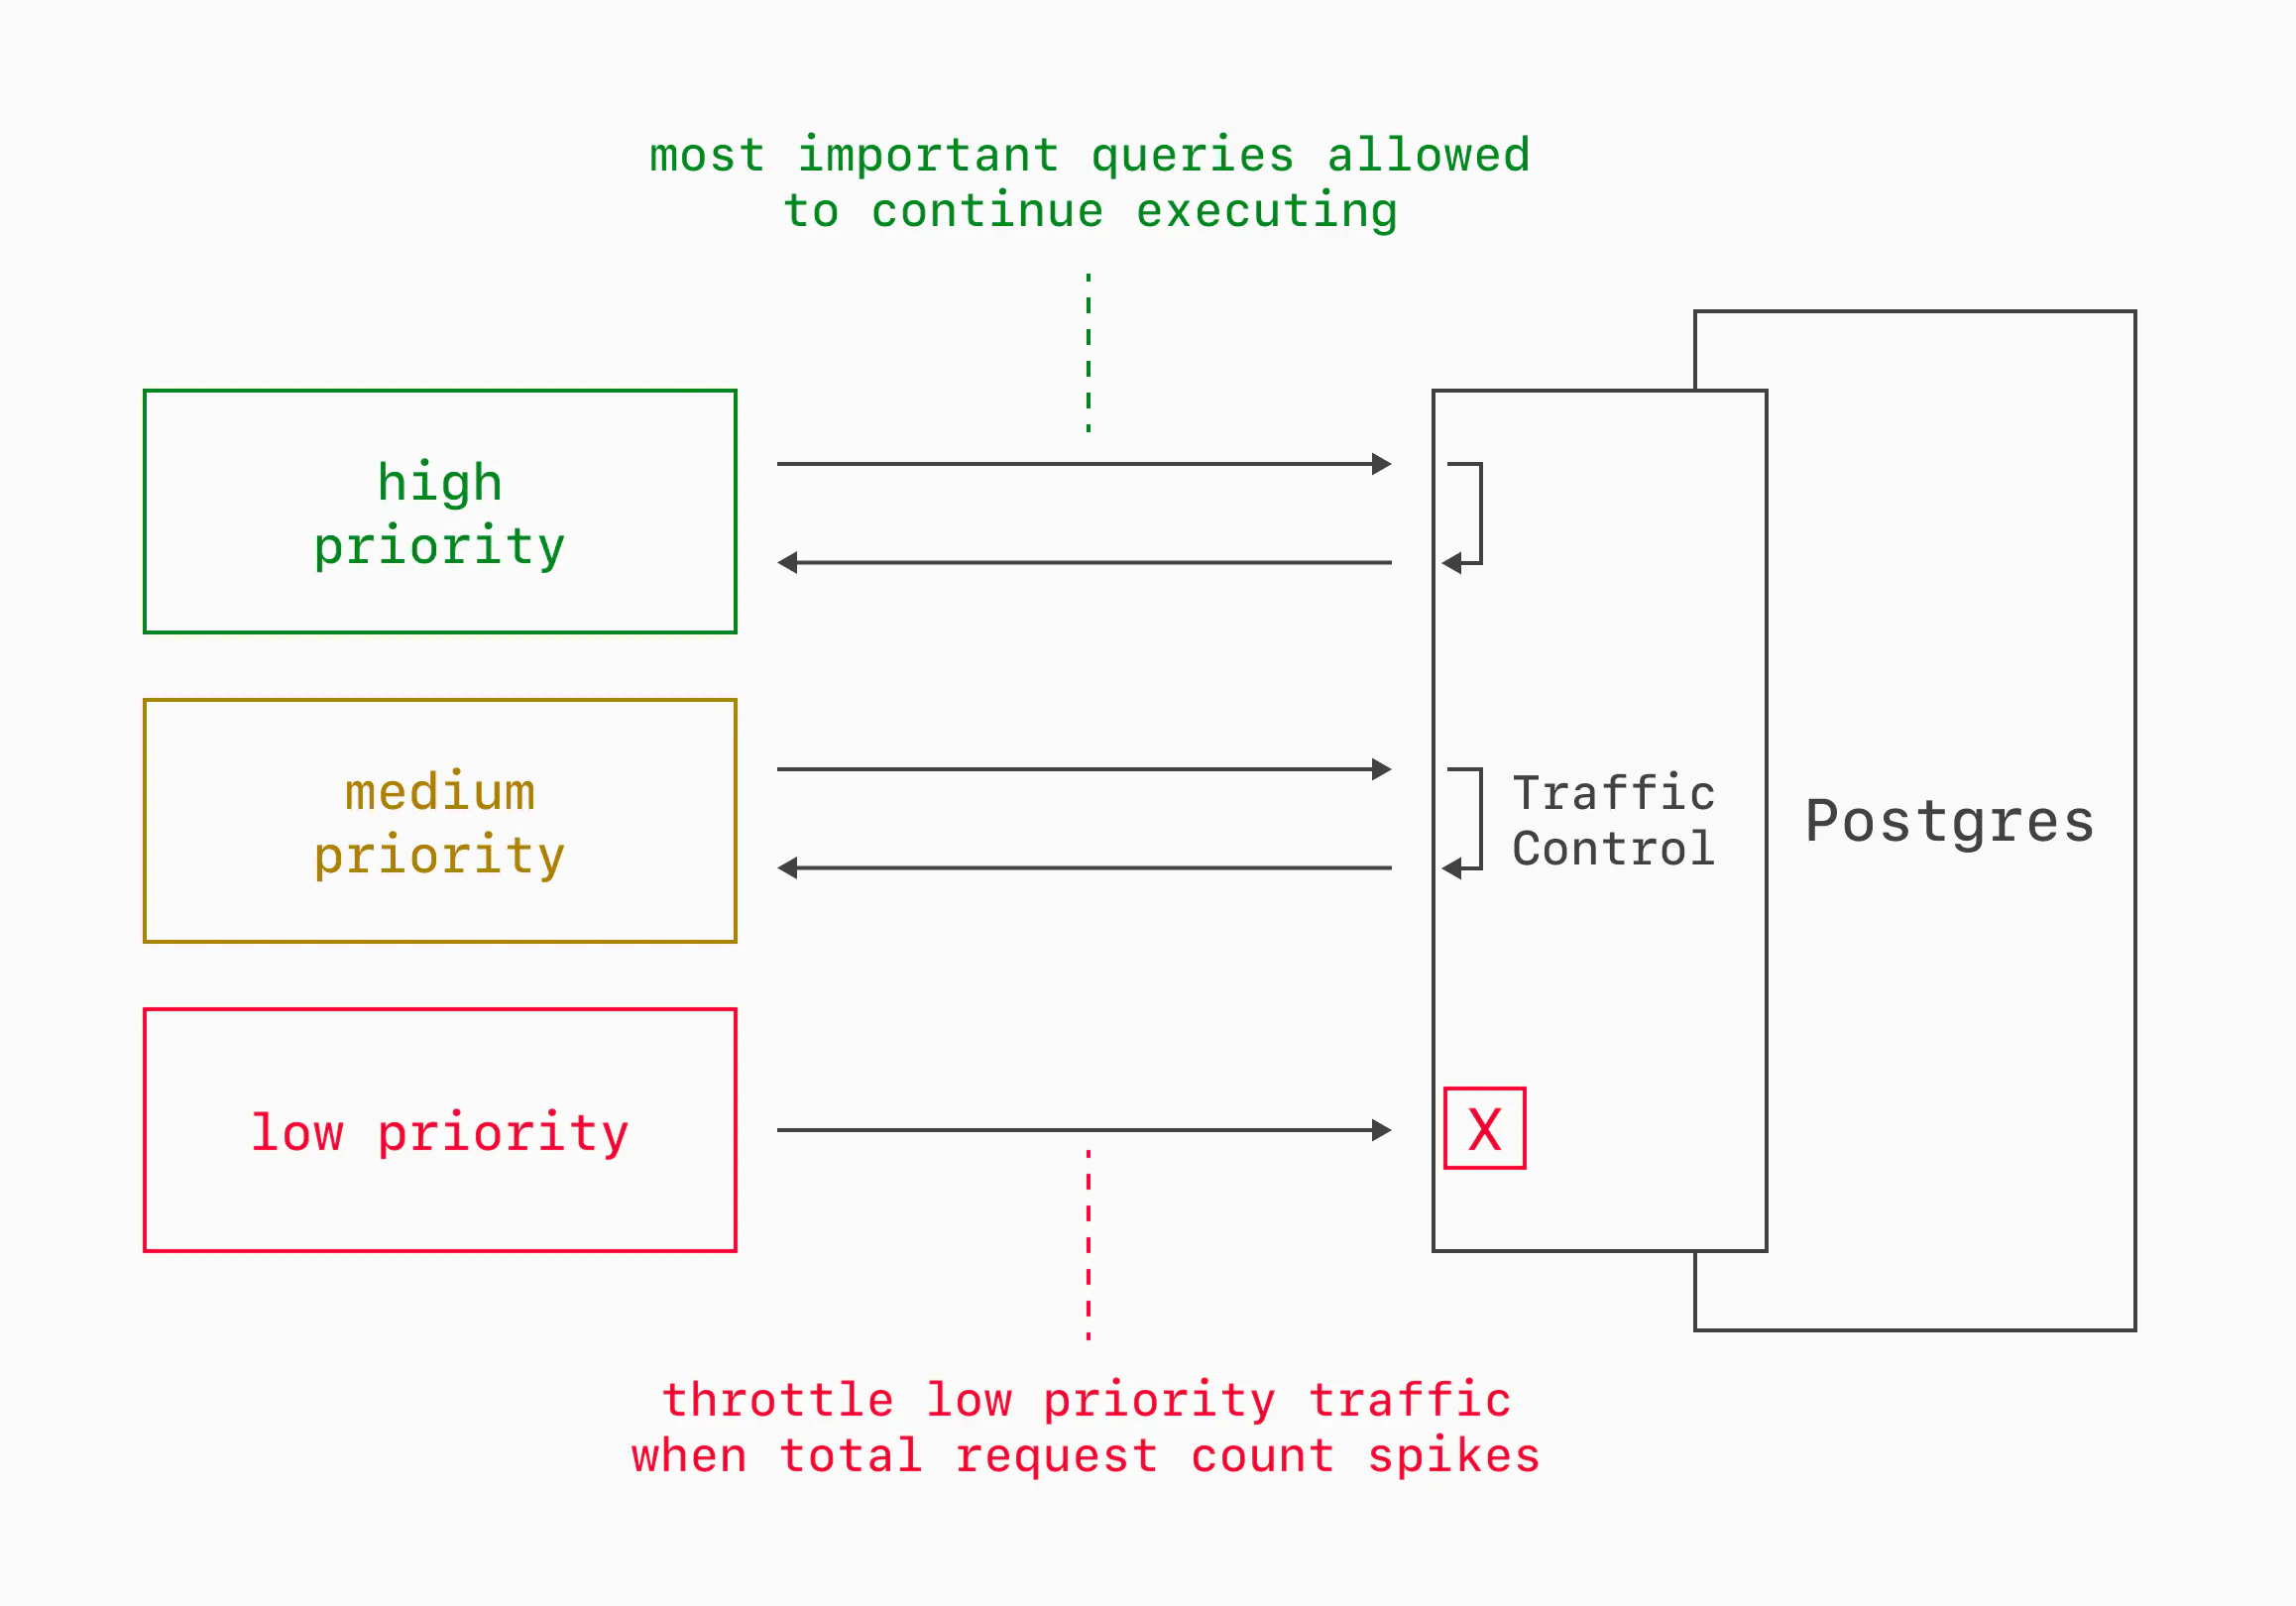
I'll run through exactly how this works in the scenario of running a social media platform. The same principles apply to any application with a wide variety of traffic types.
The scenario
Operating a social media platform involves quite a few different types of queries, each corresponding to different app features:
- Authentication
- Fetching post content
- Fetching user profile information
- Submitting new posts
- Fetching + updating like, impression, and bookmark counts
- Commenting
- Loading trending topics
- Direct messaging
Under normal load, a well-designed system allows every query to complete quickly. There is no need to prioritize one type of query or feature over another. But when a viral event, bad deployment, or DDoS attack introduces a load spike, these queries start competing for the same finite pool of database resources. Every query has an equal shot at consuming CPU and I/O, which means a flood of impression-count queries can starve the ones that users care most about, like authenticating and loading their timeline.
From the user's perspective, such database issues can make the application completely unusable. They can't read posts, they can't navigate, and they leave. Had you instead just stopped serving lower-priority components of the app for a few minutes, like impression counts and notifications, users would barely notice and stay on your platform.
Categorizing your traffic
To solve this with Traffic Control, the first step is to categorize and prioritize all Postgres traffic.
Critical: The app is broken without these. Authentication, post creation, post fetching, author profiles. If these fail, users have nothing to do on your application and will leave immediately.
Important: Noticeable if missing, but the app is still usable. Comments, post search, direct messaging (oh hello 𝕏.com).
Best-effort: Nice to have. Like, impression, and bookmark counts, trending topics, notifications, analytics dashboard. Users can still use the platform fine even if these features are degraded.
Your tiers will look different depending on your application. The point is to identify what you're willing to shed under pressure so that the things that matter most keep working.
Now that we know the priority of our application's product features, we need a way to identify these in our database queries. Fortunately, a standard exists for sending metadata along with queries: sqlcommenter. This standard allows clients to append a comment with key-value pairs to SQL statements.
For example, a query tagged with a priority tier looks like:
SELECT body, author_id, created_at FROM posts WHERE id = $1
/* category='viewPost', priority='critical' */
And a lower-priority query:
SELECT COUNT(*) FROM impressions WHERE post_id = $1
/* category='postStats', priority='bestEffort' */
You are in full control of the keys and values. Here, we include a category and priority for every SQL query. PlanetScale Postgres keeps track of the tags that you put on your queries and allows you to both filter query history and budget your traffic based on them.
Setting up resource budgets
With your queries tagged, you create budgets in Traffic Control. We have a lot of flexibility for budget setup. We could create per-category budgets, in which case we'd end up with a dozen or so budgets, being able to tune each individually.

Another option is to go more coarse, creating one budget for each of our three priority levels: critical, important, and bestEffort.
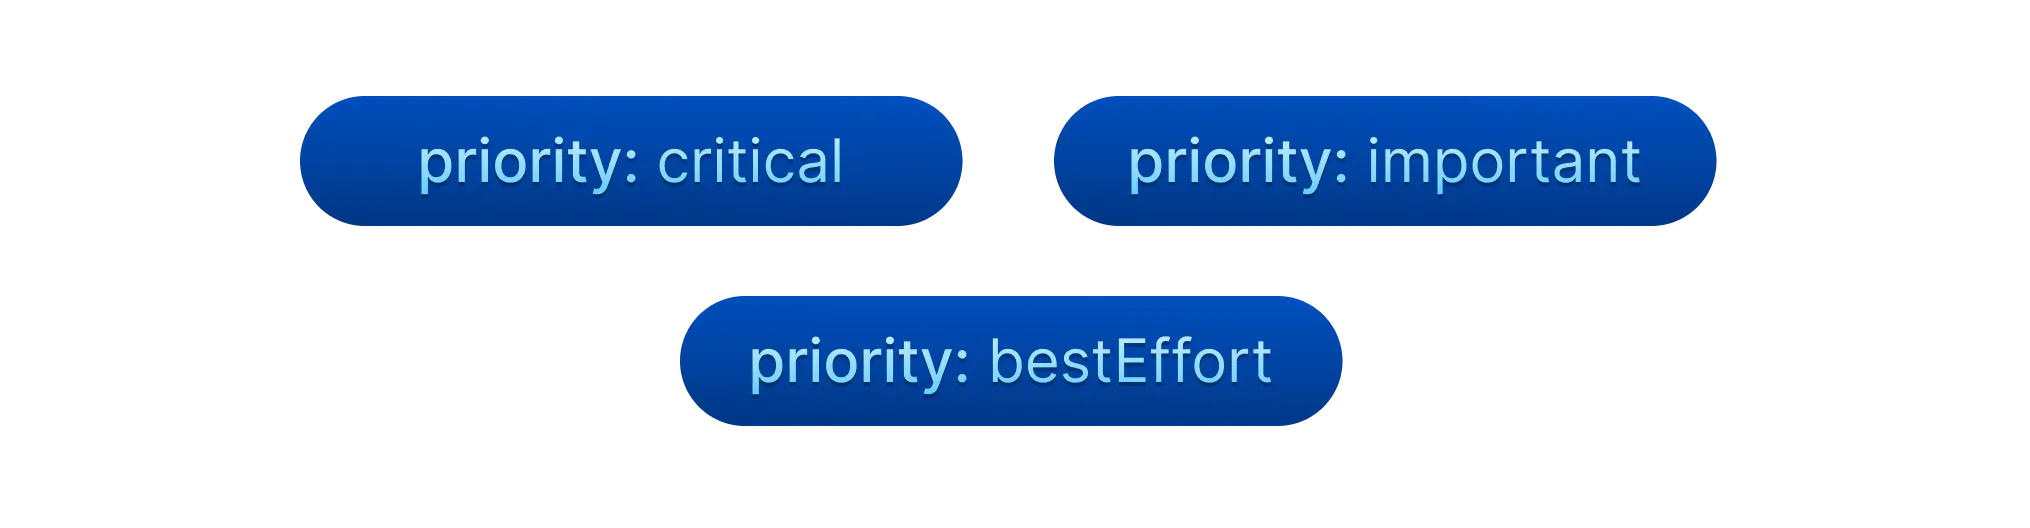
Running with the latter option, we create the following three budgets:
critical-budget: Apply this to all queries with the sqlcommenter key/value pair of priority='critical'. These queries are the most important, and therefore should be given the most relaxed budget. We will apply no Server share or Burst limit to these, but will apply a per-query maximum of 2 seconds to protect the database from rogue slow queries.
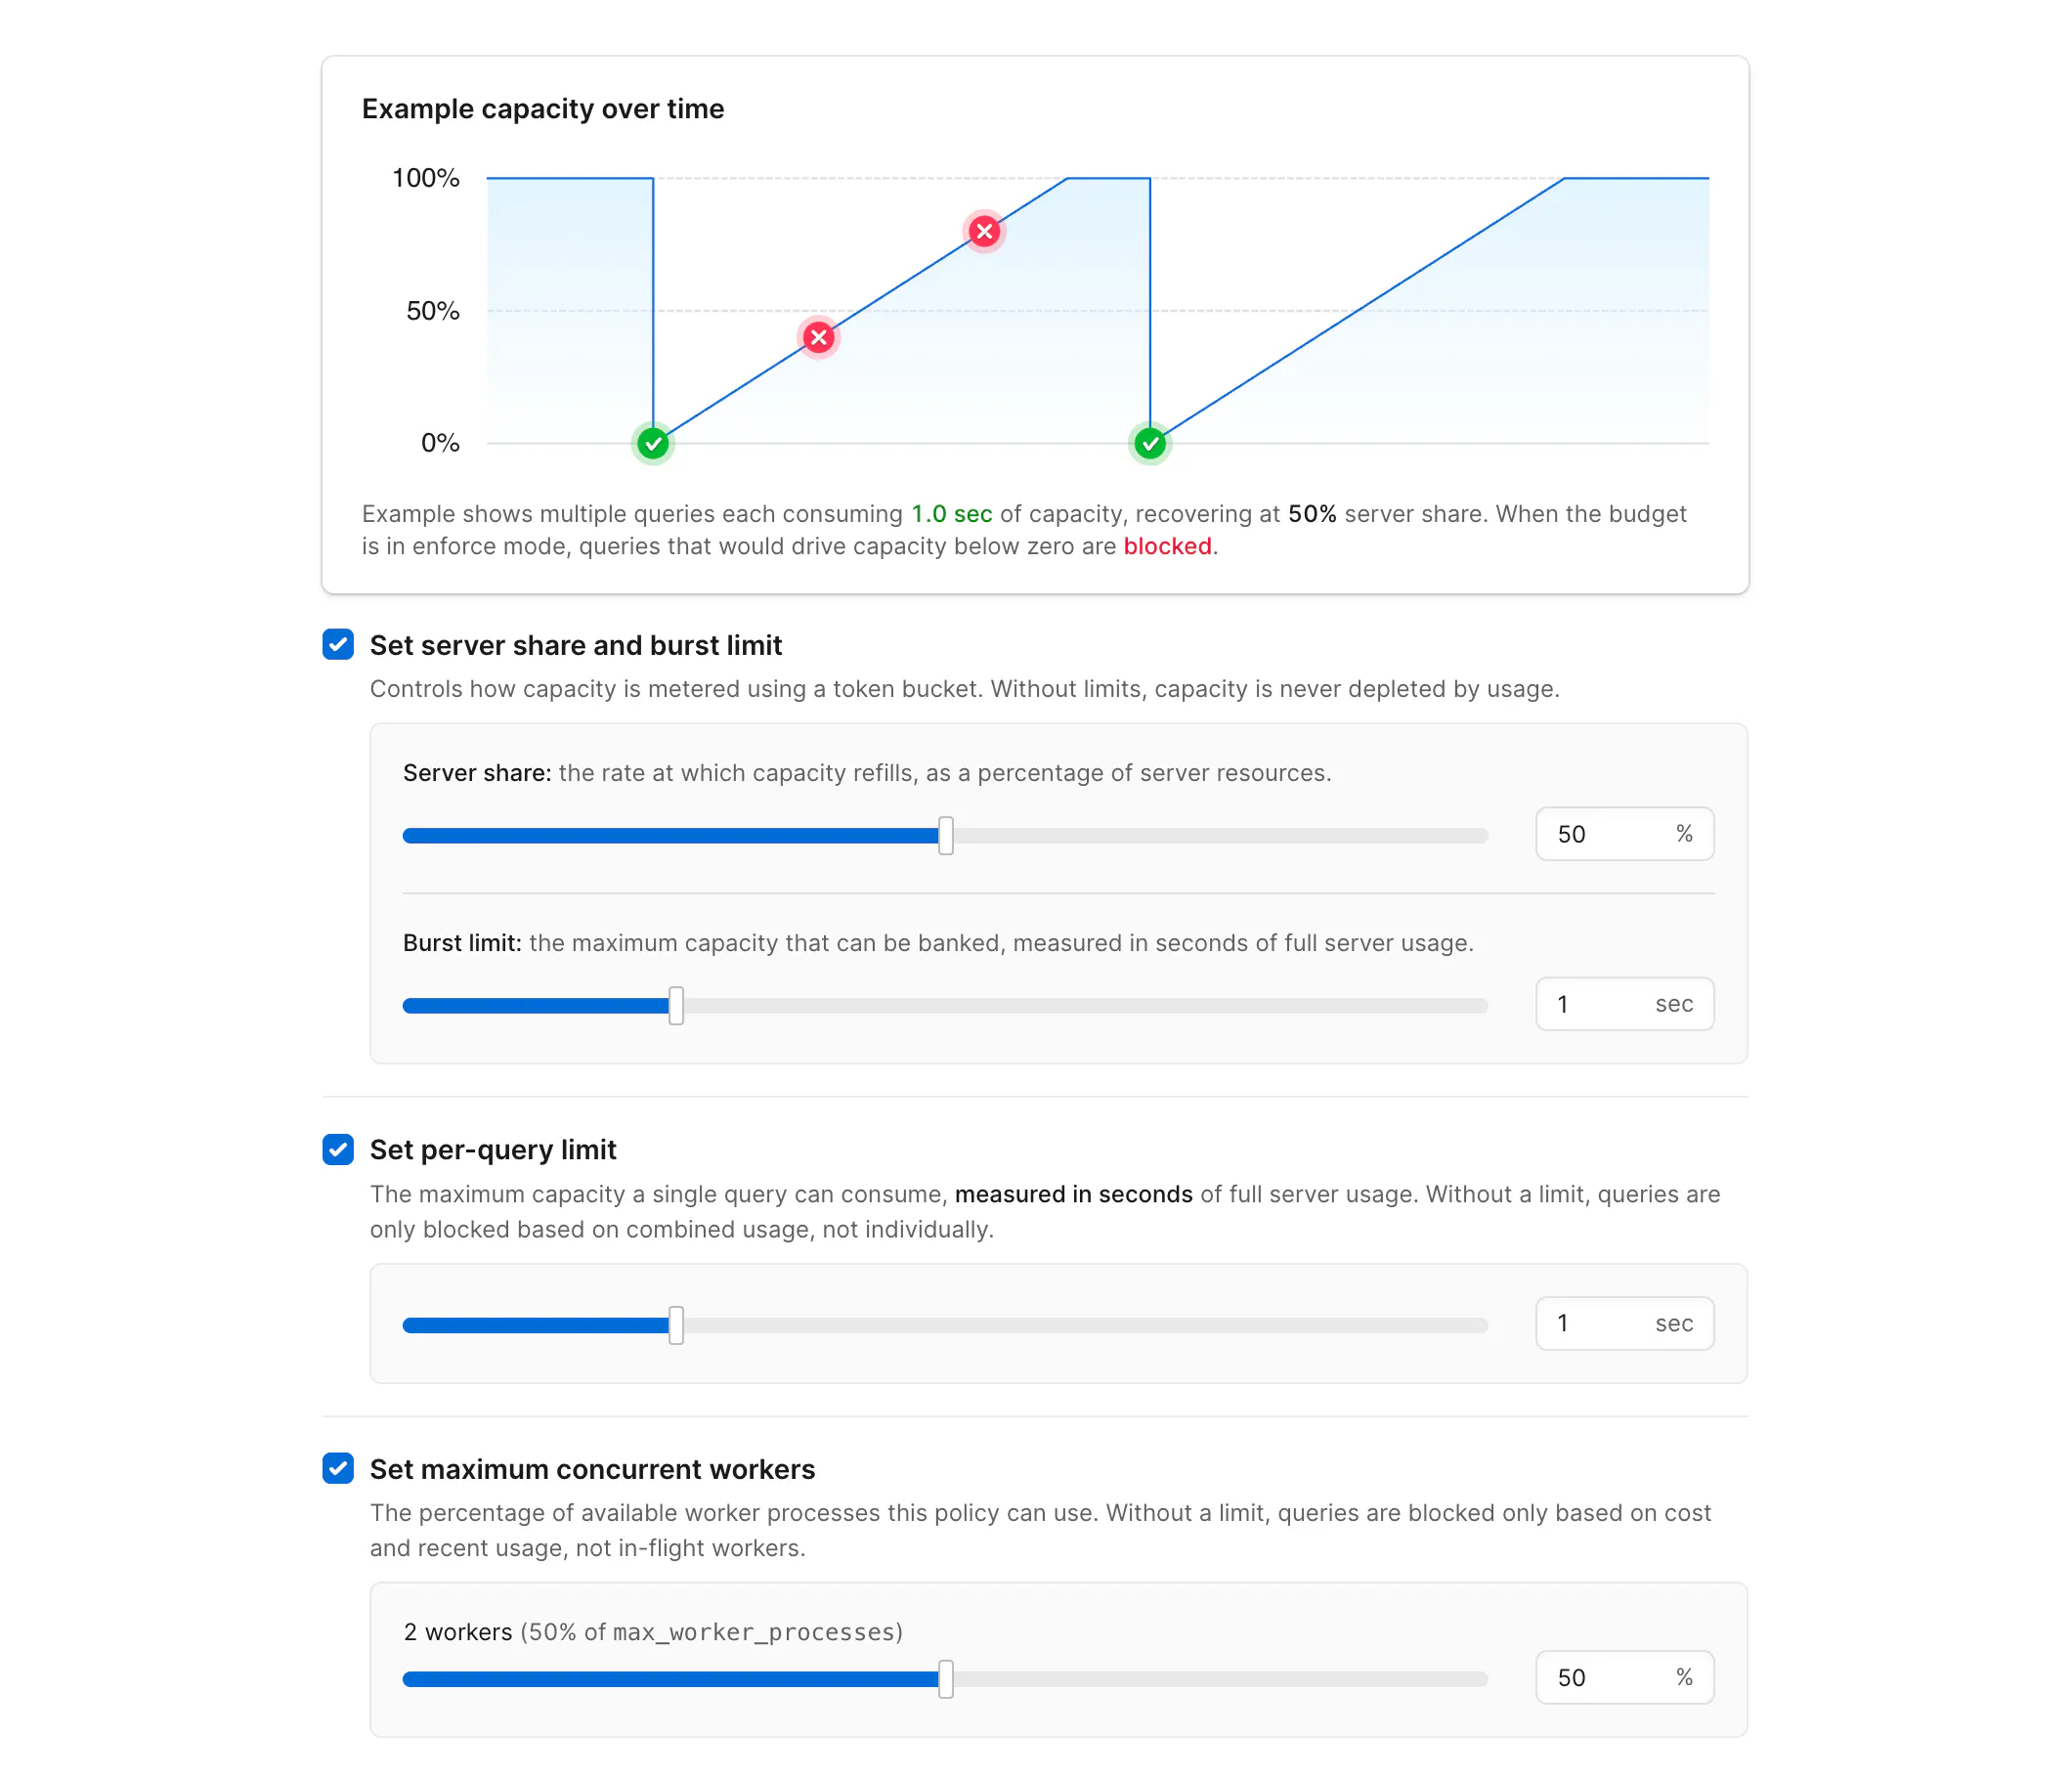
important-budget: Apply this to all queries with the sqlcommenter key/value pair of priority='important'. Set Server share to 25% with moderate max concurrent workers. This leaves plenty of room for comments and notifications under normal conditions, but some will be blocked when traffic is unexpectedly high. Start in warn mode to observe the traffic pattern, then switch to enforce once you're confident in the limits.
best-effort-budget: Apply this to all queries with the sqlcommenter key/value pair of priority='bestEffort'. Set Server share to 20% with a low max concurrent workers. Under normal load, this budget provides more than enough resource share for these lightweight queries. When this load spikes, some will be blocked. During such a spike, we can also make the call to dynamically decrease this percentage, right from the PlanetScale app. We could even completely shut off this traffic in favor of giving other queries more resources in an emergency.
Tuning over time
There's no need to get the tunings above perfect from day one. You can start every budget in warn mode. This will not kill any queries that exceed the budget. Rather, it will warn, and you can click into the budget to see how many queries are exceeding it over time.
Below is an example of a budget that is likely too restrictive. It has flagged thousands of requests as exceeding the budget over a 3 hour window.
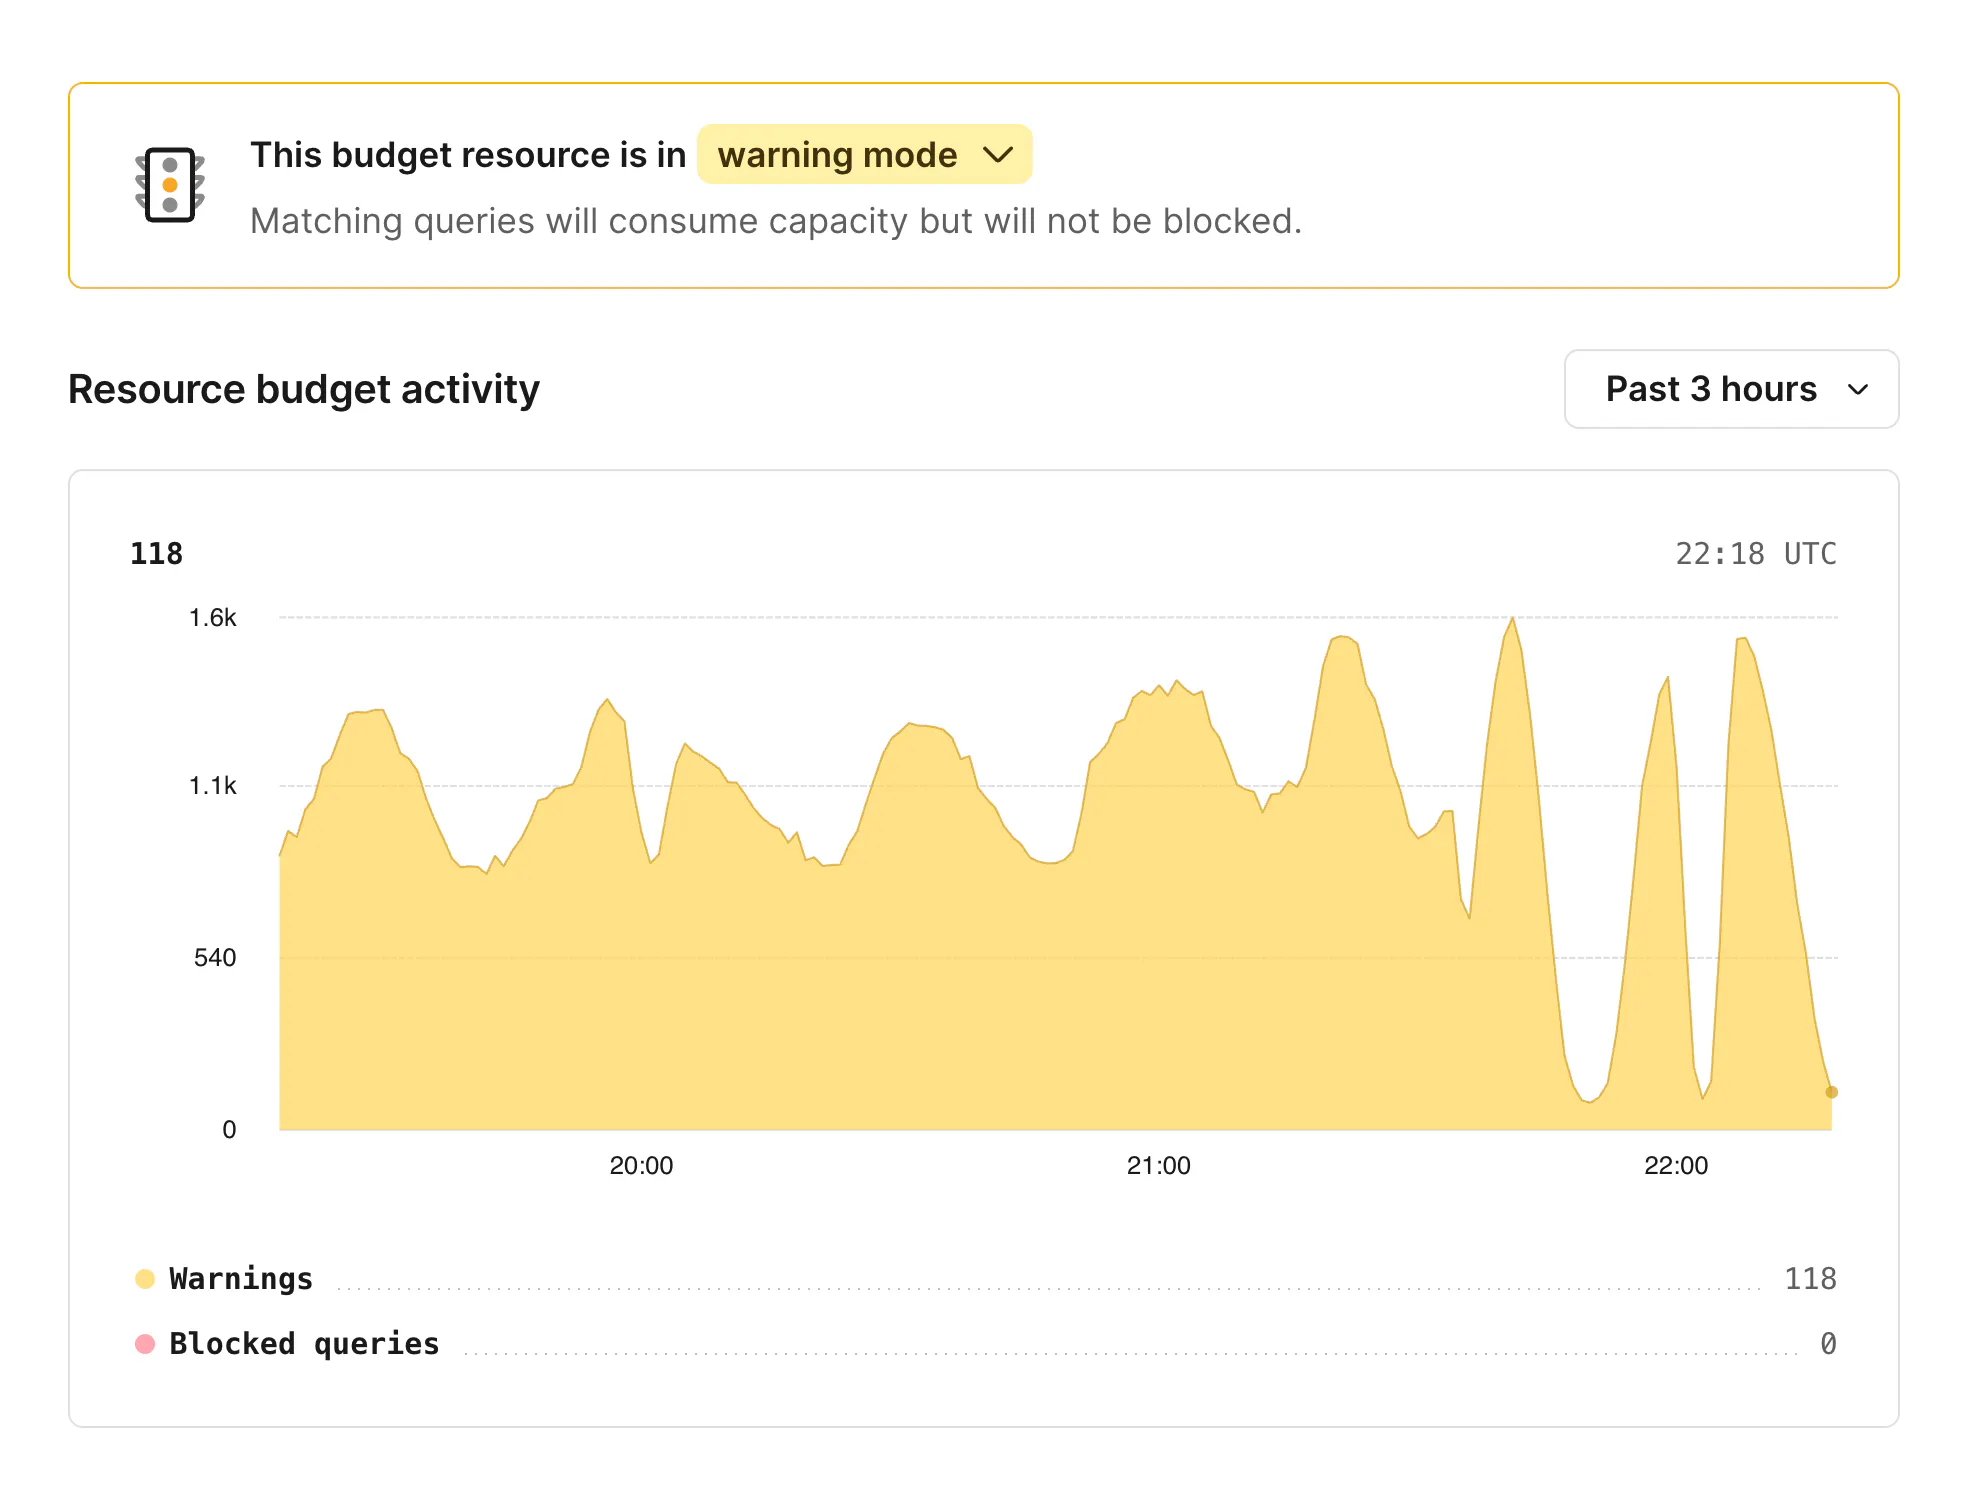
Warnings are also returned directly in the query response from Postgres in the form [PGINSIGHTS] Traffic Control:. This means you can observe the impact of your budgets from within your application without any user-facing effects. It's a great way to measure real traffic against your proposed limits.
Before setting a budget to enforce, it's recommended to spend a few days tuning the limits up and down until you're in a comfortable spot. We want each budget to be able to fulfill all queries when under normal load, with headroom to take on load variation.

After they are in a good spot, you can either flip them all to enforce mode full-time, or only flip the modes ad-hoc when you encounter unexpected database load.
A crisis event
Revisiting the scenario from earlier, but now with all of our budgets in place, what does an unexpected load spike look like?
First the viral event: A crazy news story or celebrity drama causes a sudden 10x increase in authentications, posts, likes, and as a side effect, notifications, impressions, and page loads.
Having well-established budgets helps keep the lower-priority traffic (like notifications and impression tracking) from starving the more important work. In this extreme scenario, we can click into the best-effort-budget and completely disable this traffic.
Changes to budgets happen live, so we would immediately see the impact of this. Users would temporarily stop receiving notifications and seeing impression counts in favor of still allowing them to authenticate and view posts.
The important-budget traffic is allowed up to 25% of the server share. This preserves a large portion of the server resources for serving the highest priority queries.
What could have been a huge lost-opportunity (your app becomes unusable) is now only a temporary degradation of non-critical functionality.
We've kept our users happy and avoided an application outage. All with a few clicks and PlanetScale's Database Traffic Control.