







Simeon Griggs [@simeonGriggs] |
Houseplants often die from over-watering, not neglect. It is easy to project human needs onto them: "If I am thirsty, they must be thirsty too." But many indoor plants actually benefit from drying out between waterings.
Similarly, your empathy can lead to misinterpreting signals from your database. You don't like feeling overwhelmed, so you don't want your database overwhelmed either.
But not all usage is created equal, and memory in computers can be uniquely complex to understand.
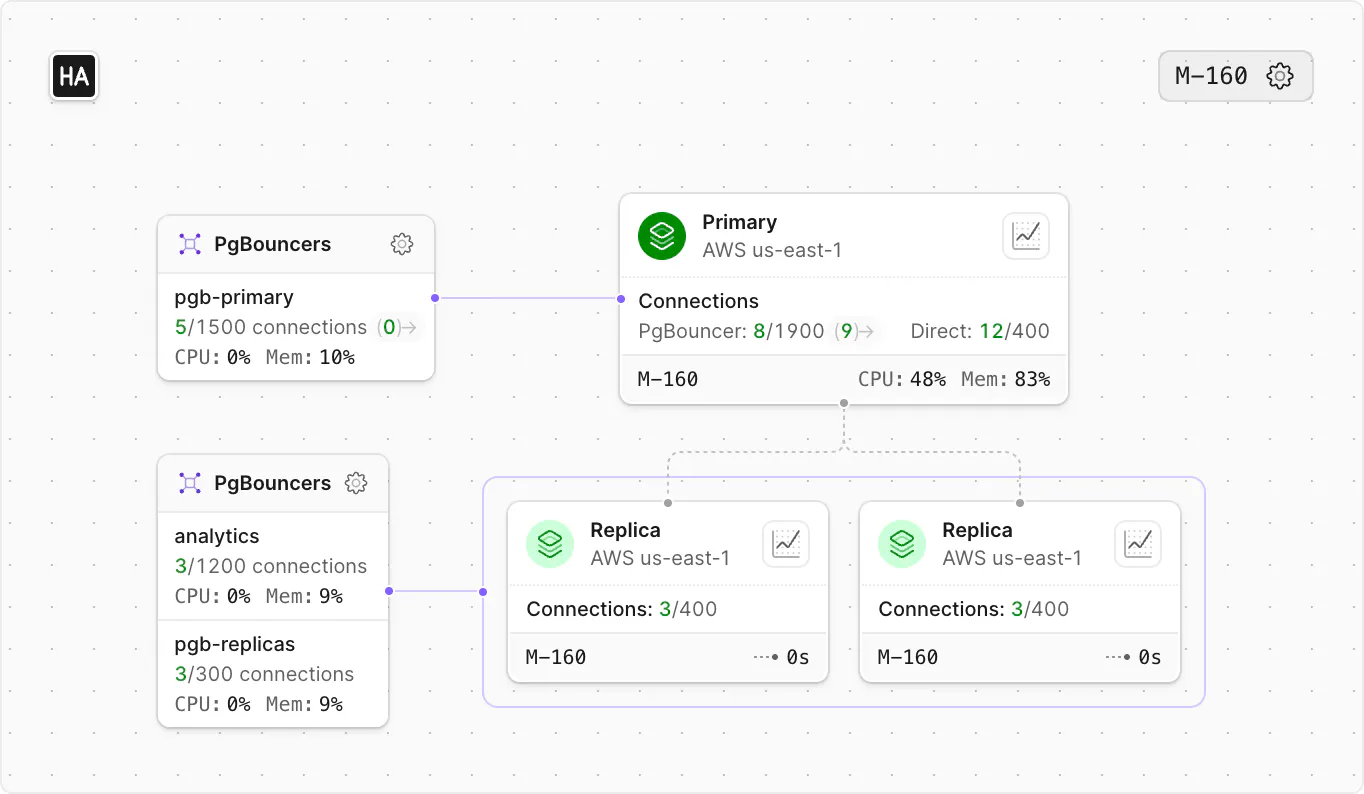
A look at your PlanetScale dashboard might show memory usage sitting at 80%. That looks bad, but it could actually be representative of a healthy system.
To be clear, consistently high CPU usage is a problem. For as long as CPU stays high, queries wait longer, the slowest queries get slower, and you have less headroom for spikes.
Memory is different. The percentage shown in the cluster diagram on your PlanetScale dashboard is measuring the entire node your database runs on, not just Postgres. When most RAM is in use, it usually means the system is keeping data close to the CPU so it does not have to read from disk as often. Unlike sustained high CPU, high memory usage by itself does not mean performance is degraded or that you are at immediate risk of "running out" of memory.
Why Postgres wants your memory
Reading from disk is slower than reading from RAM, even with PlanetScale Metal's locally attached NVMe drives. Postgres is designed to take advantage of that gap by caching as much data in memory as it can.
There are two layers of caching at work, and both consume RAM.
shared_buffers is Postgres' own buffer pool. When a query needs data, Postgres first checks this pool for the relevant pages, the fixed-size (8 KB by default) chunks of table and index data it works with, before reading from disk. The more of your working data that fits here, the fewer disk reads Postgres needs to perform.
This parameter can be configured in the cluster configuration page of the PlanetScale dashboard. The default value should be sufficient for most workloads, and modifying it should not be your first step in troubleshooting memory usage.
The OS page cache is the second caching layer. Even when Postgres does go to disk, the operating system keeps a copy of the data it reads in RAM so the next access is faster. This is not a Postgres feature — it is standard Linux behavior. Postgres was designed with this in mind, and its own documentation notes that the operating system's cache is expected to handle data beyond what fits in shared_buffers.
Between these two layers, a healthy Postgres server will use most of the available RAM. That is the goal, not a side effect. For context, reading a page from RAM is roughly 1,000 times faster than reading it from even a fast NVMe drive. A database that keeps frequently accessed data in memory avoids that penalty on every query.
When caching is working well, the vast majority of page reads are served from memory without touching disk. If that ratio drops — because the working dataset has outgrown available memory, for example — queries slow down as Postgres waits on disk more often.
Note
See our documentation on "Normal operating ranges" to sense-check what values you should be seeing in Cluster Metrics for CPU, memory, and more.
Memory usage compared to CPU usage
At a glance, CPU and memory usage numbers look comparable because they share a 0–100% scale, but they describe very different behavior.
CPU is work. Sustained high CPU means the database is spending time on work it cannot skip. When CPU is saturated, queries arrive faster than they can be processed. They queue, latency climbs, and connection timeouts can cascade into application-level failures. There is no "good" kind of sustained high CPU usage.
Memory is workspace. Postgres and the OS use spare RAM to avoid expensive disk reads. Higher use improves performance ... most of the time.
"Most of the time" because memory usage gets a little complicated.
Two kinds of memory usage
The single “memory usage” percentage number combines two different behaviors.
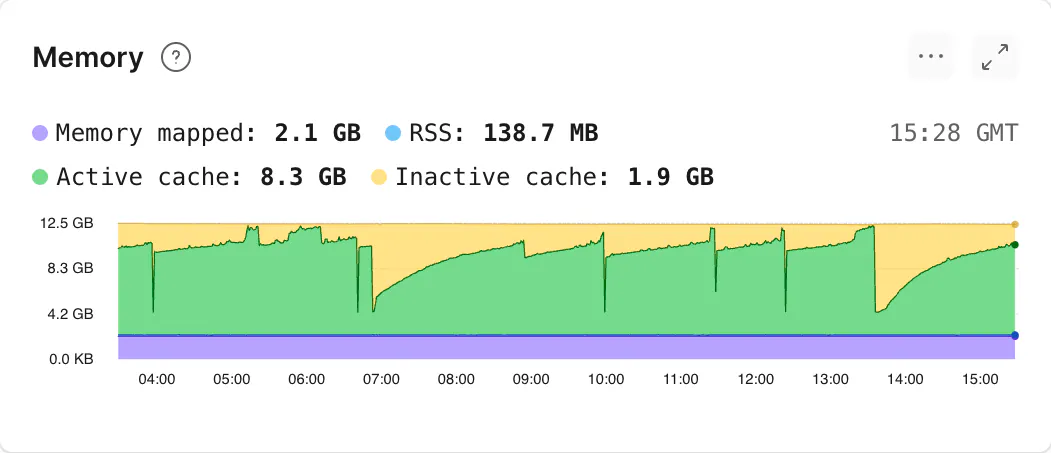
To explore that number in more detail, within the Cluster Metrics page of the PlanetScale dashboard, memory is shown as a stacked chart over time with four different categories: active cache, inactive cache, RSS, and memory mapped. These four categories can be grouped into two separate but equally important use-cases: cache and process memory.
1. Cache (active, inactive, and memory mapped)
Much of what looks like “used” memory on a healthy database host is cache: file data the operating system keeps in RAM after reads so the next access is cheap. You may see this referred to as "page cache" in other dashboards.
Active cache is data the OS recently touched and wants to keep around. Inactive cache hasn't been accessed lately. Memory-mapped pages are cached pages that are backed by real files on disk.
All three of these cache types are reclaimable by the operating system and can be dropped when something else needs RAM.
If total memory is high because cache is high, good! Frequently accessed data stays near the CPU for faster access.
Separately, Postgres holds memory for processes that are actually using it. You will see this referred to as RSS (Resident Set Size) in the PlanetScale dashboard.
This memory is not reclaimable by the operating system and is what increases out of memory (OOM) risk. High memory usage through high RSS leads to restarts and degraded behavior.
If total memory is high because RSS is high, that is referred to as memory pressure and is a problem.
What is Resident Set Size?
Roughly, RSS is the amount of private memory allocated to a process such as stack, heap, catalog/relcache caches, query execution memory like sorts and hash tables.
Given Postgres' process-per-connection architecture, each process requires some baseline amount of memory. Not every process will consume the same amount of memory.
Further, some memory use is shared across processes. So calculating RSS use is not as simple as adding up the memory usage of every process.
RSS increases for a number of reasons:
- Postgres may grant multiple
work_memallocations within a single query; see below for more details. - Catalog bloat can spike RSS usage, common in multi-tenant schemas using a table-per-tenant pattern.
- The operating system's memory allocator may not return memory efficiently.
- Misbehaving or misconfigured extensions can increase RSS usage.
- Cached plans and prepared statements accumulate per-session memory that is not released until the session ends or the statement is explicitly deallocated.

The work_mem parameter's default value is set relative to the amount of memory in your database cluster. It can be modified in the cluster configuration page of the PlanetScale dashboard.
Tuning work_mem might seem like an obvious lever — decrease it to reduce RSS, or increase it to prevent operations from spilling to disk. But the allocation is per-sort/hash-node, per-query, per-backend.
A single complex query can allocate work_mem multiple times, and that multiplies across every active connection. Setting it too low forces more disk I/O; setting it too high globally can cause total memory usage to spike unpredictably under load. Neither direction is a safe default change without first understanding your workload's concurrency and query complexity.
Efficient connection pooling can be the best way to reduce RSS usage. Fewer active connections result in fewer copies of all that per-process overhead.
PgBouncer on PlanetScale runs in transaction mode, where connections are returned to the pool after each transaction completes. See our blog post on Scaling Postgres connections with PgBouncer for more details.
Investigating memory usage while debugging performance
If you're experiencing degraded performance, the challenge is figuring out what drove the RSS growth.
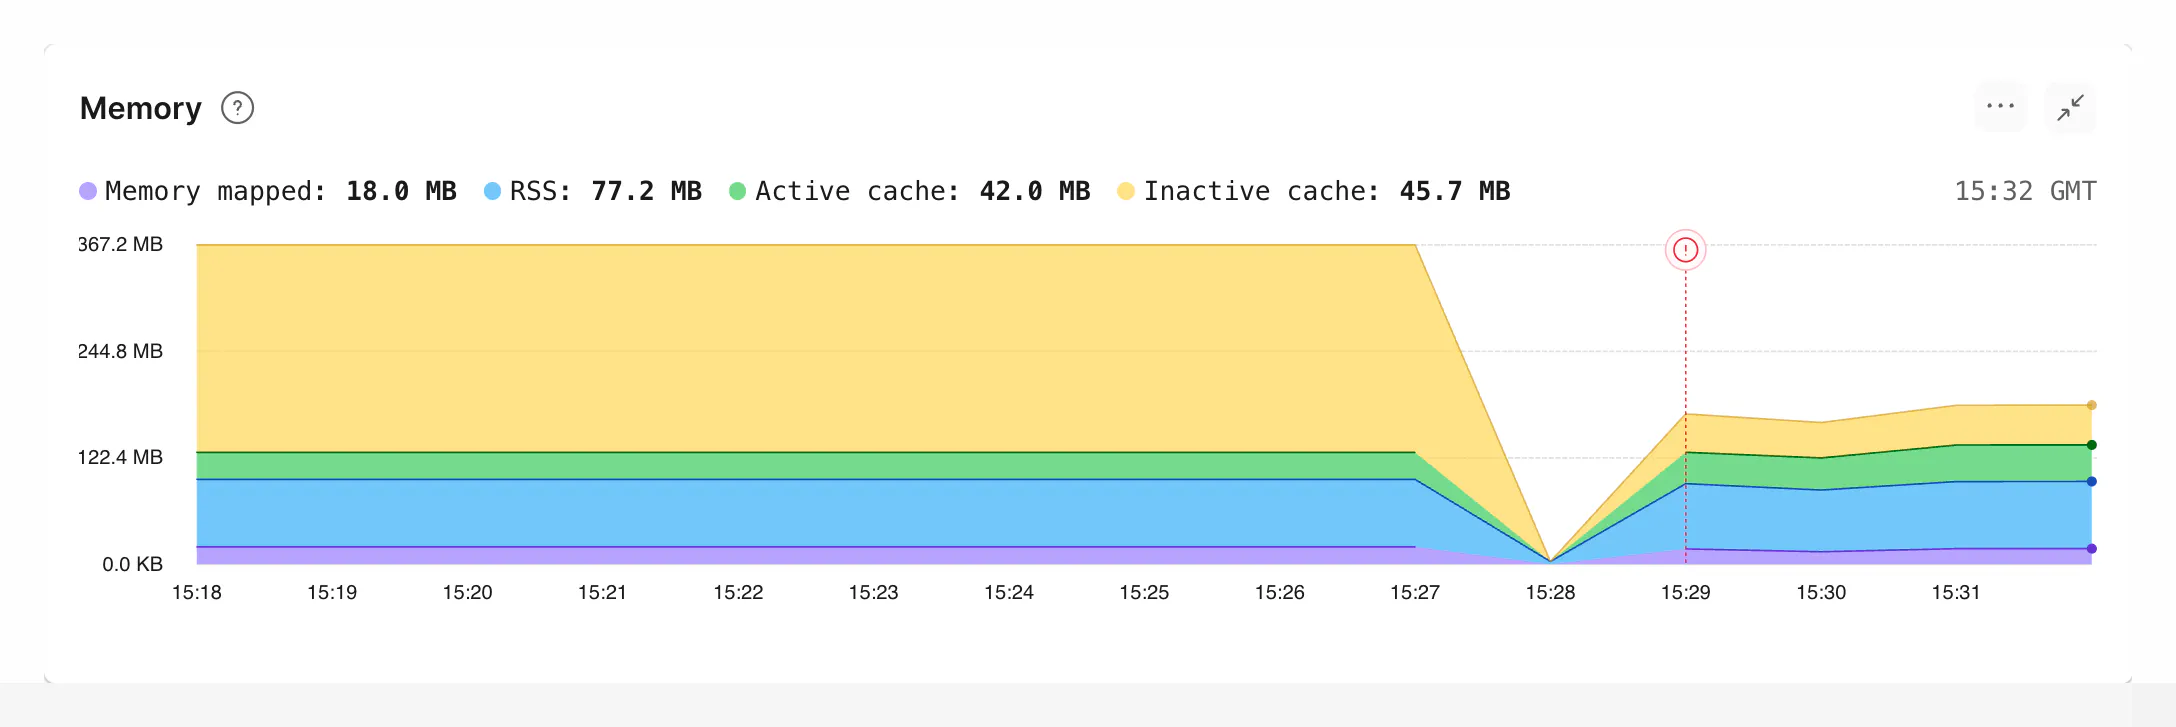
Query Insights helps you investigate query performance through CPU time, I/O, and latency, but it does not show per-query memory. You may see OOM markers and slow-query signals, but not query-specific RSS usage.
RSS is a per-process metric, not a per-query metric. That means you cannot read “RSS per query” directly from EXPLAIN or Query Insights. Instead, you may need to gather multiple signals and triangulate:
- Use Cluster Metrics to identify when RSS rises.
- In Query Insights for that same window, look for expensive patterns (high runtime, CPU, I/O, rows/blocks read) and OOM-adjacent activity.
- Re-run suspect queries with
EXPLAIN (ANALYZE, BUFFERS, MEMORY)to inspect operator-level memory usage. - Check connection counts in the same window, because many concurrent connection processes can increase RSS even when a single query is moderate.
The out of memory documentation has more details on the likely causes of, and how to prevent, OOM events.
In summary
A lot of cached data in memory is a good thing. Ideally, your "hot dataset" fits in the page cache of your database cluster to maintain fast performance. Too little cached data can lead to increased CPU usage and degraded performance.
- High memory usage is not automatically bad. If your high memory usage is due to cache, you typically have a healthy, performant database.
- Memory pressure is bad. Rising RSS toward limits, OOM kills, unexplained restarts, and tail latency spiking together with heavy disk I/O when the working set is tight on RAM are the signals to act on.
- Sustained high CPU is a problem. It means you are out of headroom. Tune the workload (see Query Insights) or upgrade.
If the dashboard shows a high “% memory used,” do not panic. Investigate the types of memory being used and check for OOM events before taking action.