







As much as we want to avoid them, all applications eventually encounter errors interacting with their database. What’s important is that you have the ability to easily view and understand these errors so you can quickly solve the underlying issue.
To help with that, we’ve introduced a new error tracking feature to Insights that will help you get to the bottom of things quickly. To show this new feature off in action, let’s walk through an example of how the PlanetScale team used this internally to troubleshoot an issue.
Investigating an error
After releasing Insights error tracking for PlanetScale staff, we noticed occasional upticks in the new "Query errors" graph on our main production database.
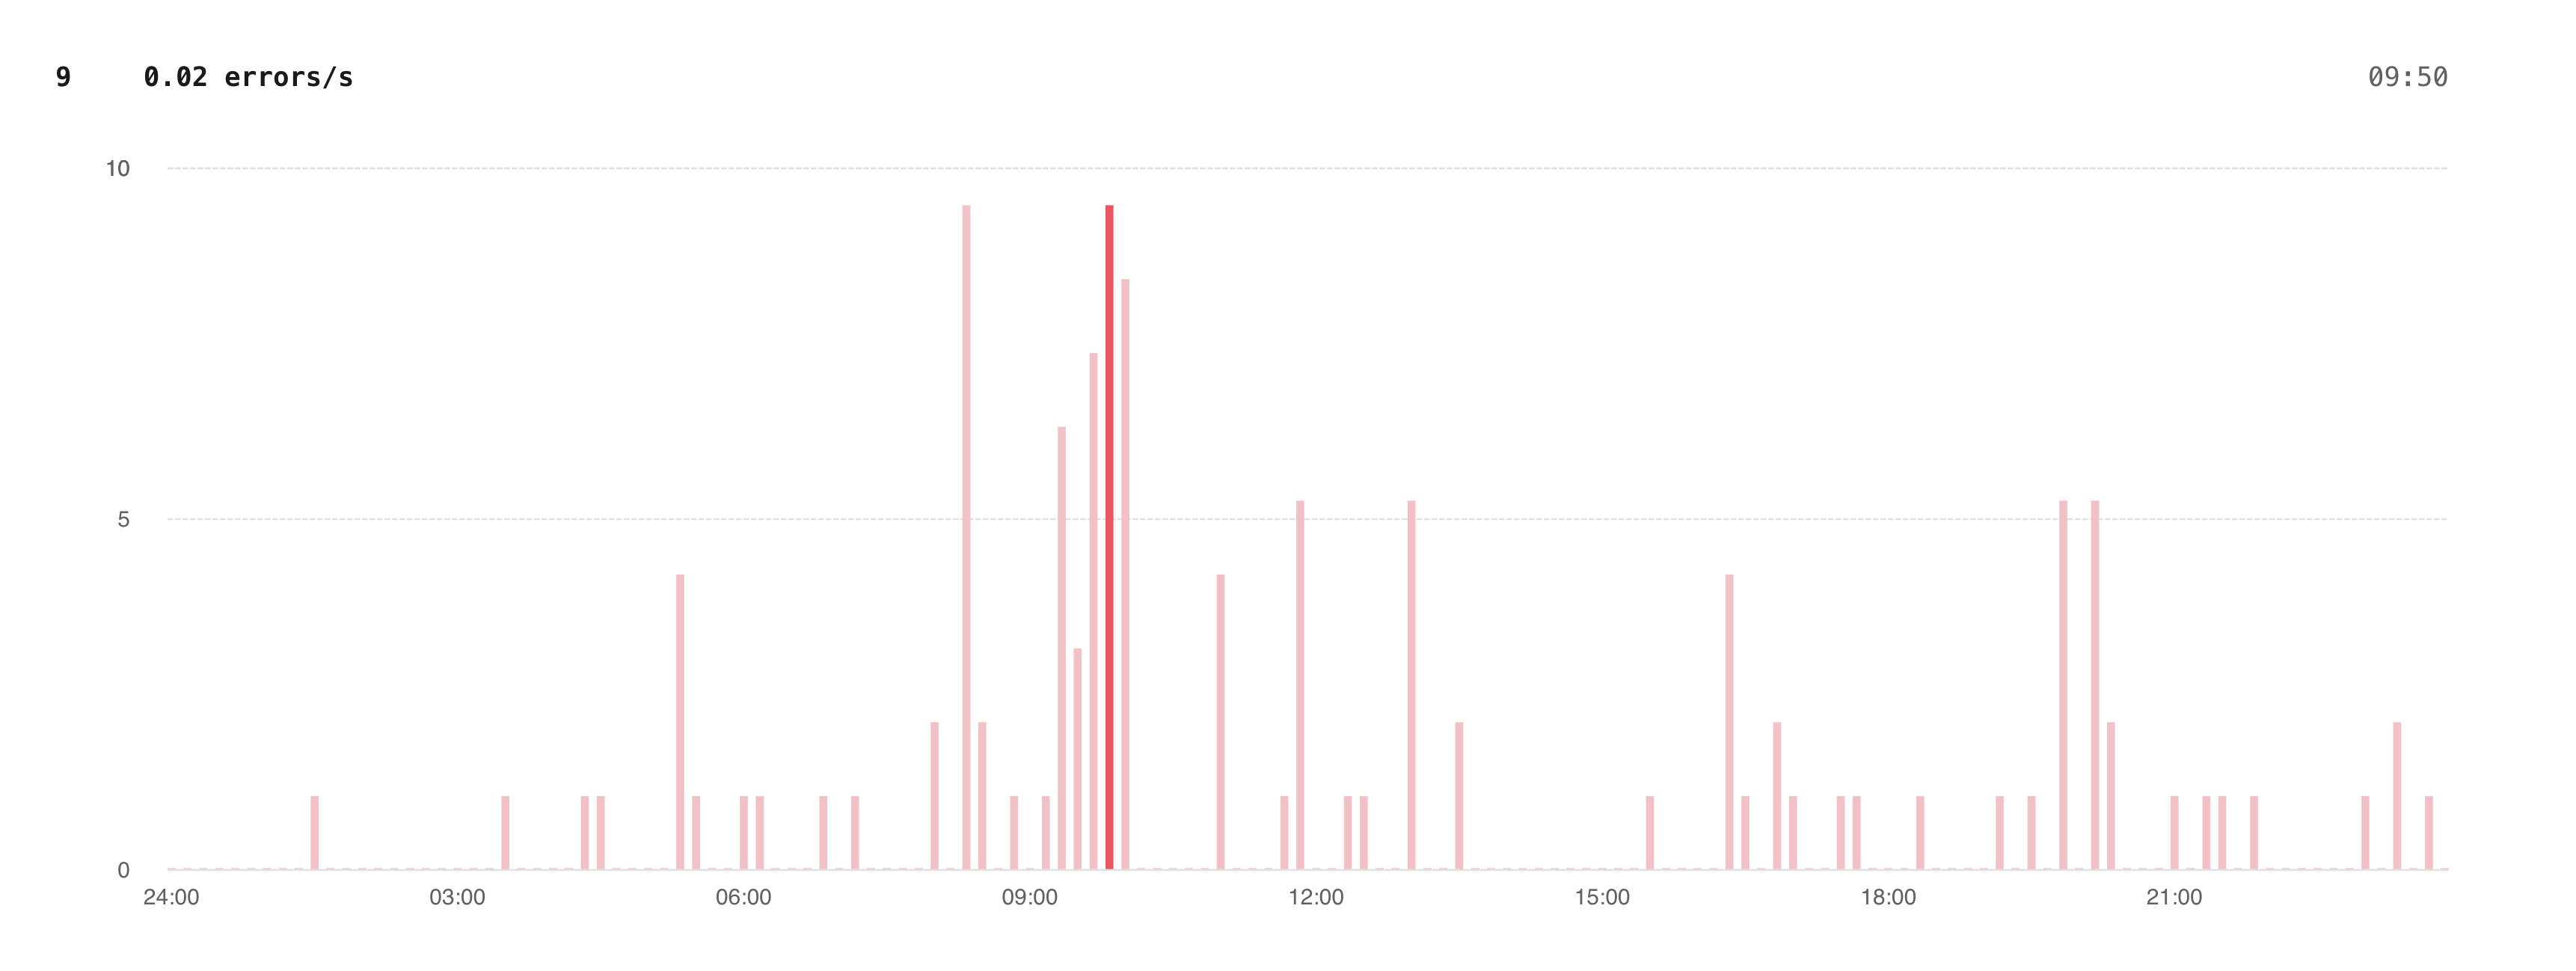
In the errors tab, we saw a fair number of AlreadyExists errors on the database_branch_password table. These errors weren’t alarmingly frequent — we receive a few 10s to a few hundred per day — but we wanted to dig in to ensure that we weren’t causing our users frustration with failed requests.

Our first step is to click on the error to see a list of recent occurrences.
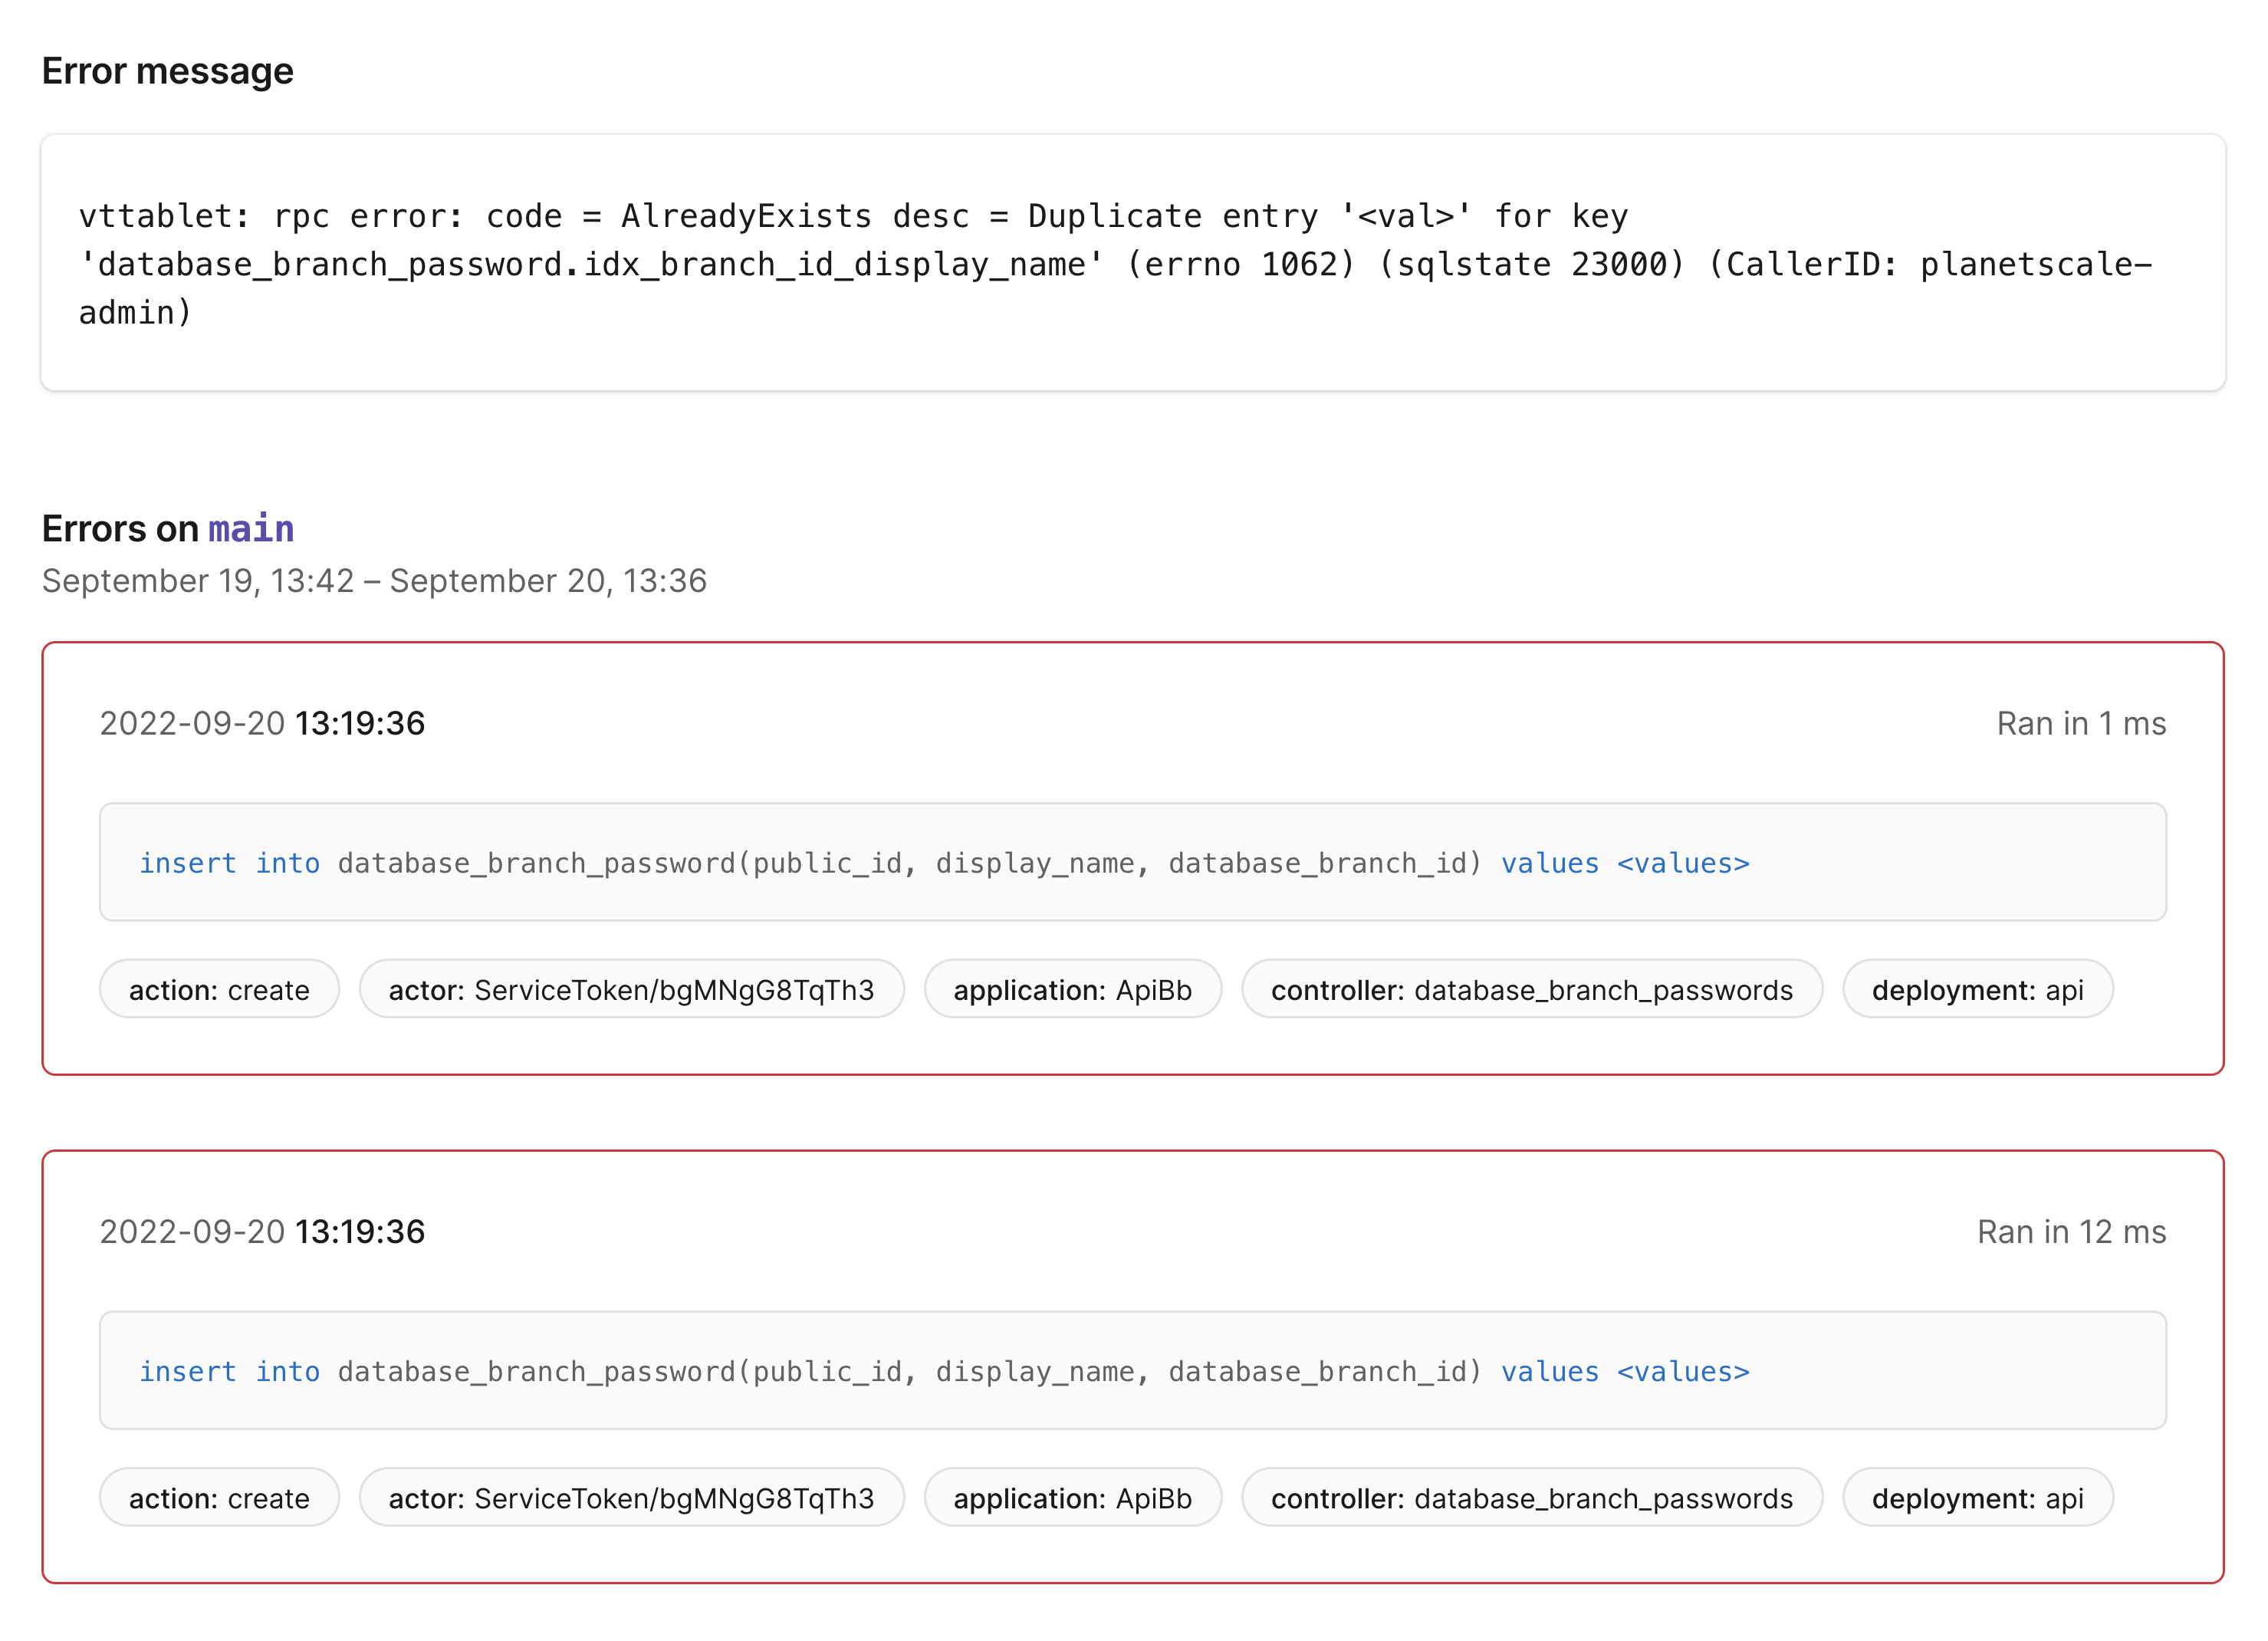
This page shows the full error message and lists individual occurrences of the errors with the timestamp, normalized SQL query, and any associated tags. This page has a few interesting things to tell us:
- The error is coming from the
DatabaseBranchPasswords#createaction - Occurrences of these errors come in small batches with nearly identical timestamps
- The
actortag for each batch of errors is always the same
The index with duplicate entries is defined as follows in our Rails schema file:
t.index ["database_branch_id", "display_name"], name: "idx_branch_id_display_name", unique: true
Given the error message and the index definition, we can infer that our application is attempting to insert multiple rows with the same values for the database_branch_id and display_name columns, and MySQL is rejecting the insert. To debug this from the application side, the tags show us that the create action of DatabaseBranchPasswordsController is the place to start. This action ultimately ends with a call to the create method of the DatabaseBranchPassword ActiveRecord model. In DatabaseBranchPassword we have the following uniqueness validation, which should return errors on the model if the uniqueness constraint in question is violated:
class DatabaseBranchPassword < ApplicationRecord
  ...
  validates :display_name, uniqueness: { scope: [:database_branch_id]
---
  ...
end
Next, we verified in a development environment that the uniqueness validation seemed to be working correctly: when we try to create two identical DatabaseBranchPassword rows, we get an ActiveRecord error showing that the name has already been taken. So, with the validation working as expected, what could be going on here?
This is where another piece of information we learned from the errors page comes into play: the queries that attempt to insert duplicate rows came in at nearly the same time, leading us to suspect that a race condition could be involved. Could it be possible that two attempts to create a row with the same values both pass the Rails uniqueness validation and get sent to the database? Turns out: yes!
The uniqueness validation queries the database to see if the display_name has been taken, and if it hasn’t, ActiveRecord attempts to persist the row. If two (or more) requests to our password create API are initiated at nearly the same time, it’s possible that two separate application threads could both query the database at the same time, before either thread had created the record, and then proceed as if there was no issue. The database, as the final arbiter of uniqueness, would then only allow one of these queries to succeed and the other would receive the error we see in Insights.
Now that we know this error occurs when multiple nearly-simultaneous API requests are issued, our next step was to determine who or what was issuing these requests. Because we tag all queries from authenticated requests with information about the actor, it was easy to look them up and determine that an internal tool was issuing multiple password create requests in parallel. Our solution was simply to modify the script to avoid that behavior. Because an interactive user is unlikely to issue password creates quickly enough to trigger this behavior, we were content to call this issue solved.
In addition to including tags in Insights errors, we’ve also improved how tags work for Insights in general. Most notably, you can now search both queries and errors based on tags. Searching queries by tag has one caveat: to associate tags, a query pattern must have had at least one query that took more than 1 second, read more than 10k rows, or resulted in an error. We find that most of the queries we want to search for have met these conditions.
Queries can be filtered by tag with the following syntax: tag:tag_name:tag_value.
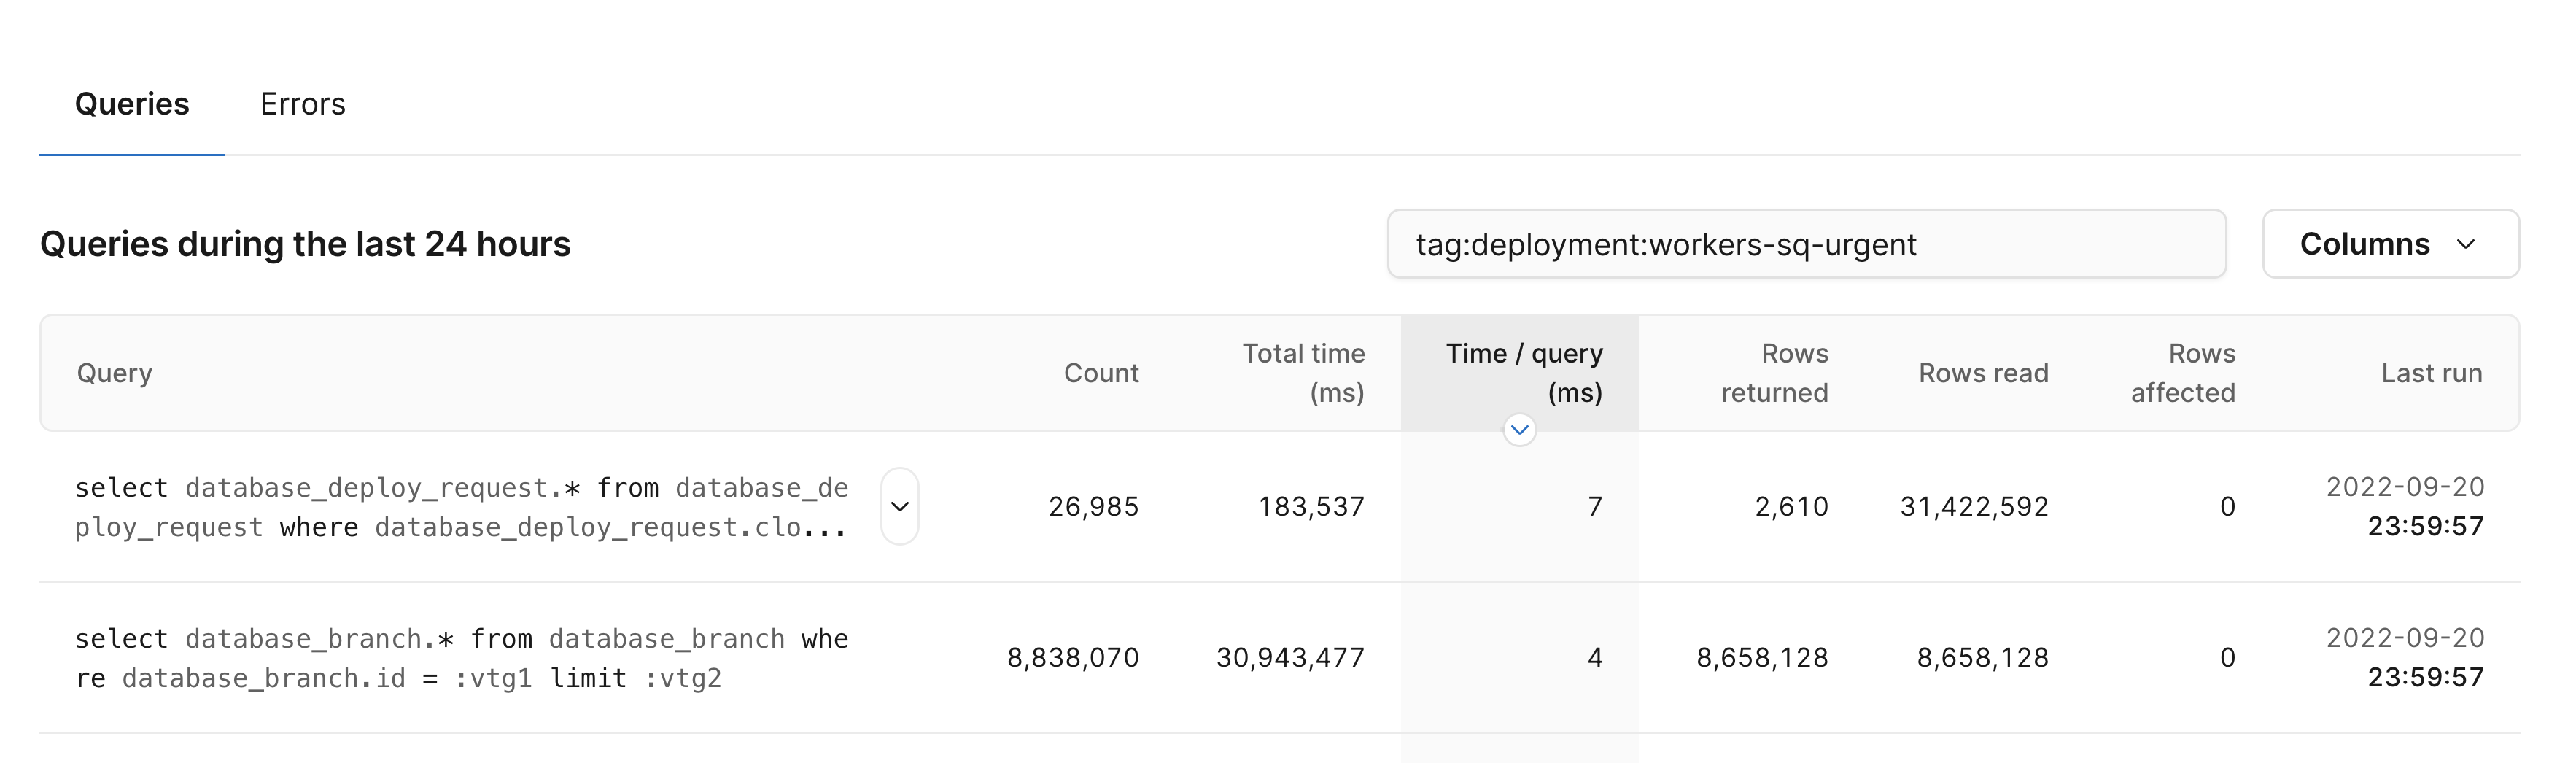
To show all queries that have a particular tag key present, regardless of the value, use tag:tag_name.
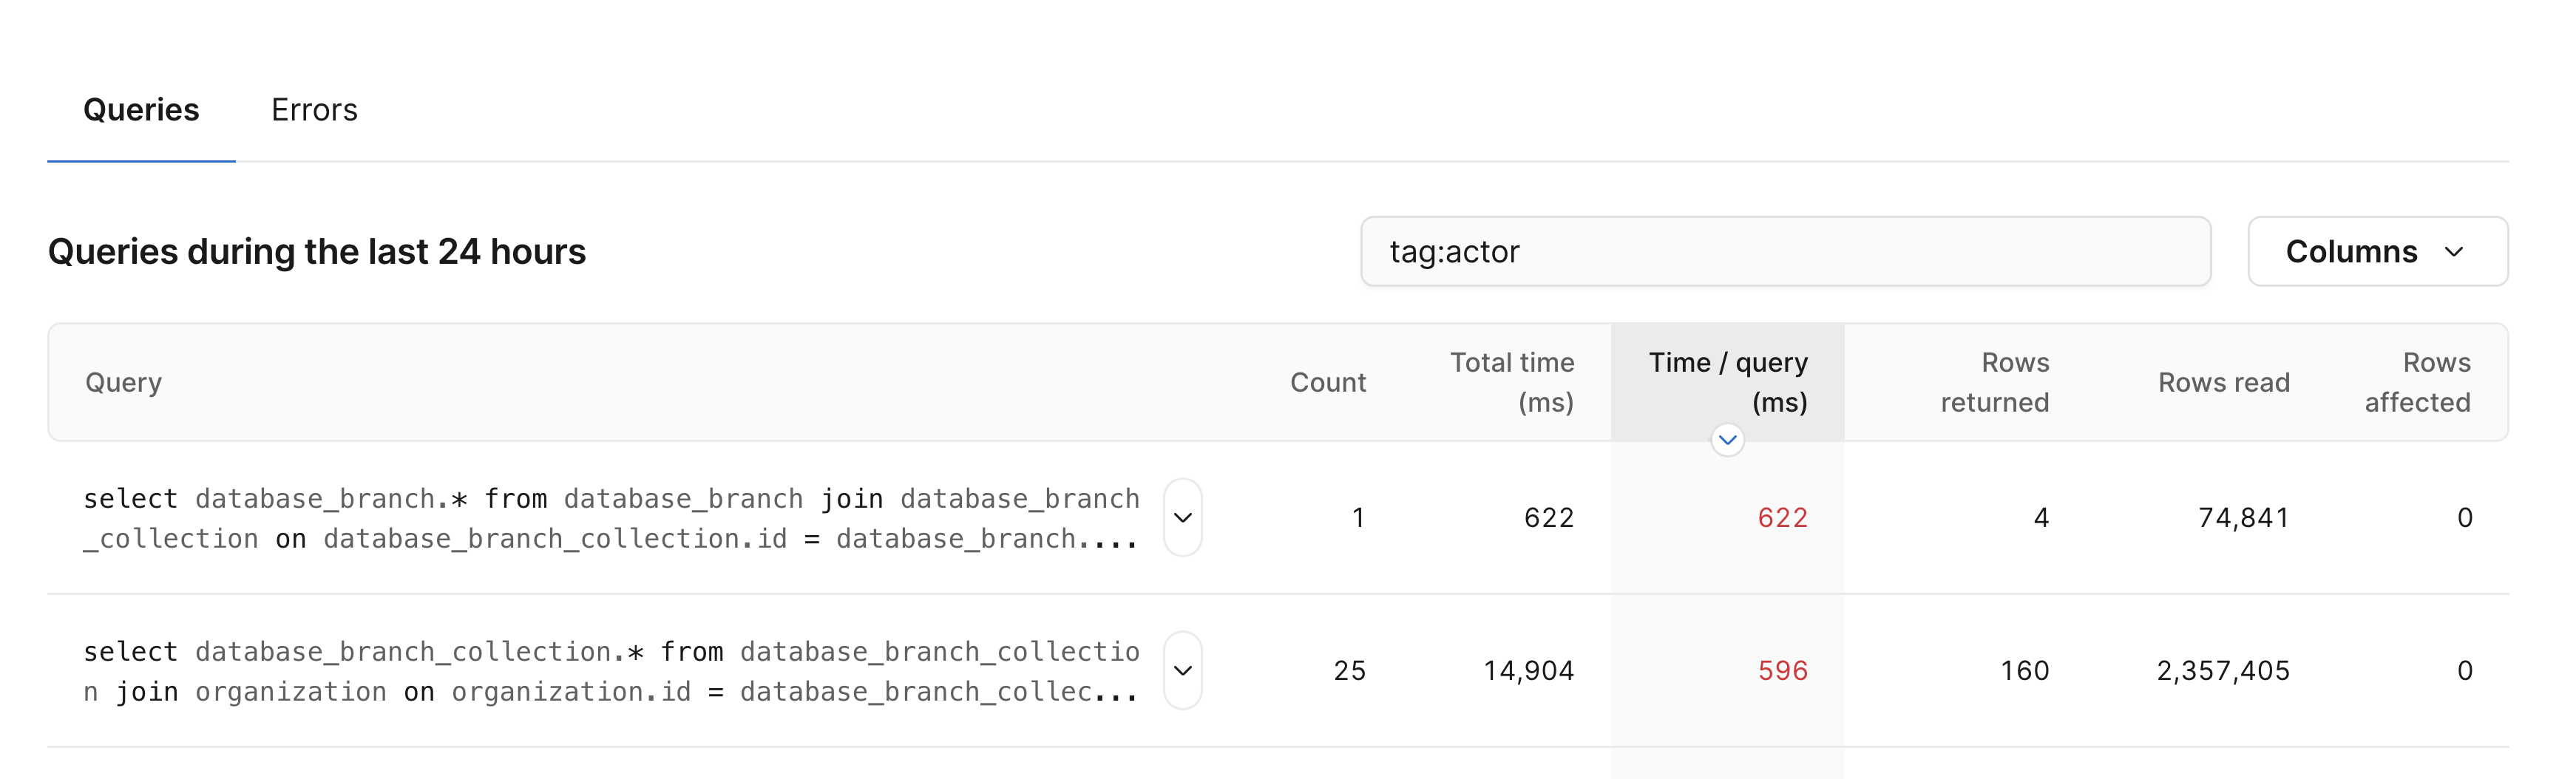
Try it out now!
Insights errors and improved tag searching functionality are available for all plans now. Try it out and let us know what you think!
For more information, check out the Query Insights documentation.