惯性聚合 高效追踪和阅读你感兴趣的博客、新闻、科技资讯
阅读原文 在惯性聚合中打开

推荐订阅源

H
Heimdal Security Blog
小众软件
小众软件
钛媒体:引领未来商业与生活新知
钛媒体:引领未来商业与生活新知
罗磊的独立博客
Google DeepMind News
大猫的无限游戏
大猫的无限游戏
奇客Solidot–传递最新科技情报
奇客Solidot–传递最新科技情报
Hugging Face - Blog
Hugging Face - Blog
阮一峰的网络日志
阮一峰的网络日志
A
About on SuperTechFans
宝玉的分享
宝玉的分享
博客园 - 聂微东
月光博客
月光博客
Cyberwarzone
Cyberwarzone
Microsoft Security Blog
V
Visual Studio Blog
Project Zero
Project Zero
T
Tor Project blog
freeCodeCamp Programming Tutorials: Python, JavaScript, Git & More
L
LINUX DO - 最新话题
博客园 - 叶小钗
Recent Commits to openclaw:main
Attack and Defense Labs
Spread Privacy
Spread Privacy
Forbes - Security
Forbes - Security
Simon Willison's Weblog
N
Netflix TechBlog - Medium
P
Proofpoint News Feed
Engineering at Meta
Engineering at Meta
Hacker News: Ask HN
Hacker News: Ask HN
I
InfoQ
M
MIT News - Artificial intelligence
AI
AI
博客园 - 三生石上(FineUI控件)
W
WeLiveSecurity
C
Check Point Blog
The Hacker News
The Hacker News
C
Cyber Attacks, Cyber Crime and Cyber Security
Application and Cybersecurity Blog
T
Tenable Blog
让小产品的独立变现更简单 - ezindie.com
Threat Intelligence Blog | Flashpoint
The Cloudflare Blog
Blog — PlanetScale
Blog — PlanetScale
美团技术团队
D
Darknet – Hacking Tools, Hacker News & Cyber Security
GbyAI
GbyAI
Hacker News - Newest:
Hacker News - Newest: "LLM"
腾讯CDC
K
Kaspersky official blog

Blog — PlanetScale

Keeping a Postgres queue healthy — PlanetScale Patterns for Postgres Traffic Control — PlanetScale Graceful degradation in Postgres — PlanetScale High memory usage in Postgres is good, actually — PlanetScale Stripe Projects partnership: Provision PlanetScale Postgres and MySQL databases from the Stripe CLI — PlanetScale Enhanced tagging in Postgres Query Insights — PlanetScale Behind the scenes: How Database Traffic Control works — PlanetScale Introducing Database Traffic Control — PlanetScale Scaling Postgres connections with PgBouncer — PlanetScale Drizzle joins PlanetScale — PlanetScale Video Conferencing with Postgres — PlanetScale Faster PlanetScale Postgres connections with Cloudflare Hyperdrive — PlanetScale Introducing the PlanetScale MCP server — PlanetScale Database Transactions — PlanetScale Automating our changelog with Cursor commands — PlanetScale Postgres 18 is now available — PlanetScale Using MotherDuck with PlanetScale — PlanetScale $50 PlanetScale Metal is GA for Postgres — PlanetScale AI-Powered Postgres index suggestions — PlanetScale $5 PlanetScale is live — PlanetScale Announcing Vitess 23 — PlanetScale $50 PlanetScale Metal — PlanetScale Report on our investigation of the 2025-10-20 incident in AWS us-east-1 — PlanetScale $5 PlanetScale — PlanetScale Benchmarking Postgres 17 vs 18 — PlanetScale Larger than RAM Vector Indexes for Relational Databases — PlanetScale Partnering with Cloudflare to bring you the fastest globally distributed applications — PlanetScale Processes and Threads — PlanetScale PlanetScale for Postgres is now GA — PlanetScale Postgres High Availability with CDC — PlanetScale Announcing Neki — PlanetScale Caching — PlanetScale The principles of extreme fault tolerance — PlanetScale Announcing PlanetScale for Postgres — PlanetScale Benchmarking Postgres — PlanetScale Announcing Vitess 22 — PlanetScale The Real Failure Rate of EBS — PlanetScale IO devices and latency — PlanetScale Announcing PlanetScale Metal — PlanetScale PlanetScale Metal: There’s no replacement for displacement — PlanetScale Upgrading Query Insights to Metal — PlanetScale Automating cherry-picks between OSS and private forks — PlanetScale Database Sharding — PlanetScale Anatomy of a Throttler, part 3 — PlanetScale Introducing sharding on PlanetScale with workflows — PlanetScale Announcing Vitess 21 — PlanetScale Announcing the PlanetScale vectors public beta — PlanetScale Anatomy of a Throttler, part 2 — PlanetScale Instant deploy requests — PlanetScale Anatomy of a Throttler, part 1 — PlanetScale Increase IOPS and throughput with sharding — PlanetScale Tracking index usage with Insights — PlanetScale Faster backups with sharding — PlanetScale Building data pipelines with Vitess — PlanetScale The State of Online Schema Migrations in MySQL — PlanetScale Optimizing aggregation in the Vitess query planner — PlanetScale Dealing with large tables — PlanetScale Announcing Vitess 20 — PlanetScale Self-managed Vitess vs Managed Vitess with PlanetScale — PlanetScale Achieving data consistency with the consistent lookup Vindex — PlanetScale The MySQL adaptive hash index — PlanetScale Introducing global replica credentials — PlanetScale Profiling memory usage in MySQL — PlanetScale Summer 2023: Fuzzing Vitess at PlanetScale — PlanetScale How PlanetScale makes schema changes — PlanetScale Identifying and profiling problematic MySQL queries — PlanetScale The Problem with Using a UUID Primary Key in MySQL — PlanetScale Announcing Vitess 19 — PlanetScale PlanetScale forever — PlanetScale Introducing schema recommendations — PlanetScale Amazon Aurora Pricing: The many surprising costs of running an Aurora database — PlanetScale Three common MySQL database design mistakes — PlanetScale OAuth applications are now available to everyone — PlanetScale Deprecating the Scaler plan — PlanetScale PlanetScale branching vs. Amazon Aurora blue/green deployments — PlanetScale Databases at scale — PlanetScale Considerations for building a database disaster recovery plan — PlanetScale Working with Geospatial Features in MySQL — PlanetScale PlanetScale vs Amazon Aurora replication — PlanetScale Introducing the Vantage and PlanetScale integration — PlanetScale MySQL isolation levels and how they work — PlanetScale Introducing the schemadiff command line tool — PlanetScale $ pscale ping — PlanetScale Announcing foreign key constraints support — PlanetScale The challenges of supporting foreign key constraints — PlanetScale What is HTAP? — PlanetScale Introducing Insights Anomalies — PlanetScale Webhook security: a hands-on guide — PlanetScale MySQL replication: Best practices and considerations — PlanetScale A guide to HTML email with Ruby on Rails and Tailwind CSS — PlanetScale Sharding for cost-effective database management — PlanetScale PlanetScale ranks 188th in Deloitte’s top 500 fastest-growing companies — PlanetScale Announcing the Fivetran integration — PlanetScale Introducing webhooks — PlanetScale What is MySQL replication and when should you use it? — PlanetScale Sync user data between Clerk and a PlanetScale MySQL database — PlanetScale Introducing database reports — PlanetScale Distributed caching systems and MySQL — PlanetScale What is MySQL partitioning? — PlanetScale MySQL High Availability: Connection handling and concurrency — PlanetScale
Pulling back the curtain: the new database overview page — PlanetScale
Holly Guevara · 2023-05-31 · via Blog — PlanetScale

Holly Guevara [@hollylawly] |

Have you ever wondered what's actually under the hood of a PlanetScale database? Starting today, you no longer have to wonder! We just released a huge update to your database overview page in the PlanetScale dashboard.

The power of PlanetScale

Our goal at PlanetScale has always been to provide the most powerful, yet easy-to-use database that "just works." We've packed a ton of power under the hood, and with this newest release, we're pulling back the curtain to make it clear exactly what you're getting with your PlanetScale database.

To start, we've moved some elements around so you now have a complete overview of the state of your database, database health, and important metrics, all on a single page:

  • Recent deploy requests
  • Query insights graph including latency, QPS, rows read/written, and errors
  • All queries during the last 24 hours
  • If safe migrations is enabled
  • If the selected branch is production or development

Tip

The "Connect" button where you previously found your connection strings is now labeled "Get connection strings".

This view is included for every branch of your database. You can select which branch you want to view from the dropdown in the top left of the interactive diagram.

In addition, we've added some new information: load balancers, primary, replicas, and shards. Let's dive into each of these.

Load balancers

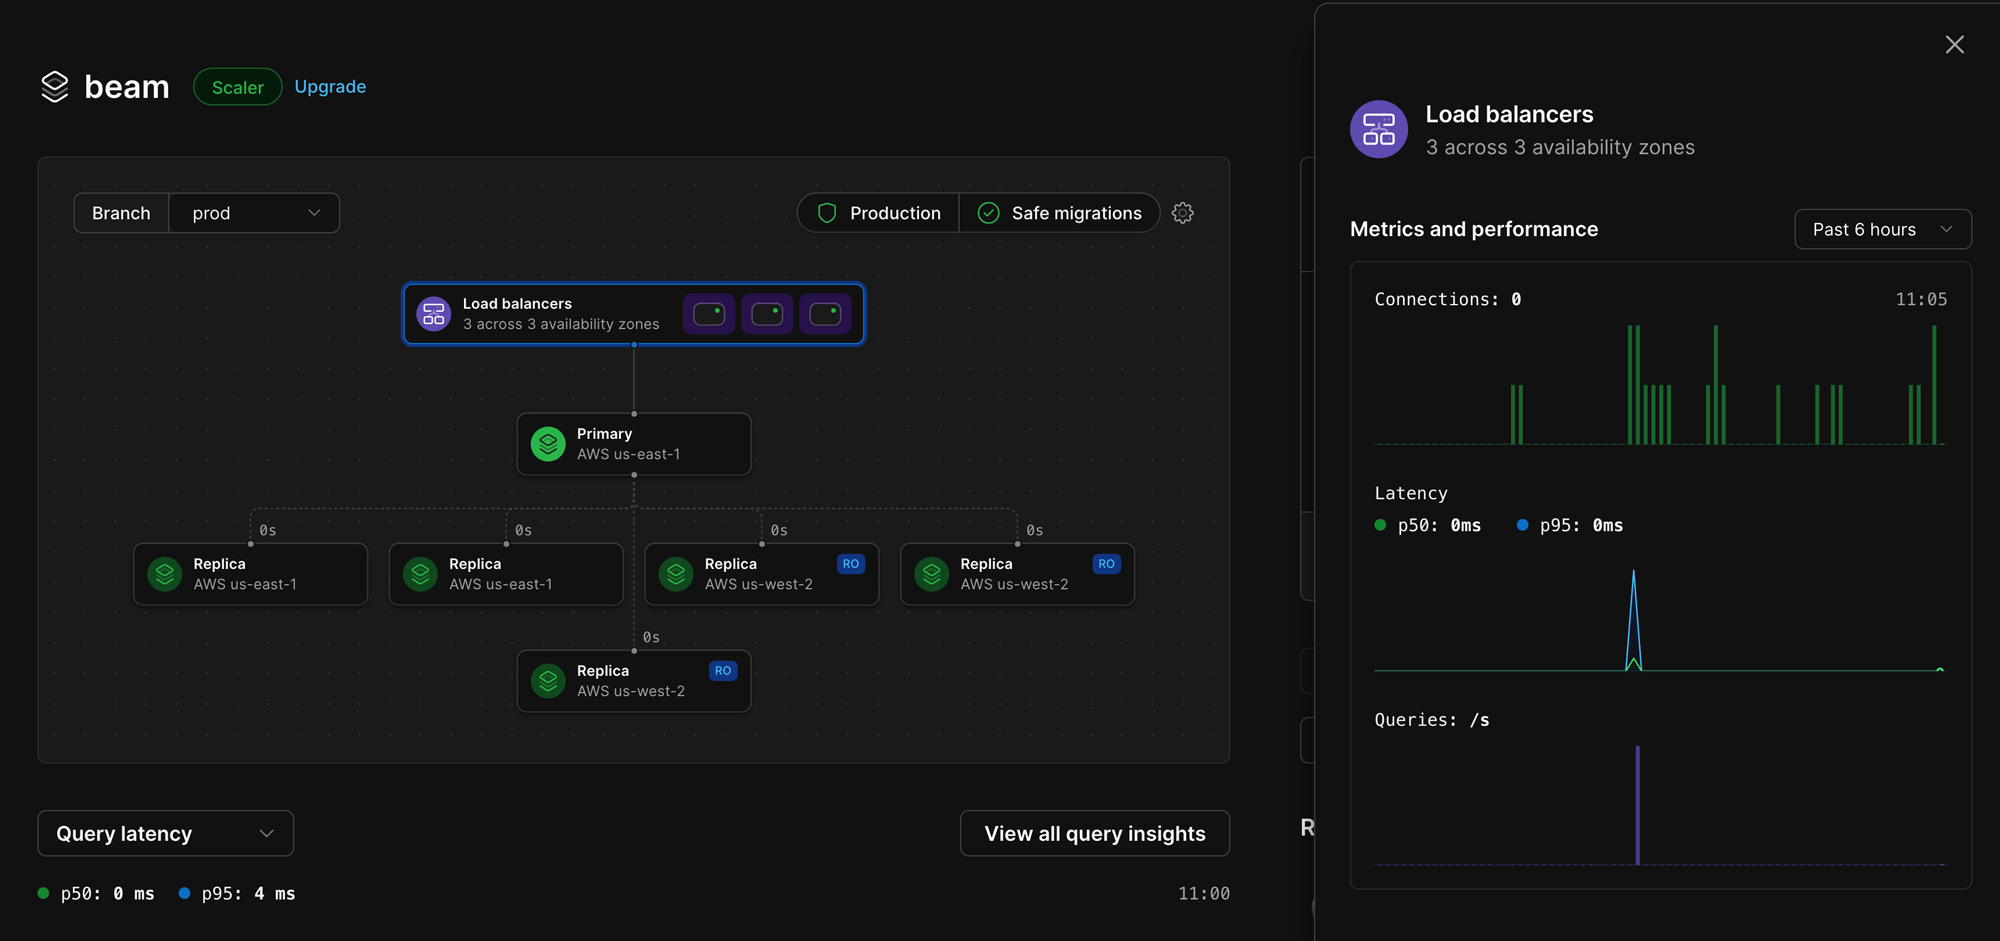
In the diagram on your database overview page, you'll see the number of load balancers included with your database as well as the number of availability zones.

Click on "Load balancers" to see a more detailed breakdown of metrics and performance: number of connections, latency, and queries per second.

PlanetScale dashboard - load balancers

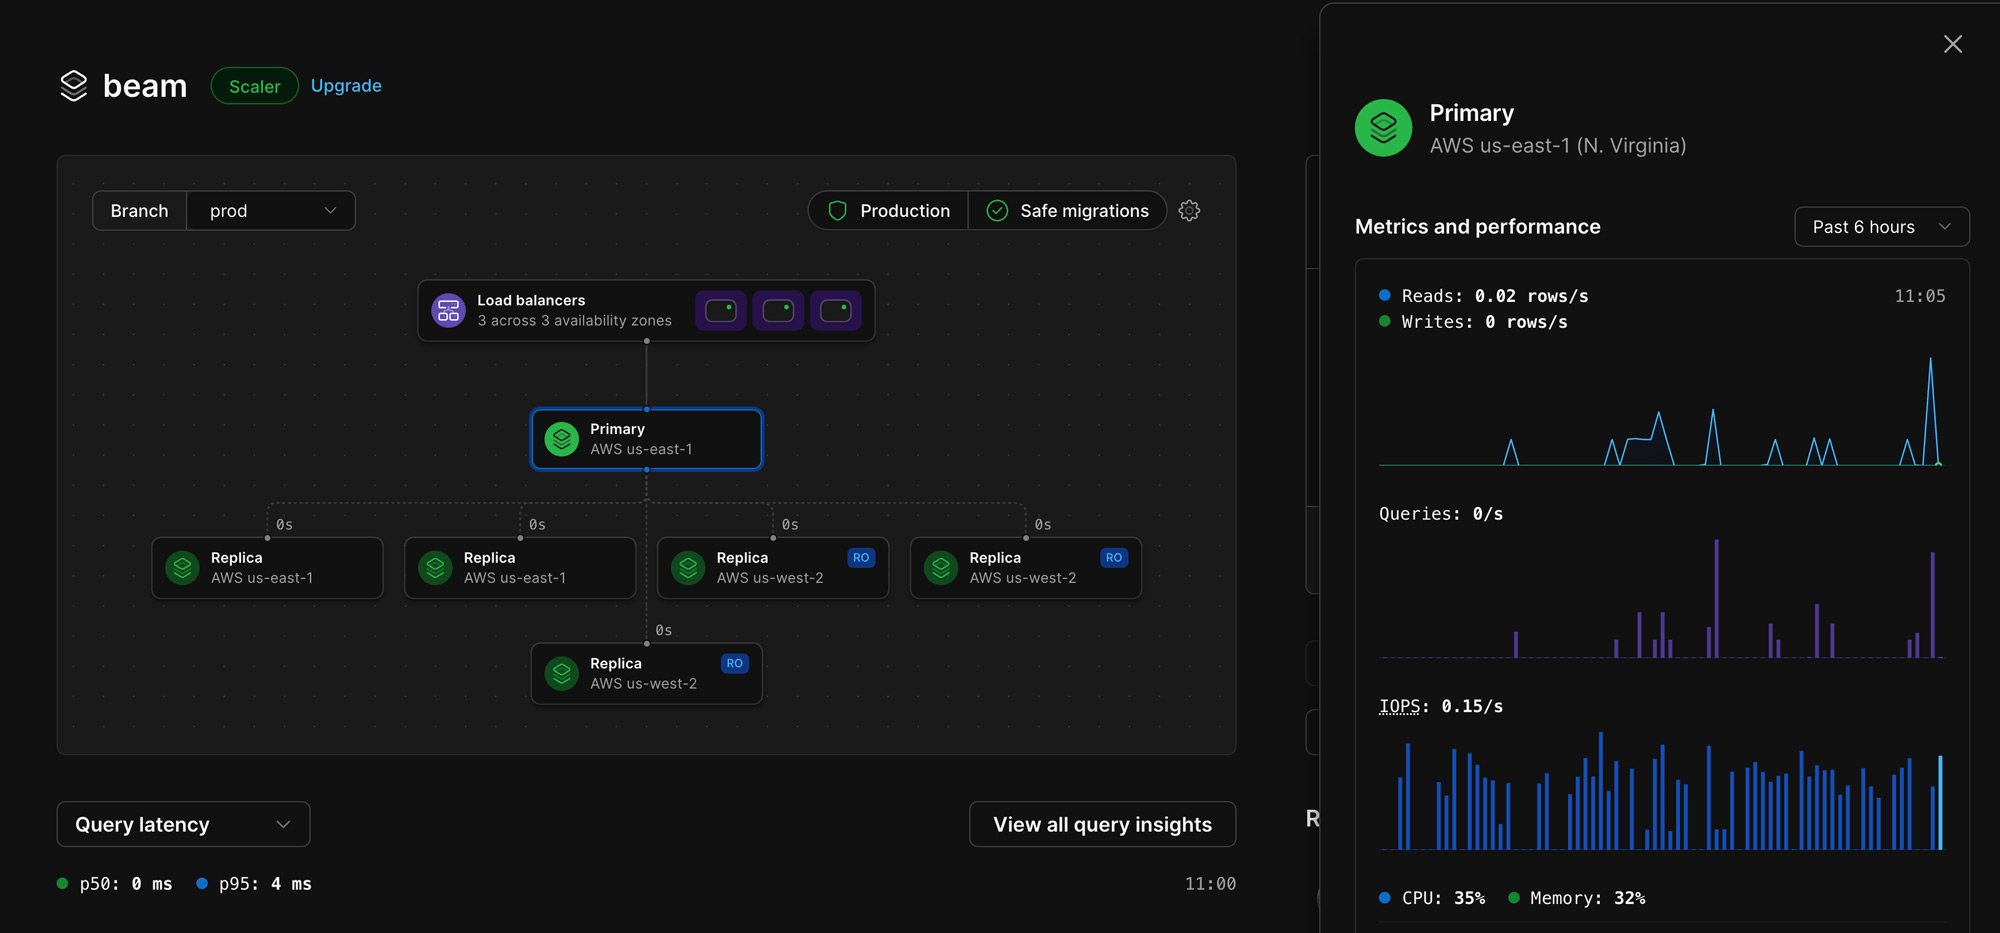
Primary, replicas, and read-only regions

Underneath "Load balancers" in the diagram, you'll see it branching down to your primary database. Here, you can see which region your primary database is in, and if you click on that, we show you some more metrics for your primary database: reads/writes per second, queries per second, input/output operations per second, CPU, and memory.

PlanetScale dashboard - database overview page primary database

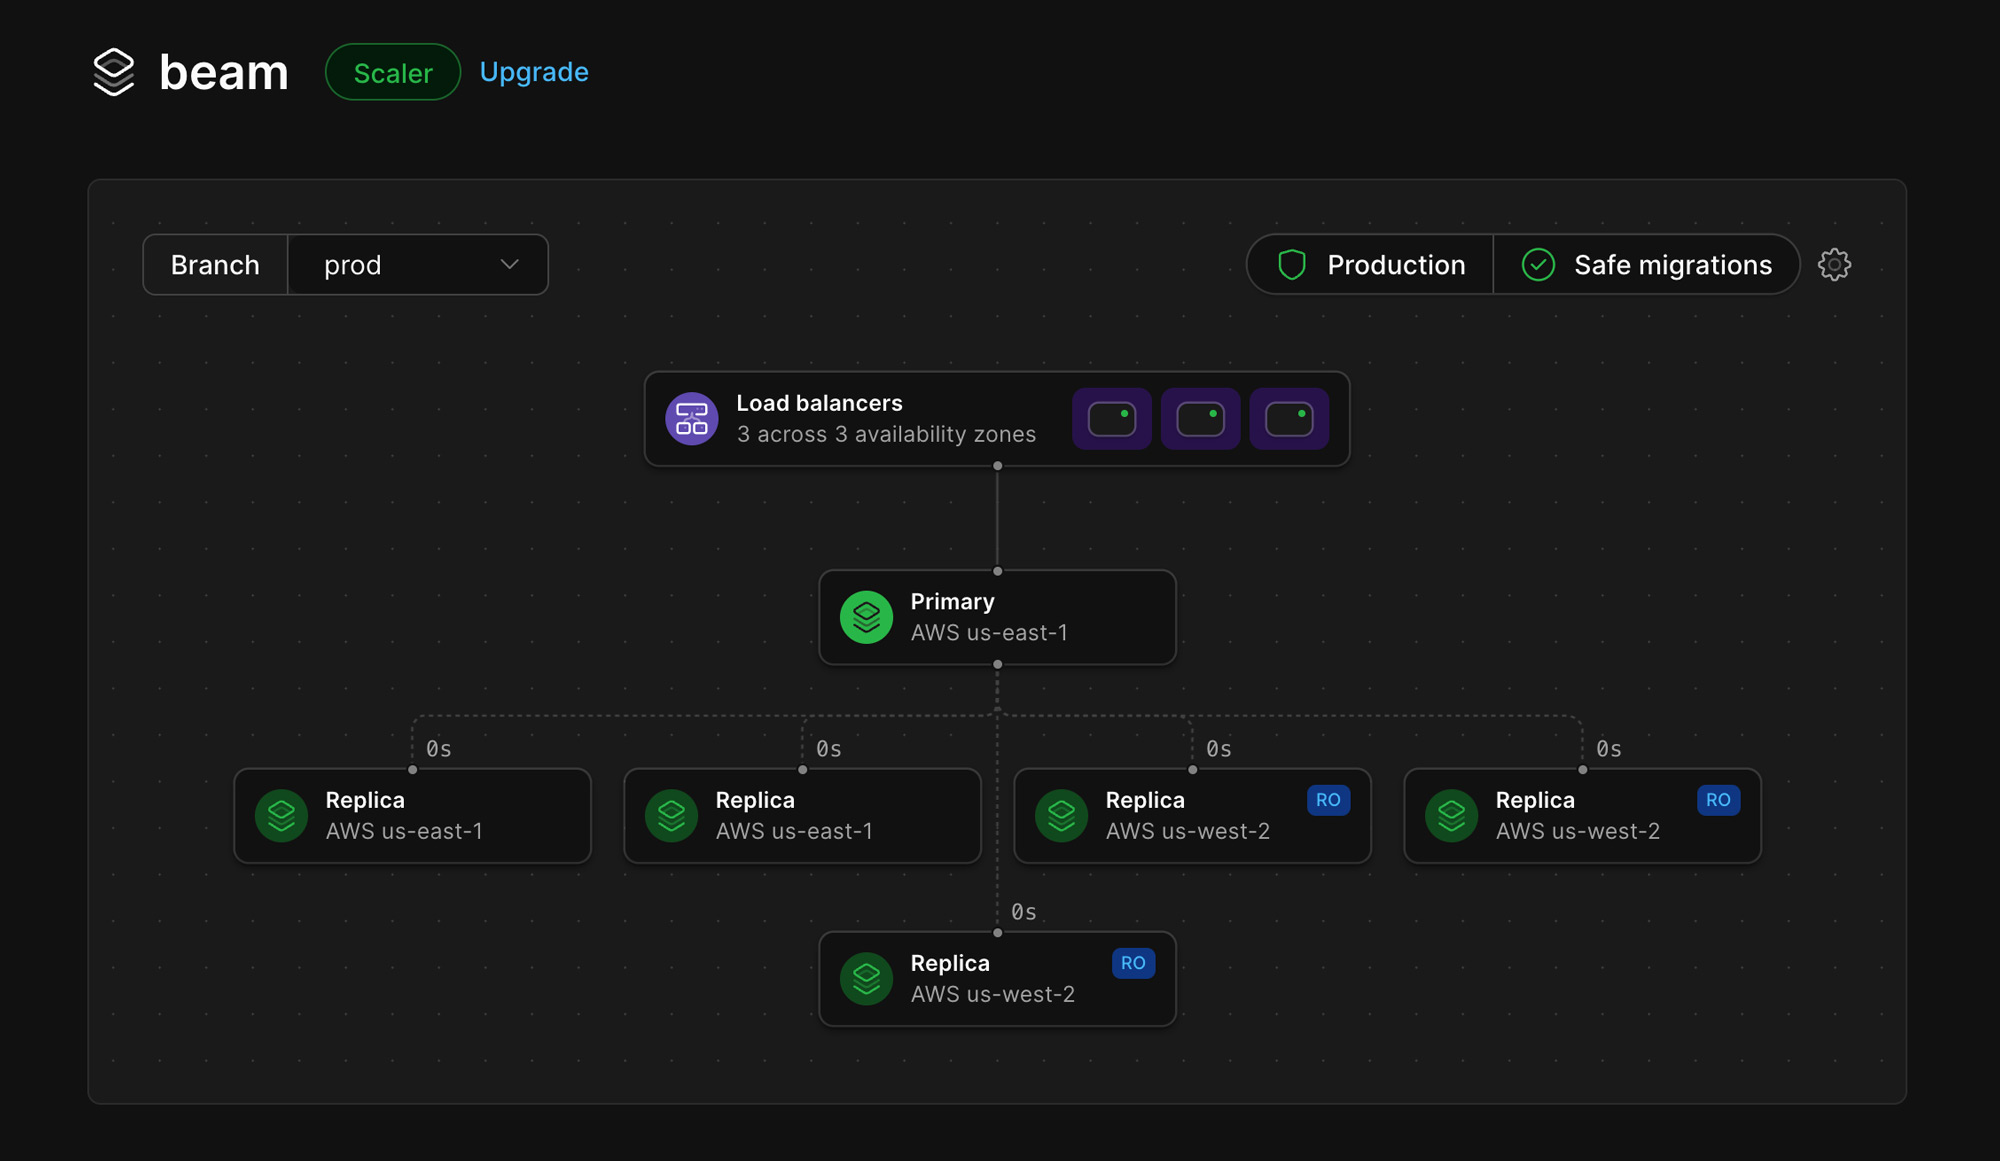
Below the primary database, you'll see branches down to all replicas. Every production branch in a database comes with at least one replica. You can click on each replica to check the performance of those as well.

Note

This diagram reveals why we recommend using a production branch for your production workloads. Production branches include additional replicas and load balancers to handle the increased workload of your production database.

Above each replica (0s in the image below), you can see the replication lag.

Additionally, if you have read-only regions, those will appear in the diagram as well with the label "RO".
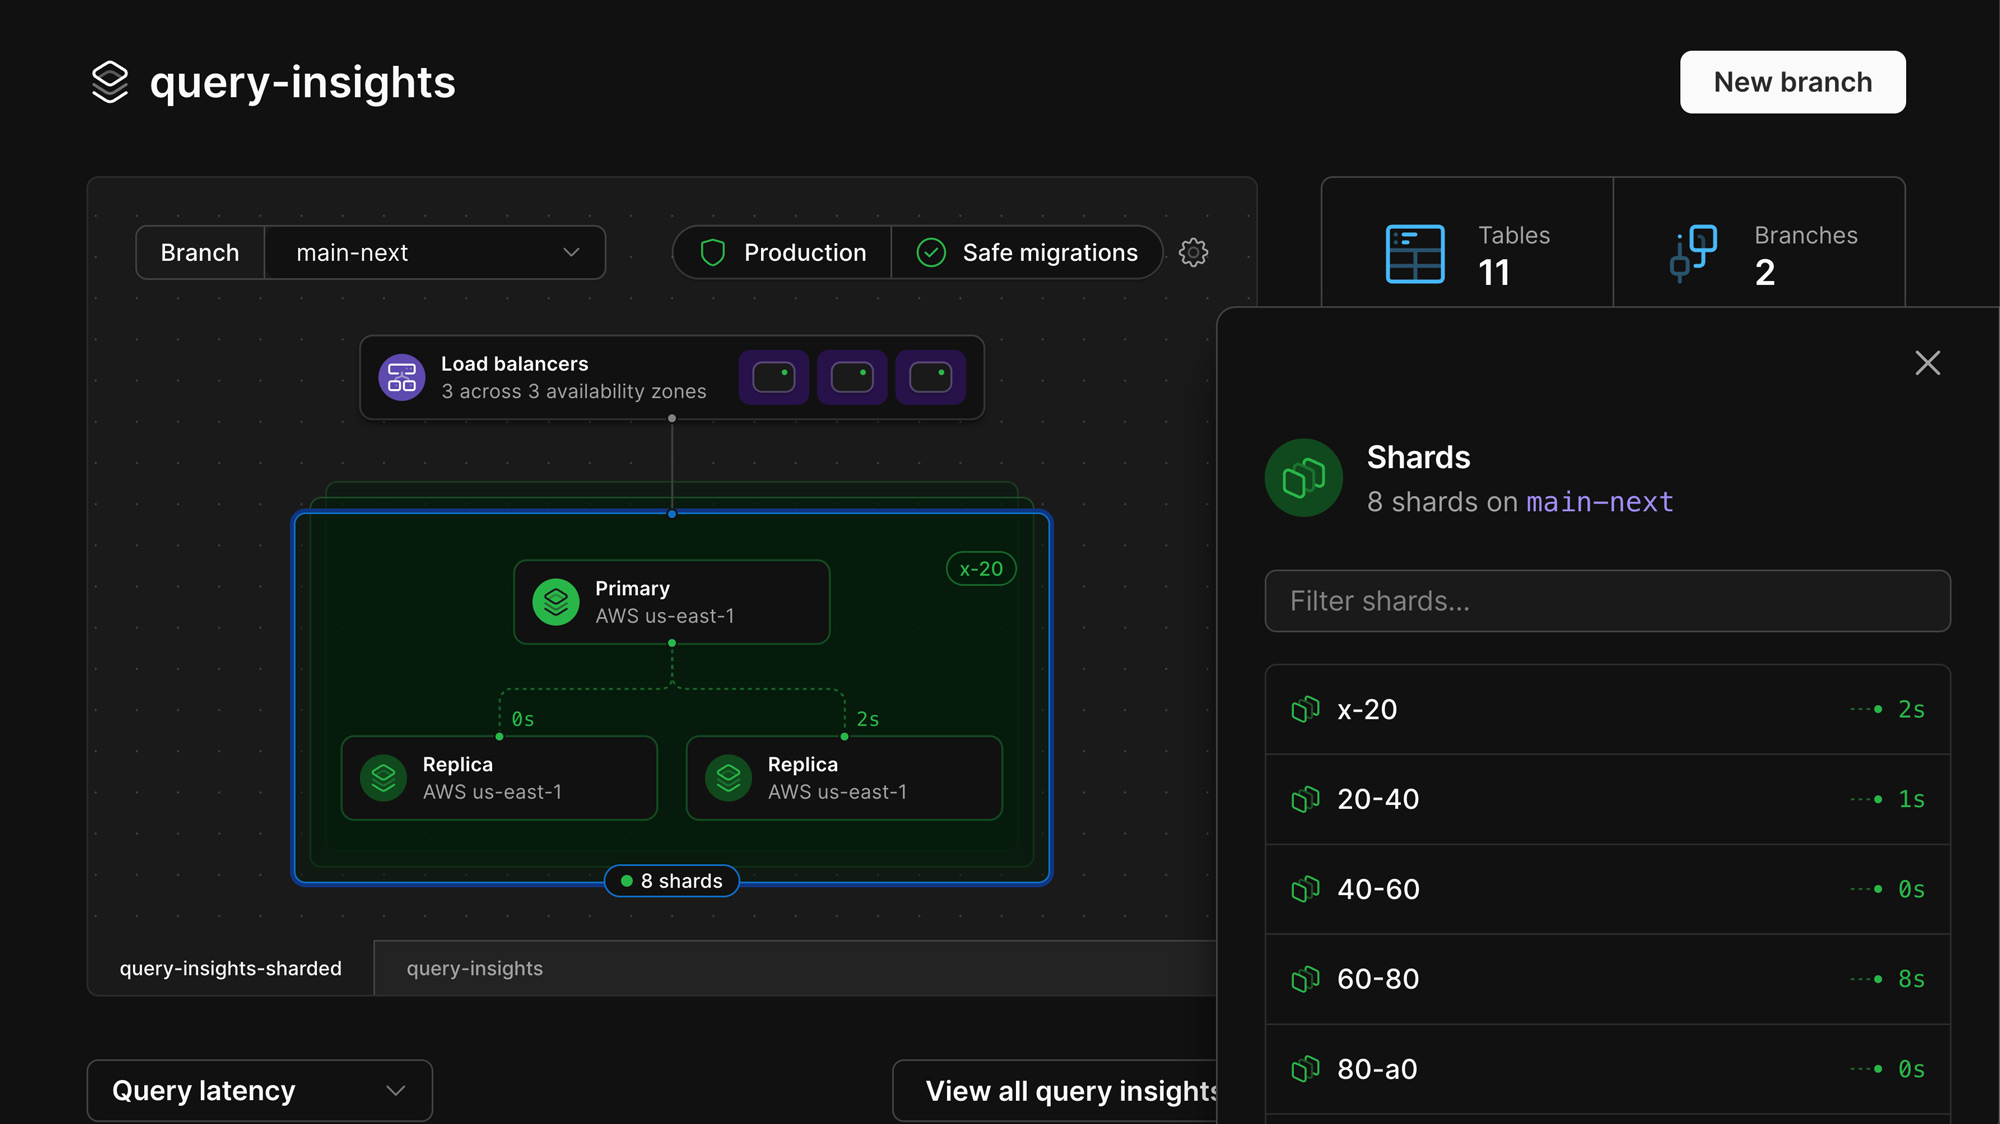
PlanetScale dashboard - database overview page read only regions

Sharded databases

If your database is sharded, we include a breakdown of this on the overview page as well. You'll see tabs at the bottom of the diagram where you can click through your different keyspaces, if you have more than one.

PlanetScale dashboard - database overview page sharding overview

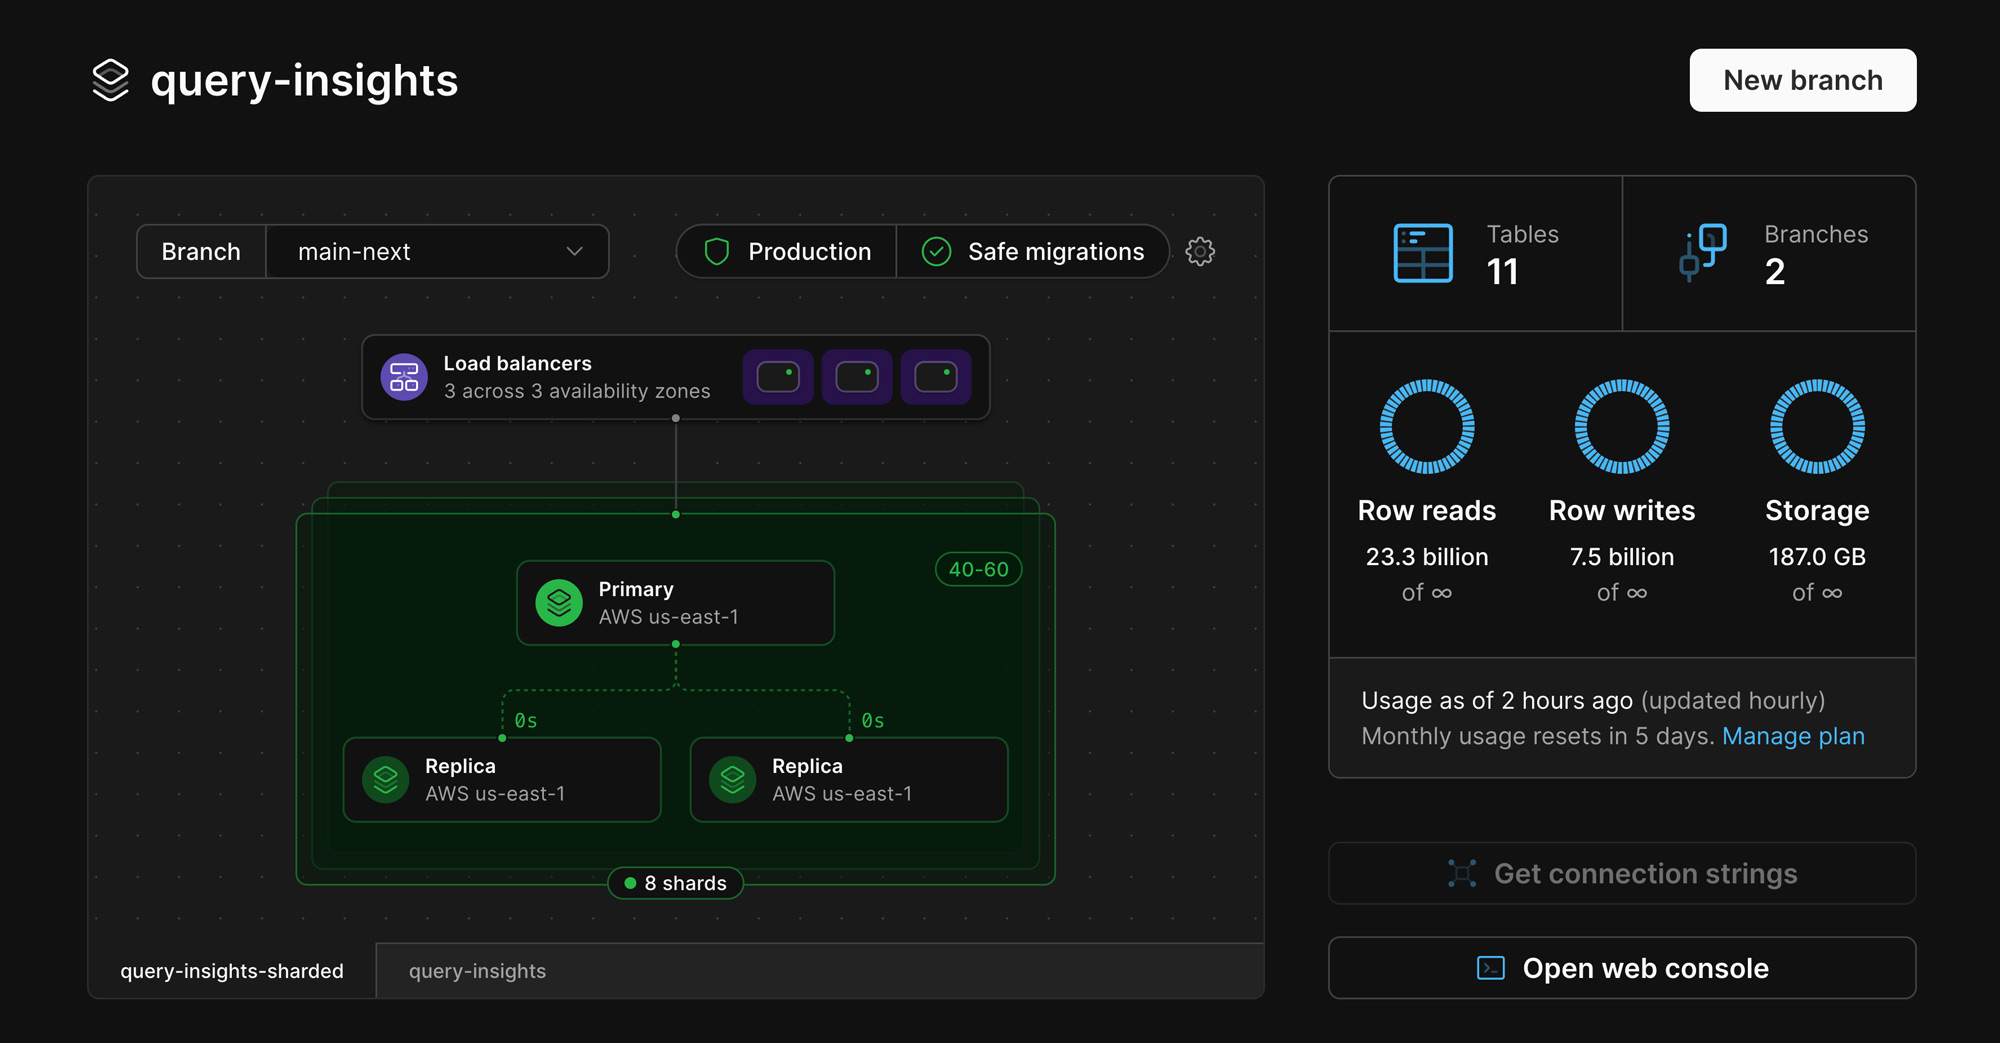
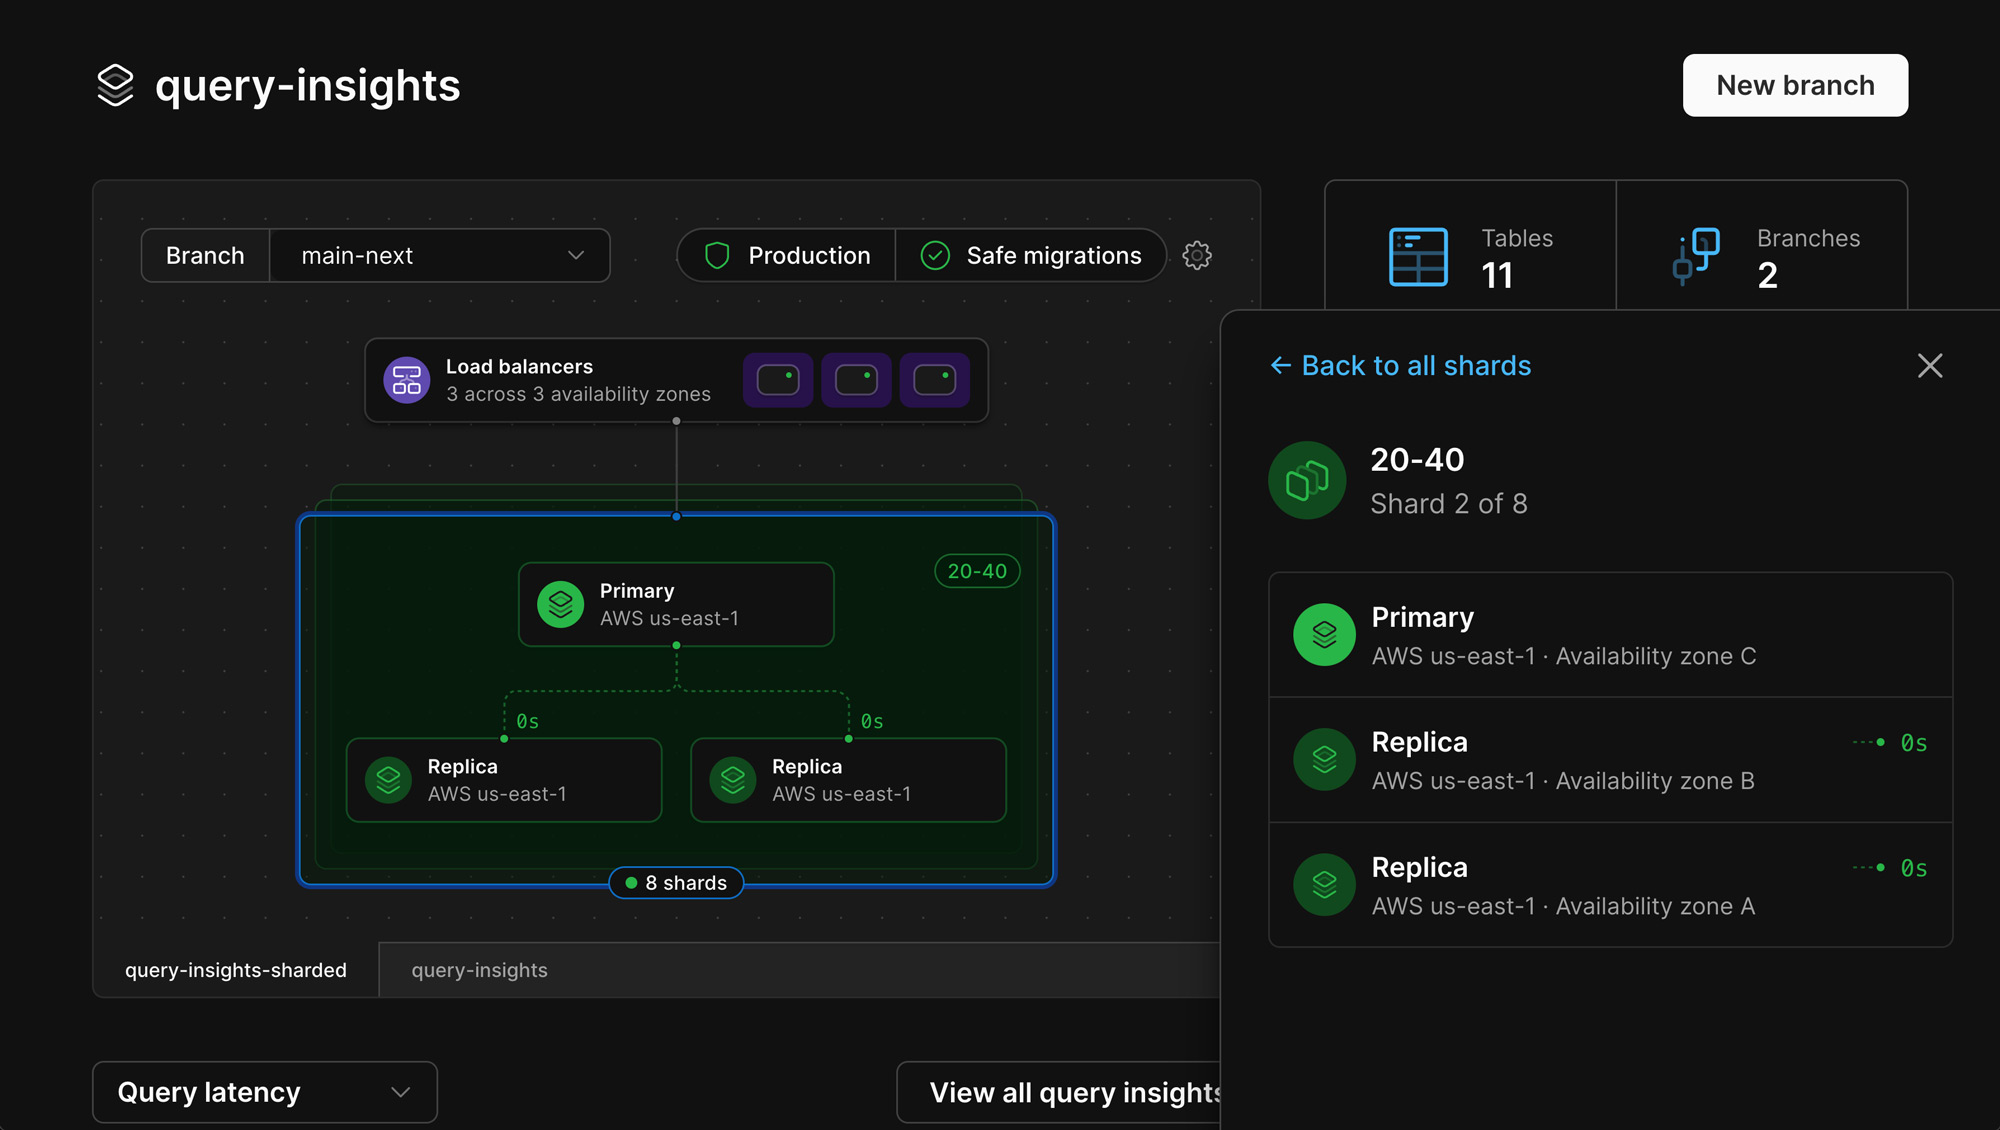
Within each sharded keyspace, you'll see the total number of shards, and clicking on the diagram pulls up a list of each shard with max replication lag. You can also click into each shard, allowing you to view information about the primary and replicas for that shard, including:

  • Region
  • Availability zone
  • Reads/writes per second
  • QPS
  • IOPs
  • CPU
  • And memory

PlanetScale dashboard - database overview page list of shards

PlanetScale dashboard - database overview page single shard details

Check it out

If you have an existing PlanetScale database, you can head to your dashboard right now to see this new update. Remember, nothing has changed with your database, we're simply revealing what has always been under the hood. And if you haven't explored PlanetScale yet, you can sign up for an account now.

If you have any questions or feedback, don't hesitate to reach out! Head to our Contact page or find us on Twitter at @planetscale.

You can learn more about PlanetScale architecture in our Architecture documentation.