

惯性聚合 高效追踪和阅读你感兴趣的博客、新闻、科技资讯
阅读原文 在惯性聚合中打开

推荐订阅源

L
LINUX DO - 最新话题
小众软件
小众软件
C
Check Point Blog
酷 壳 – CoolShell
酷 壳 – CoolShell
V
Visual Studio Blog
Last Week in AI
Last Week in AI
P
Proofpoint News Feed
奇客Solidot–传递最新科技情报
奇客Solidot–传递最新科技情报
The GitHub Blog
The GitHub Blog
T
Tailwind CSS Blog
Recorded Future
Recorded Future
雷峰网
雷峰网
WordPress大学
WordPress大学
A
Arctic Wolf
Threat Intelligence Blog | Flashpoint
Project Zero
Project Zero
T
Tor Project blog
T
Threat Research - Cisco Blogs
Scott Helme
Scott Helme
Spread Privacy
Spread Privacy
G
Google Developers Blog
Security Latest
Security Latest
MongoDB | Blog
MongoDB | Blog
T
Threatpost
I
InfoQ
T
Tenable Blog
T
The Exploit Database - CXSecurity.com
S
Security Affairs
H
Hackread – Cybersecurity News, Data Breaches, AI and More
人人都是产品经理
人人都是产品经理
C
Cisco Blogs
博客园 - 三生石上(FineUI控件)
cs.CL updates on arXiv.org
aimingoo的专栏
aimingoo的专栏
C
CXSECURITY Database RSS Feed - CXSecurity.com
美团技术团队
Google DeepMind News
The Hacker News
The Hacker News
D
Docker
博客园 - 【当耐特】
大猫的无限游戏
大猫的无限游戏
让小产品的独立变现更简单 - ezindie.com
Vercel News
Vercel News
PCI Perspectives
PCI Perspectives
Microsoft Azure Blog
C
CERT Recently Published Vulnerability Notes
月光博客
月光博客
Cloudbric
Cloudbric
A
About on SuperTechFans
F
Fortinet All Blogs

Blog — PlanetScale

Keeping a Postgres queue healthy — PlanetScale Patterns for Postgres Traffic Control — PlanetScale Graceful degradation in Postgres — PlanetScale High memory usage in Postgres is good, actually — PlanetScale Stripe Projects partnership: Provision PlanetScale Postgres and MySQL databases from the Stripe CLI — PlanetScale Enhanced tagging in Postgres Query Insights — PlanetScale Behind the scenes: How Database Traffic Control works — PlanetScale Introducing Database Traffic Control — PlanetScale Scaling Postgres connections with PgBouncer — PlanetScale Drizzle joins PlanetScale — PlanetScale Video Conferencing with Postgres — PlanetScale Faster PlanetScale Postgres connections with Cloudflare Hyperdrive — PlanetScale Introducing the PlanetScale MCP server — PlanetScale Database Transactions — PlanetScale Automating our changelog with Cursor commands — PlanetScale Postgres 18 is now available — PlanetScale Using MotherDuck with PlanetScale — PlanetScale $50 PlanetScale Metal is GA for Postgres — PlanetScale AI-Powered Postgres index suggestions — PlanetScale $5 PlanetScale is live — PlanetScale Announcing Vitess 23 — PlanetScale $50 PlanetScale Metal — PlanetScale Report on our investigation of the 2025-10-20 incident in AWS us-east-1 — PlanetScale $5 PlanetScale — PlanetScale Benchmarking Postgres 17 vs 18 — PlanetScale Larger than RAM Vector Indexes for Relational Databases — PlanetScale Partnering with Cloudflare to bring you the fastest globally distributed applications — PlanetScale Processes and Threads — PlanetScale PlanetScale for Postgres is now GA — PlanetScale Postgres High Availability with CDC — PlanetScale Announcing Neki — PlanetScale Caching — PlanetScale The principles of extreme fault tolerance — PlanetScale Announcing PlanetScale for Postgres — PlanetScale Benchmarking Postgres — PlanetScale Announcing Vitess 22 — PlanetScale The Real Failure Rate of EBS — PlanetScale IO devices and latency — PlanetScale Announcing PlanetScale Metal — PlanetScale PlanetScale Metal: There’s no replacement for displacement — PlanetScale Upgrading Query Insights to Metal — PlanetScale Automating cherry-picks between OSS and private forks — PlanetScale Database Sharding — PlanetScale Anatomy of a Throttler, part 3 — PlanetScale Introducing sharding on PlanetScale with workflows — PlanetScale Announcing Vitess 21 — PlanetScale Announcing the PlanetScale vectors public beta — PlanetScale Anatomy of a Throttler, part 2 — PlanetScale Instant deploy requests — PlanetScale Anatomy of a Throttler, part 1 — PlanetScale Increase IOPS and throughput with sharding — PlanetScale Tracking index usage with Insights — PlanetScale Faster backups with sharding — PlanetScale Building data pipelines with Vitess — PlanetScale The State of Online Schema Migrations in MySQL — PlanetScale Optimizing aggregation in the Vitess query planner — PlanetScale Dealing with large tables — PlanetScale Announcing Vitess 20 — PlanetScale Self-managed Vitess vs Managed Vitess with PlanetScale — PlanetScale Achieving data consistency with the consistent lookup Vindex — PlanetScale The MySQL adaptive hash index — PlanetScale Introducing global replica credentials — PlanetScale Profiling memory usage in MySQL — PlanetScale Summer 2023: Fuzzing Vitess at PlanetScale — PlanetScale How PlanetScale makes schema changes — PlanetScale Identifying and profiling problematic MySQL queries — PlanetScale The Problem with Using a UUID Primary Key in MySQL — PlanetScale Announcing Vitess 19 — PlanetScale PlanetScale forever — PlanetScale Introducing schema recommendations — PlanetScale Amazon Aurora Pricing: The many surprising costs of running an Aurora database — PlanetScale Three common MySQL database design mistakes — PlanetScale OAuth applications are now available to everyone — PlanetScale Deprecating the Scaler plan — PlanetScale PlanetScale branching vs. Amazon Aurora blue/green deployments — PlanetScale Databases at scale — PlanetScale Considerations for building a database disaster recovery plan — PlanetScale Working with Geospatial Features in MySQL — PlanetScale PlanetScale vs Amazon Aurora replication — PlanetScale Introducing the Vantage and PlanetScale integration — PlanetScale MySQL isolation levels and how they work — PlanetScale Introducing the schemadiff command line tool — PlanetScale $ pscale ping — PlanetScale Announcing foreign key constraints support — PlanetScale The challenges of supporting foreign key constraints — PlanetScale What is HTAP? — PlanetScale Introducing Insights Anomalies — PlanetScale Webhook security: a hands-on guide — PlanetScale Announcing the Fivetran integration — PlanetScale Introducing webhooks — PlanetScale What is MySQL replication and when should you use it? — PlanetScale Sync user data between Clerk and a PlanetScale MySQL database — PlanetScale Introducing database reports — PlanetScale Distributed caching systems and MySQL — PlanetScale What is MySQL partitioning? — PlanetScale MySQL High Availability: Connection handling and concurrency — PlanetScale Personalizing your onboarding with Markdoc — PlanetScale PlanetScale vs. Amazon Aurora — PlanetScale PlanetScale vs. Amazon RDS — PlanetScale PlanetScale is bringing vector search and storage to MySQL — PlanetScale
See what your database is doing right now with Connections — PlanetScale
Brett Warmin · 2026-06-15 · via Blog — PlanetScale

Brett Warminski |

Much of database debugging eventually turns into carefully inspecting what each connection is doing. In Postgres, this means watching pg_stat_activity in a loop. In Vitess, it means watching SHOW FULL PROCESSLIST the same way.

Tools like Query Insights are useful for exploring the recent history of queries. They can tell you what was slow, what's consuming resources, and where to spend tuning effort.

But during an active incident, the questions are more immediate. What's happening this second? Did the last thing I changed fix it?

Manual monitoring

Here's a manual version of this workflow in Postgres:

SELECT pid, state, wait_event_type, wait_event,
       now() - xact_start AS tx_age,
       pg_blocking_pids(pid) AS blocked_by,
       left(query, 60) AS query
FROM pg_stat_activity
WHERE state <> 'idle'
ORDER BY tx_age DESC;

Run it over and over again in a terminal and it's a pretty effective view of the database.

It's also a rough interface.

You're scanning rows as they move around, trying to reconstruct what's blocking progress, and hunting for the one detail that actually matters for the fix.

The worst version of this problem is when you can't connect at all because the database has exhausted all of its connections. You can't fix what you can't connect to.

That workflow shaped the design of Connections, a new feature of the pscale CLI available today for PlanetScale Postgres and Vitess (MySQL) databases.

Simpler debugging with Connections

Here's that same debugging flow using the new pscale branch connections top functionality with a Postgres database, instead of pasting that pg_stat_activity query in a loop and comparing output:

pscale branch connections top <database> <branch>

Connections opens an interactive live view that refreshes about once a second and sorts the sessions most likely to matter toward the top. There are keyboard shortcuts to navigate the list of connections and inspect each one in more detail.

Columns in the list include the Process ID (PID), status, number of blocked queries, why they're waiting, and more.
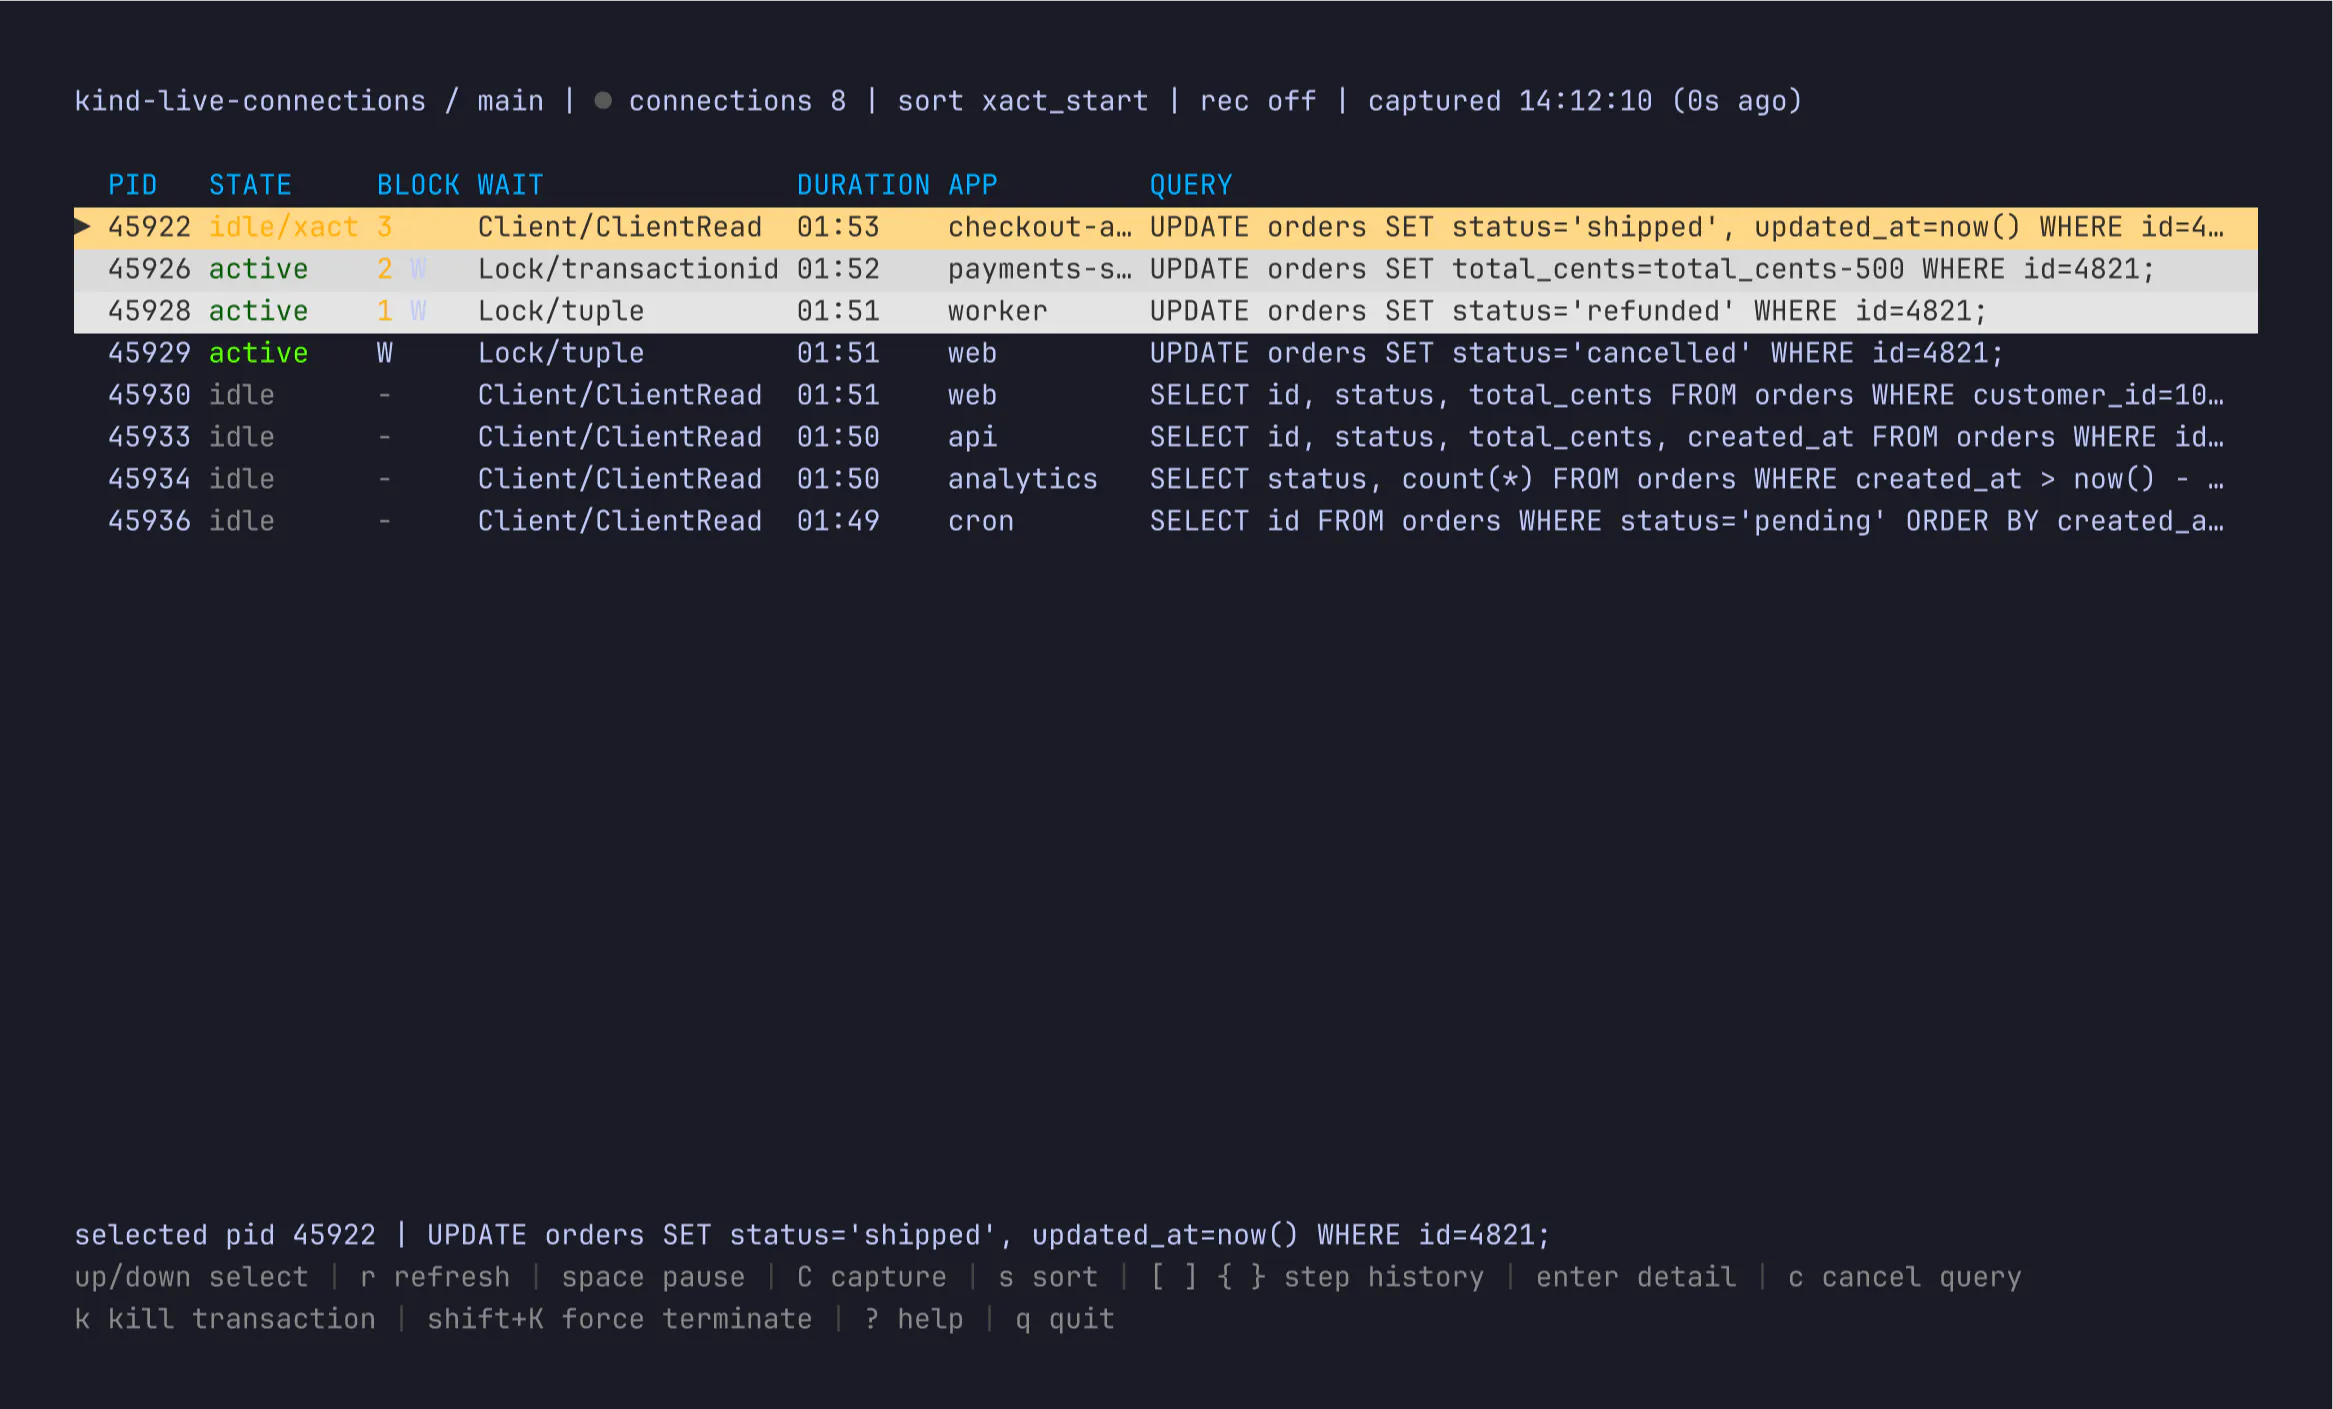
The pscale branch connections top view, with a stuck checkout transaction at the top

Say your writes are backing up and the app is timing out. In this example, an idle transaction from checkout-api is holding up three other writes. Open the row, and the blocker tree shows the queue behind it:
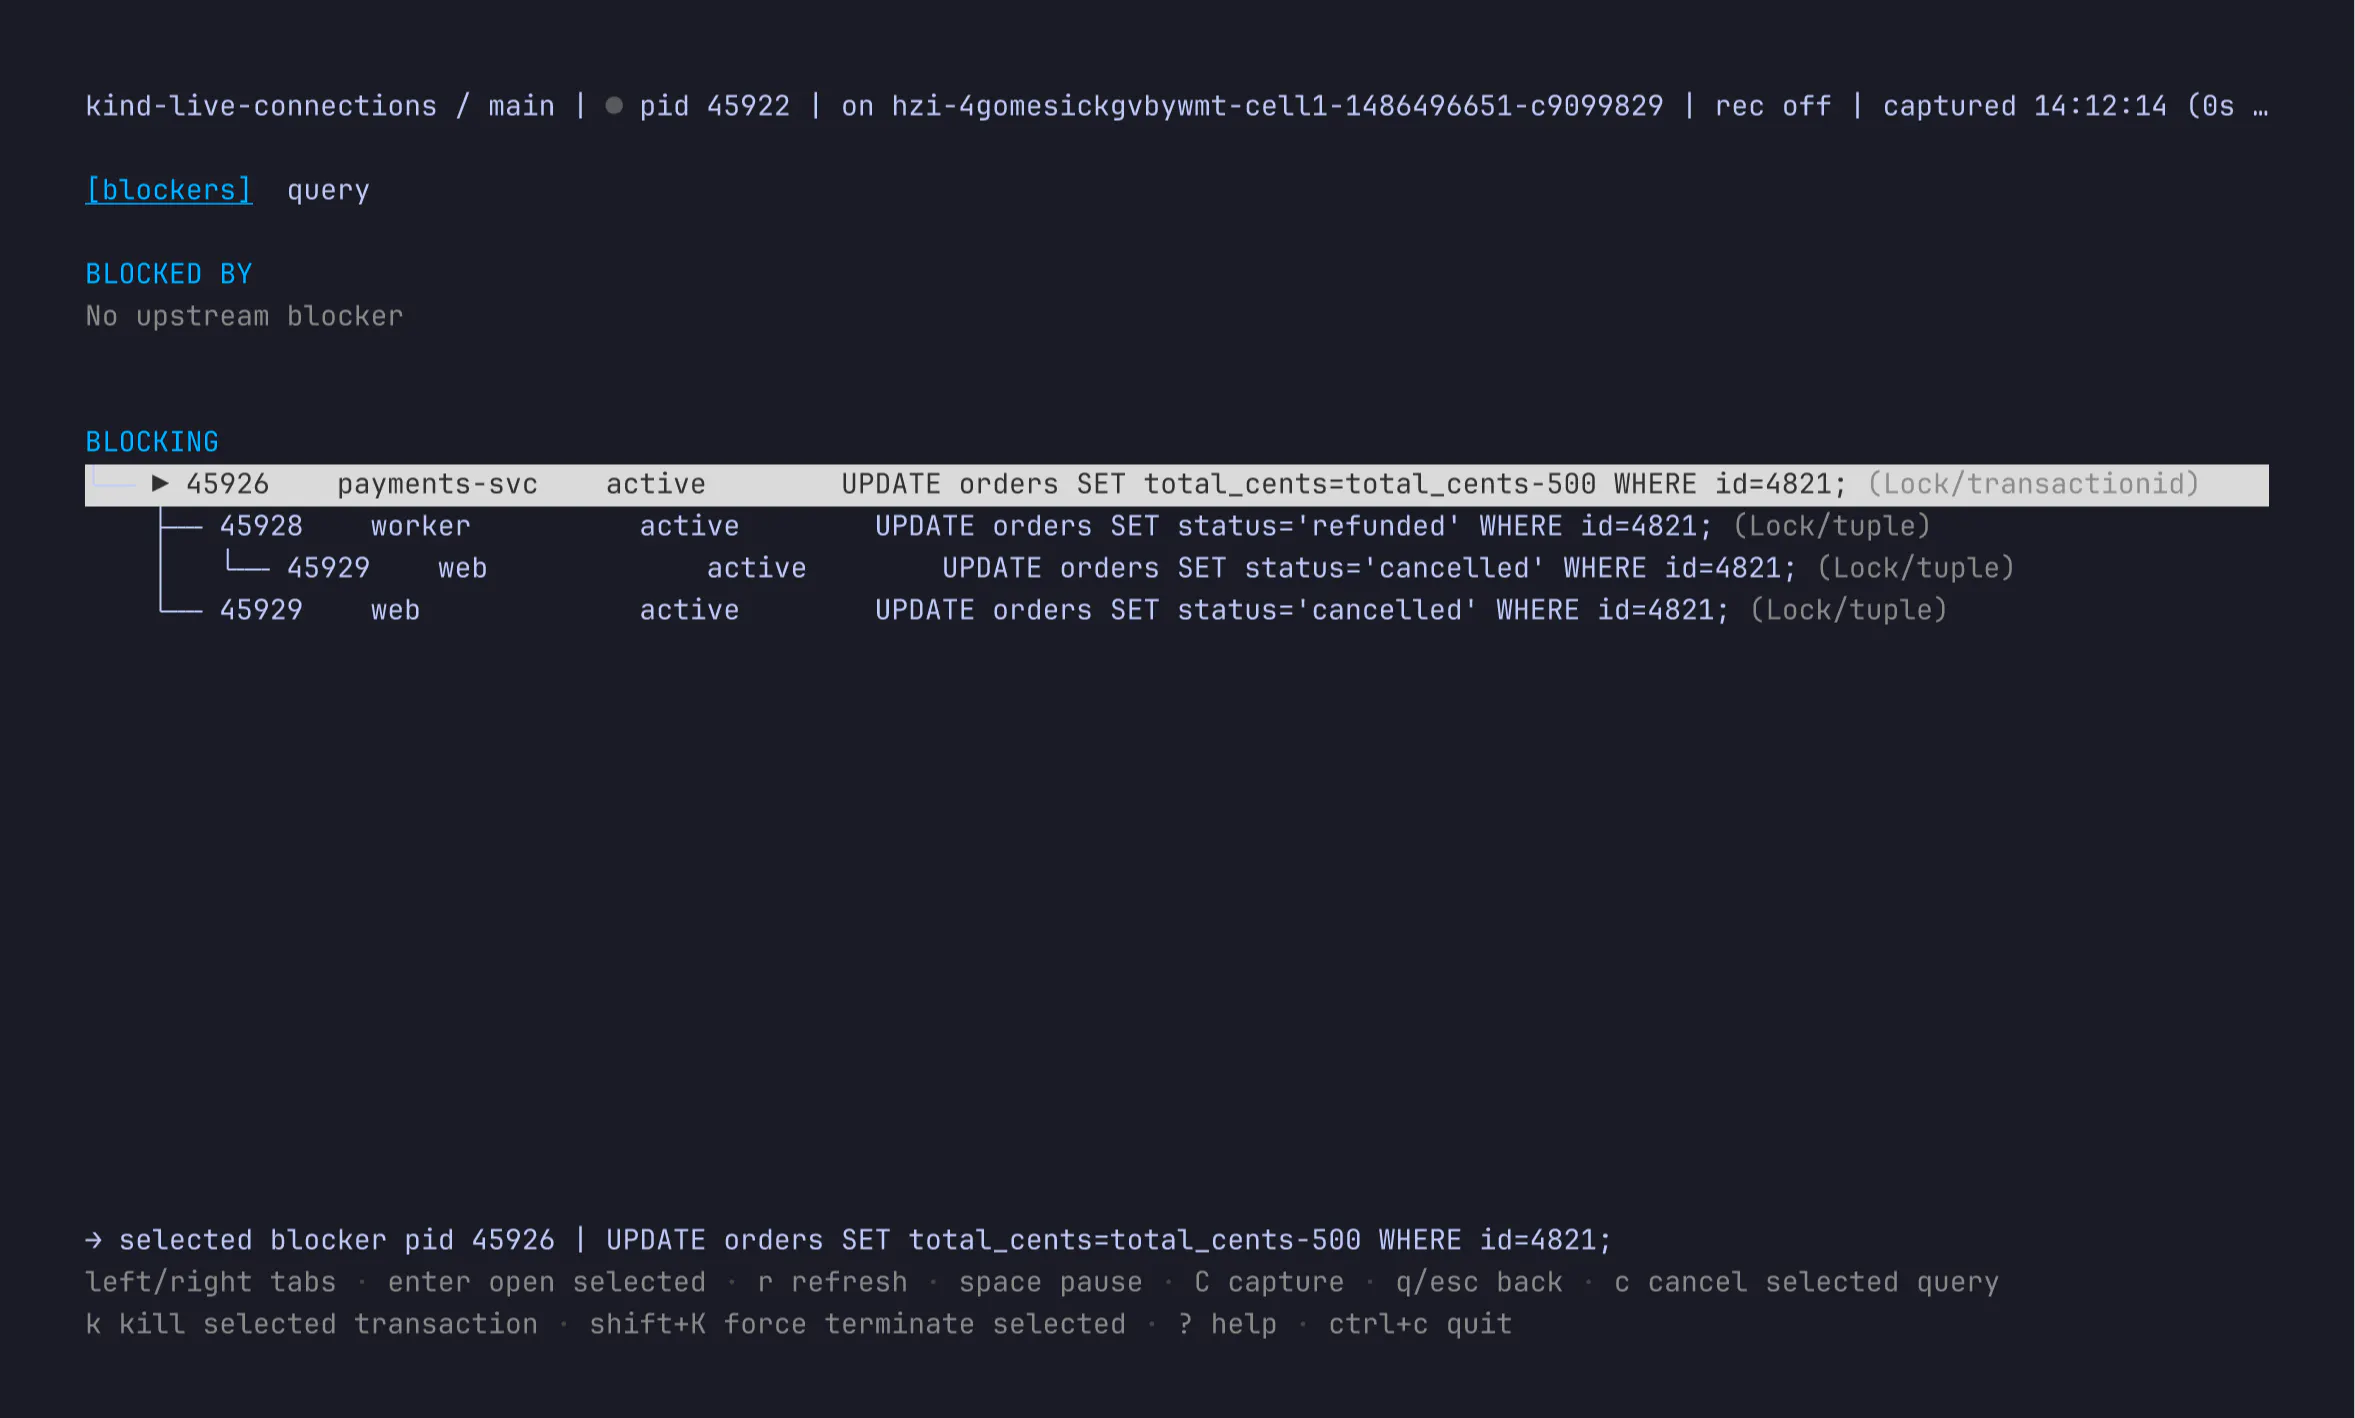
The blocker tree: one idle checkout-api transaction holding up the refund, payment, and cancel updates queued behind it

From there you can decide whether the right fix is to cancel a query or terminate the connection. You no longer need to remember the syntax of pg_stat_activity, retrace the blocker chain by hand or copy and paste PIDs around.

Keep enough history to see the pattern

Another problem with running that query in a loop is that the interesting moment flies by. Connections keeps a recent rolling history, so you can pause, step forward and backward with [ and ], and see how the state has changed.

You can also capture a session to a file. You can record everything you see in Connections by pressing C. This includes the recent history already buffered in memory and keeps appending from there. Perfect for handing off logs to agents to assist with debugging.

That also makes it easier to write a postmortem, share what happened with a teammate, or replay the same view later instead of describing it from memory.

Available even when connections are exhausted

The stress of debugging an active incident is worse when you can't even connect to the database yourself.

Connections uses a reserved administrative connection, so the inspection path still works when regular application connections are exhausted.

Managed databases should remove the need to SSH into a box, not remove your ability to debug an incident.

You can still get in, see what is running, and act from there.

For Postgres and Vitess

The PlanetScale CLI's new Connections feature also works with Vitess databases (MySQL). In this case, the live view is the PlanetScale version of watching SHOW FULL PROCESSLIST, with the ability to cancel the current query or terminate the connection from this unified interface.

The main difference is scope. Vitess connections are shown for one keyspace (and one shard) at a time. If a branch has multiple keyspaces, or a sharded keyspace, pass --keyspace and --shard to choose the tablet:

pscale branch connections top <database> <branch> --keyspace <keyspace> --shard <shard>

The same live monitoring, pause, history, capture, and replay workflow applies. The actions are MySQL-specific: canceling a query runs KILL QUERY, and terminating a connection runs KILL. See the Inspect live Vitess connections guide for the full command behavior.

Try it today

Connections is available for PlanetScale Postgres and Vitess. Update to the latest version of pscale and run:

pscale branch connections top <database> <branch>

See the CLI reference, the Inspect live Postgres connections guide, and the Inspect live Vitess connections guide for more details.

Try it next time you need to troubleshoot active database connections.