惯性聚合 高效追踪和阅读你感兴趣的博客、新闻、科技资讯
阅读原文 在惯性聚合中打开

推荐订阅源

H
Heimdal Security Blog
小众软件
小众软件
钛媒体:引领未来商业与生活新知
钛媒体:引领未来商业与生活新知
罗磊的独立博客
Google DeepMind News
大猫的无限游戏
大猫的无限游戏
奇客Solidot–传递最新科技情报
奇客Solidot–传递最新科技情报
Hugging Face - Blog
Hugging Face - Blog
阮一峰的网络日志
阮一峰的网络日志
A
About on SuperTechFans
宝玉的分享
宝玉的分享
博客园 - 聂微东
月光博客
月光博客
Cyberwarzone
Cyberwarzone
Microsoft Security Blog
V
Visual Studio Blog
Project Zero
Project Zero
T
Tor Project blog
freeCodeCamp Programming Tutorials: Python, JavaScript, Git & More
L
LINUX DO - 最新话题
博客园 - 叶小钗
Recent Commits to openclaw:main
Attack and Defense Labs
Spread Privacy
Spread Privacy
Forbes - Security
Forbes - Security
Simon Willison's Weblog
N
Netflix TechBlog - Medium
P
Proofpoint News Feed
Engineering at Meta
Engineering at Meta
Hacker News: Ask HN
Hacker News: Ask HN
I
InfoQ
M
MIT News - Artificial intelligence
AI
AI
博客园 - 三生石上(FineUI控件)
W
WeLiveSecurity
C
Check Point Blog
The Hacker News
The Hacker News
C
Cyber Attacks, Cyber Crime and Cyber Security
Application and Cybersecurity Blog
T
Tenable Blog
让小产品的独立变现更简单 - ezindie.com
Threat Intelligence Blog | Flashpoint
The Cloudflare Blog
Blog — PlanetScale
Blog — PlanetScale
美团技术团队
D
Darknet – Hacking Tools, Hacker News & Cyber Security
GbyAI
GbyAI
Hacker News - Newest:
Hacker News - Newest: "LLM"
腾讯CDC
K
Kaspersky official blog

Blog — PlanetScale

Keeping a Postgres queue healthy — PlanetScale Patterns for Postgres Traffic Control — PlanetScale Graceful degradation in Postgres — PlanetScale High memory usage in Postgres is good, actually — PlanetScale Stripe Projects partnership: Provision PlanetScale Postgres and MySQL databases from the Stripe CLI — PlanetScale Enhanced tagging in Postgres Query Insights — PlanetScale Behind the scenes: How Database Traffic Control works — PlanetScale Introducing Database Traffic Control — PlanetScale Scaling Postgres connections with PgBouncer — PlanetScale Drizzle joins PlanetScale — PlanetScale Video Conferencing with Postgres — PlanetScale Faster PlanetScale Postgres connections with Cloudflare Hyperdrive — PlanetScale Introducing the PlanetScale MCP server — PlanetScale Database Transactions — PlanetScale Automating our changelog with Cursor commands — PlanetScale Postgres 18 is now available — PlanetScale Using MotherDuck with PlanetScale — PlanetScale $50 PlanetScale Metal is GA for Postgres — PlanetScale AI-Powered Postgres index suggestions — PlanetScale $5 PlanetScale is live — PlanetScale Announcing Vitess 23 — PlanetScale $50 PlanetScale Metal — PlanetScale Report on our investigation of the 2025-10-20 incident in AWS us-east-1 — PlanetScale $5 PlanetScale — PlanetScale Benchmarking Postgres 17 vs 18 — PlanetScale Larger than RAM Vector Indexes for Relational Databases — PlanetScale Partnering with Cloudflare to bring you the fastest globally distributed applications — PlanetScale Processes and Threads — PlanetScale PlanetScale for Postgres is now GA — PlanetScale Postgres High Availability with CDC — PlanetScale Announcing Neki — PlanetScale Caching — PlanetScale The principles of extreme fault tolerance — PlanetScale Announcing PlanetScale for Postgres — PlanetScale Benchmarking Postgres — PlanetScale Announcing Vitess 22 — PlanetScale The Real Failure Rate of EBS — PlanetScale IO devices and latency — PlanetScale Announcing PlanetScale Metal — PlanetScale PlanetScale Metal: There’s no replacement for displacement — PlanetScale Upgrading Query Insights to Metal — PlanetScale Automating cherry-picks between OSS and private forks — PlanetScale Database Sharding — PlanetScale Anatomy of a Throttler, part 3 — PlanetScale Introducing sharding on PlanetScale with workflows — PlanetScale Announcing Vitess 21 — PlanetScale Announcing the PlanetScale vectors public beta — PlanetScale Anatomy of a Throttler, part 2 — PlanetScale Instant deploy requests — PlanetScale Anatomy of a Throttler, part 1 — PlanetScale Increase IOPS and throughput with sharding — PlanetScale Tracking index usage with Insights — PlanetScale Faster backups with sharding — PlanetScale Building data pipelines with Vitess — PlanetScale The State of Online Schema Migrations in MySQL — PlanetScale Optimizing aggregation in the Vitess query planner — PlanetScale Dealing with large tables — PlanetScale Announcing Vitess 20 — PlanetScale Self-managed Vitess vs Managed Vitess with PlanetScale — PlanetScale Achieving data consistency with the consistent lookup Vindex — PlanetScale The MySQL adaptive hash index — PlanetScale Introducing global replica credentials — PlanetScale Profiling memory usage in MySQL — PlanetScale Summer 2023: Fuzzing Vitess at PlanetScale — PlanetScale How PlanetScale makes schema changes — PlanetScale Identifying and profiling problematic MySQL queries — PlanetScale The Problem with Using a UUID Primary Key in MySQL — PlanetScale Announcing Vitess 19 — PlanetScale PlanetScale forever — PlanetScale Introducing schema recommendations — PlanetScale Amazon Aurora Pricing: The many surprising costs of running an Aurora database — PlanetScale Three common MySQL database design mistakes — PlanetScale OAuth applications are now available to everyone — PlanetScale Deprecating the Scaler plan — PlanetScale PlanetScale branching vs. Amazon Aurora blue/green deployments — PlanetScale Databases at scale — PlanetScale Considerations for building a database disaster recovery plan — PlanetScale Working with Geospatial Features in MySQL — PlanetScale PlanetScale vs Amazon Aurora replication — PlanetScale Introducing the Vantage and PlanetScale integration — PlanetScale MySQL isolation levels and how they work — PlanetScale Introducing the schemadiff command line tool — PlanetScale $ pscale ping — PlanetScale Announcing foreign key constraints support — PlanetScale The challenges of supporting foreign key constraints — PlanetScale What is HTAP? — PlanetScale Webhook security: a hands-on guide — PlanetScale MySQL replication: Best practices and considerations — PlanetScale A guide to HTML email with Ruby on Rails and Tailwind CSS — PlanetScale Sharding for cost-effective database management — PlanetScale PlanetScale ranks 188th in Deloitte’s top 500 fastest-growing companies — PlanetScale Announcing the Fivetran integration — PlanetScale Introducing webhooks — PlanetScale What is MySQL replication and when should you use it? — PlanetScale Sync user data between Clerk and a PlanetScale MySQL database — PlanetScale Introducing database reports — PlanetScale Distributed caching systems and MySQL — PlanetScale What is MySQL partitioning? — PlanetScale MySQL High Availability: Connection handling and concurrency — PlanetScale Personalizing your onboarding with Markdoc — PlanetScale
Introducing Insights Anomalies — PlanetScale
Rafer Hazen · 2023-11-28 · via Blog — PlanetScale

Rafer Hazen |

Anyone responsible for a large production database can tell you that ensuring your database is healthy and performing optimally can be difficult and time-consuming. Even with battle-tested dashboards, the latest monitoring tools, and a deep understanding of your application, the phrase “Hey, is something up with the database?” strikes fear into the hearts of even the most experienced operators.

Today, we are launching a powerful new set of capabilities in PlanetScale called Insights Anomalies, designed to simplify answering this question. The goal is to provide a crystal clear overview of your database’s health and make it easy to troubleshoot when something goes wrong. This post will explore Insights Anomalies and show how we implemented it.

Insights Anomalies

If you head to the “Insights” tab in your PlanetScale database, you’ll see a new “Anomalies” section. There, you’ll find a graph representing your database’s health over time, as measured by the number of queries that took longer than expected.

Database health graph showing two anomalies

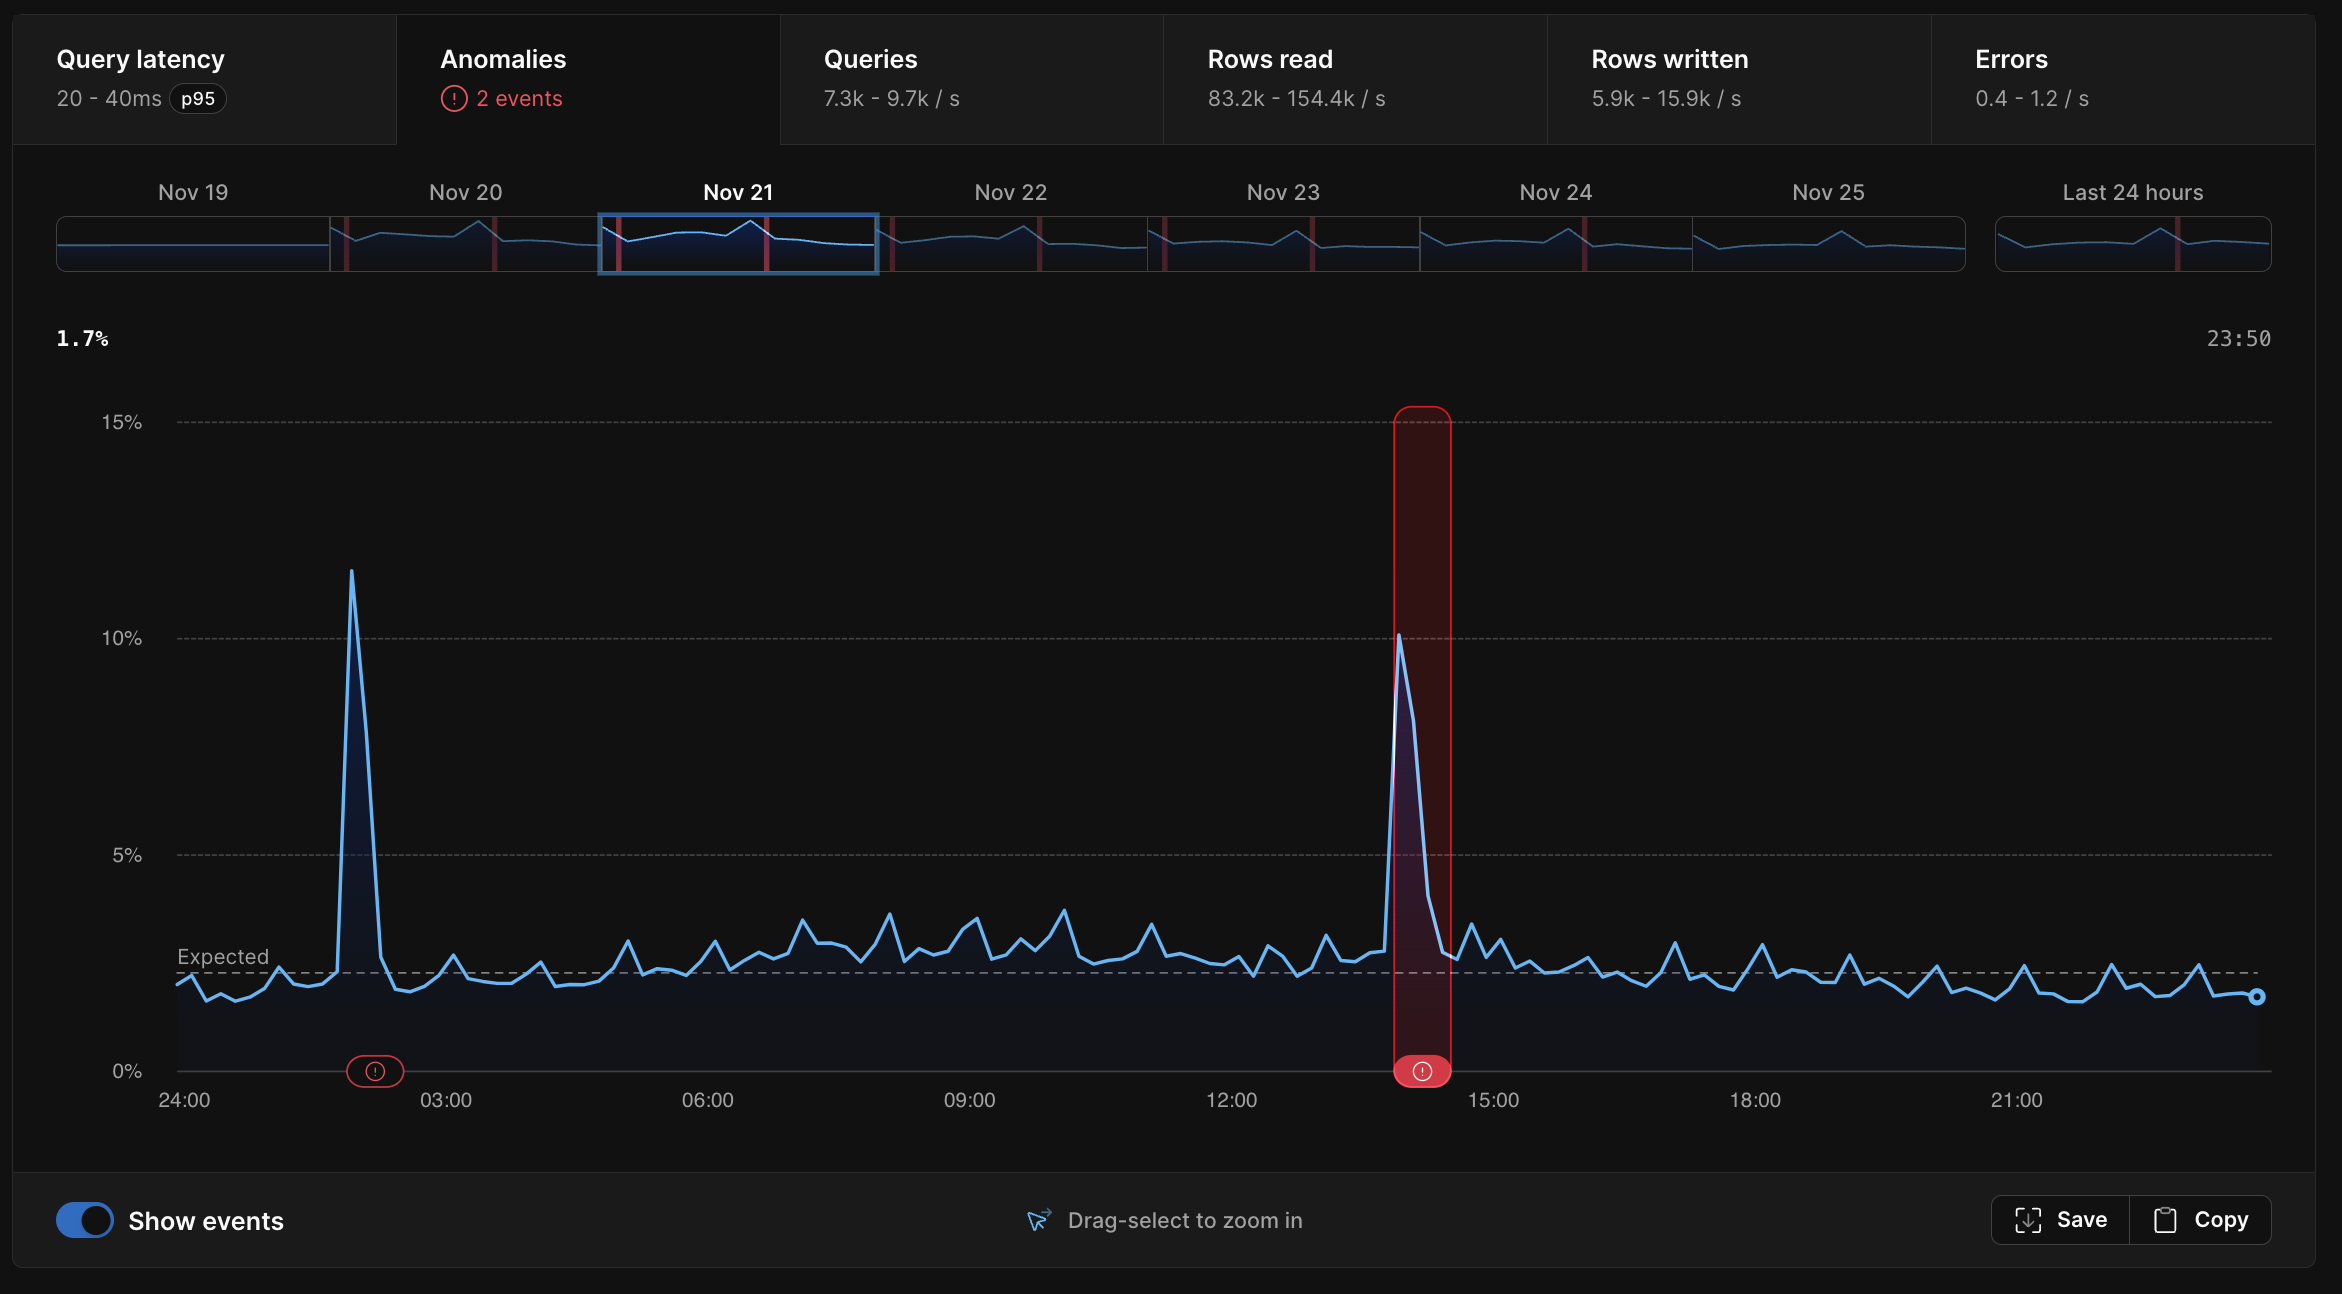
Any periods where your database was unhealthy (represented by large values in the graph) will be highlighted with a red icon representing a performance anomaly. Clicking on an anomaly will bring up a detailed view with pertinent information to help understand the causes of an anomaly.

Anomaly details page with anomaly metrics

Database health

You may wonder what “unhealthy” means in this context, and what quantity the database health graph represents. The anomaly graph shows the percentage of queries that were unusually slow. An “unusually slow” query is defined as having an execution time exceeding two standard deviations above the mean (also known as 2σ1 or the 97.7th percentile), for queries with the same pattern over the last week. To determine this threshold we perform the following steps:

  • Aggregate query response time distribution by SQL fingerprint, and store a probabilistic sketch of that distribution in MySQL.
  • Use the stored sketches to determine the 2σ threshold for each incoming query’s fingerprint over the last week.
  • Count the number of incoming queries in each pattern that exceeded the threshold.

It’s worth examining why it’s necessary to go to the trouble of calculating the threshold on a per-query pattern basis, instead of using a more straightforward metric like a global latency percentile, as a proxy for database health2. By comparing each incoming query to the response time baseline for its specific query pattern, we can make an apples-to-apples comparison for each query pattern. Queries that have always been slow will only be considered in the anomaly calculation if they are substantially slower then they have been in the past. If the outlier percentage is elevated, we know that the same query patterns are now taking longer than they did over the last week. This provides a strong signal that the database is encountering a resource bottleneck, and does not result in false positives due to shifting database workloads.

In our experience observing this metric on internal PlanetScale databases, we’ve found it to be a reliable indicator of when we’re pushing a database beyond its limits.

Troubleshooting Anomalies

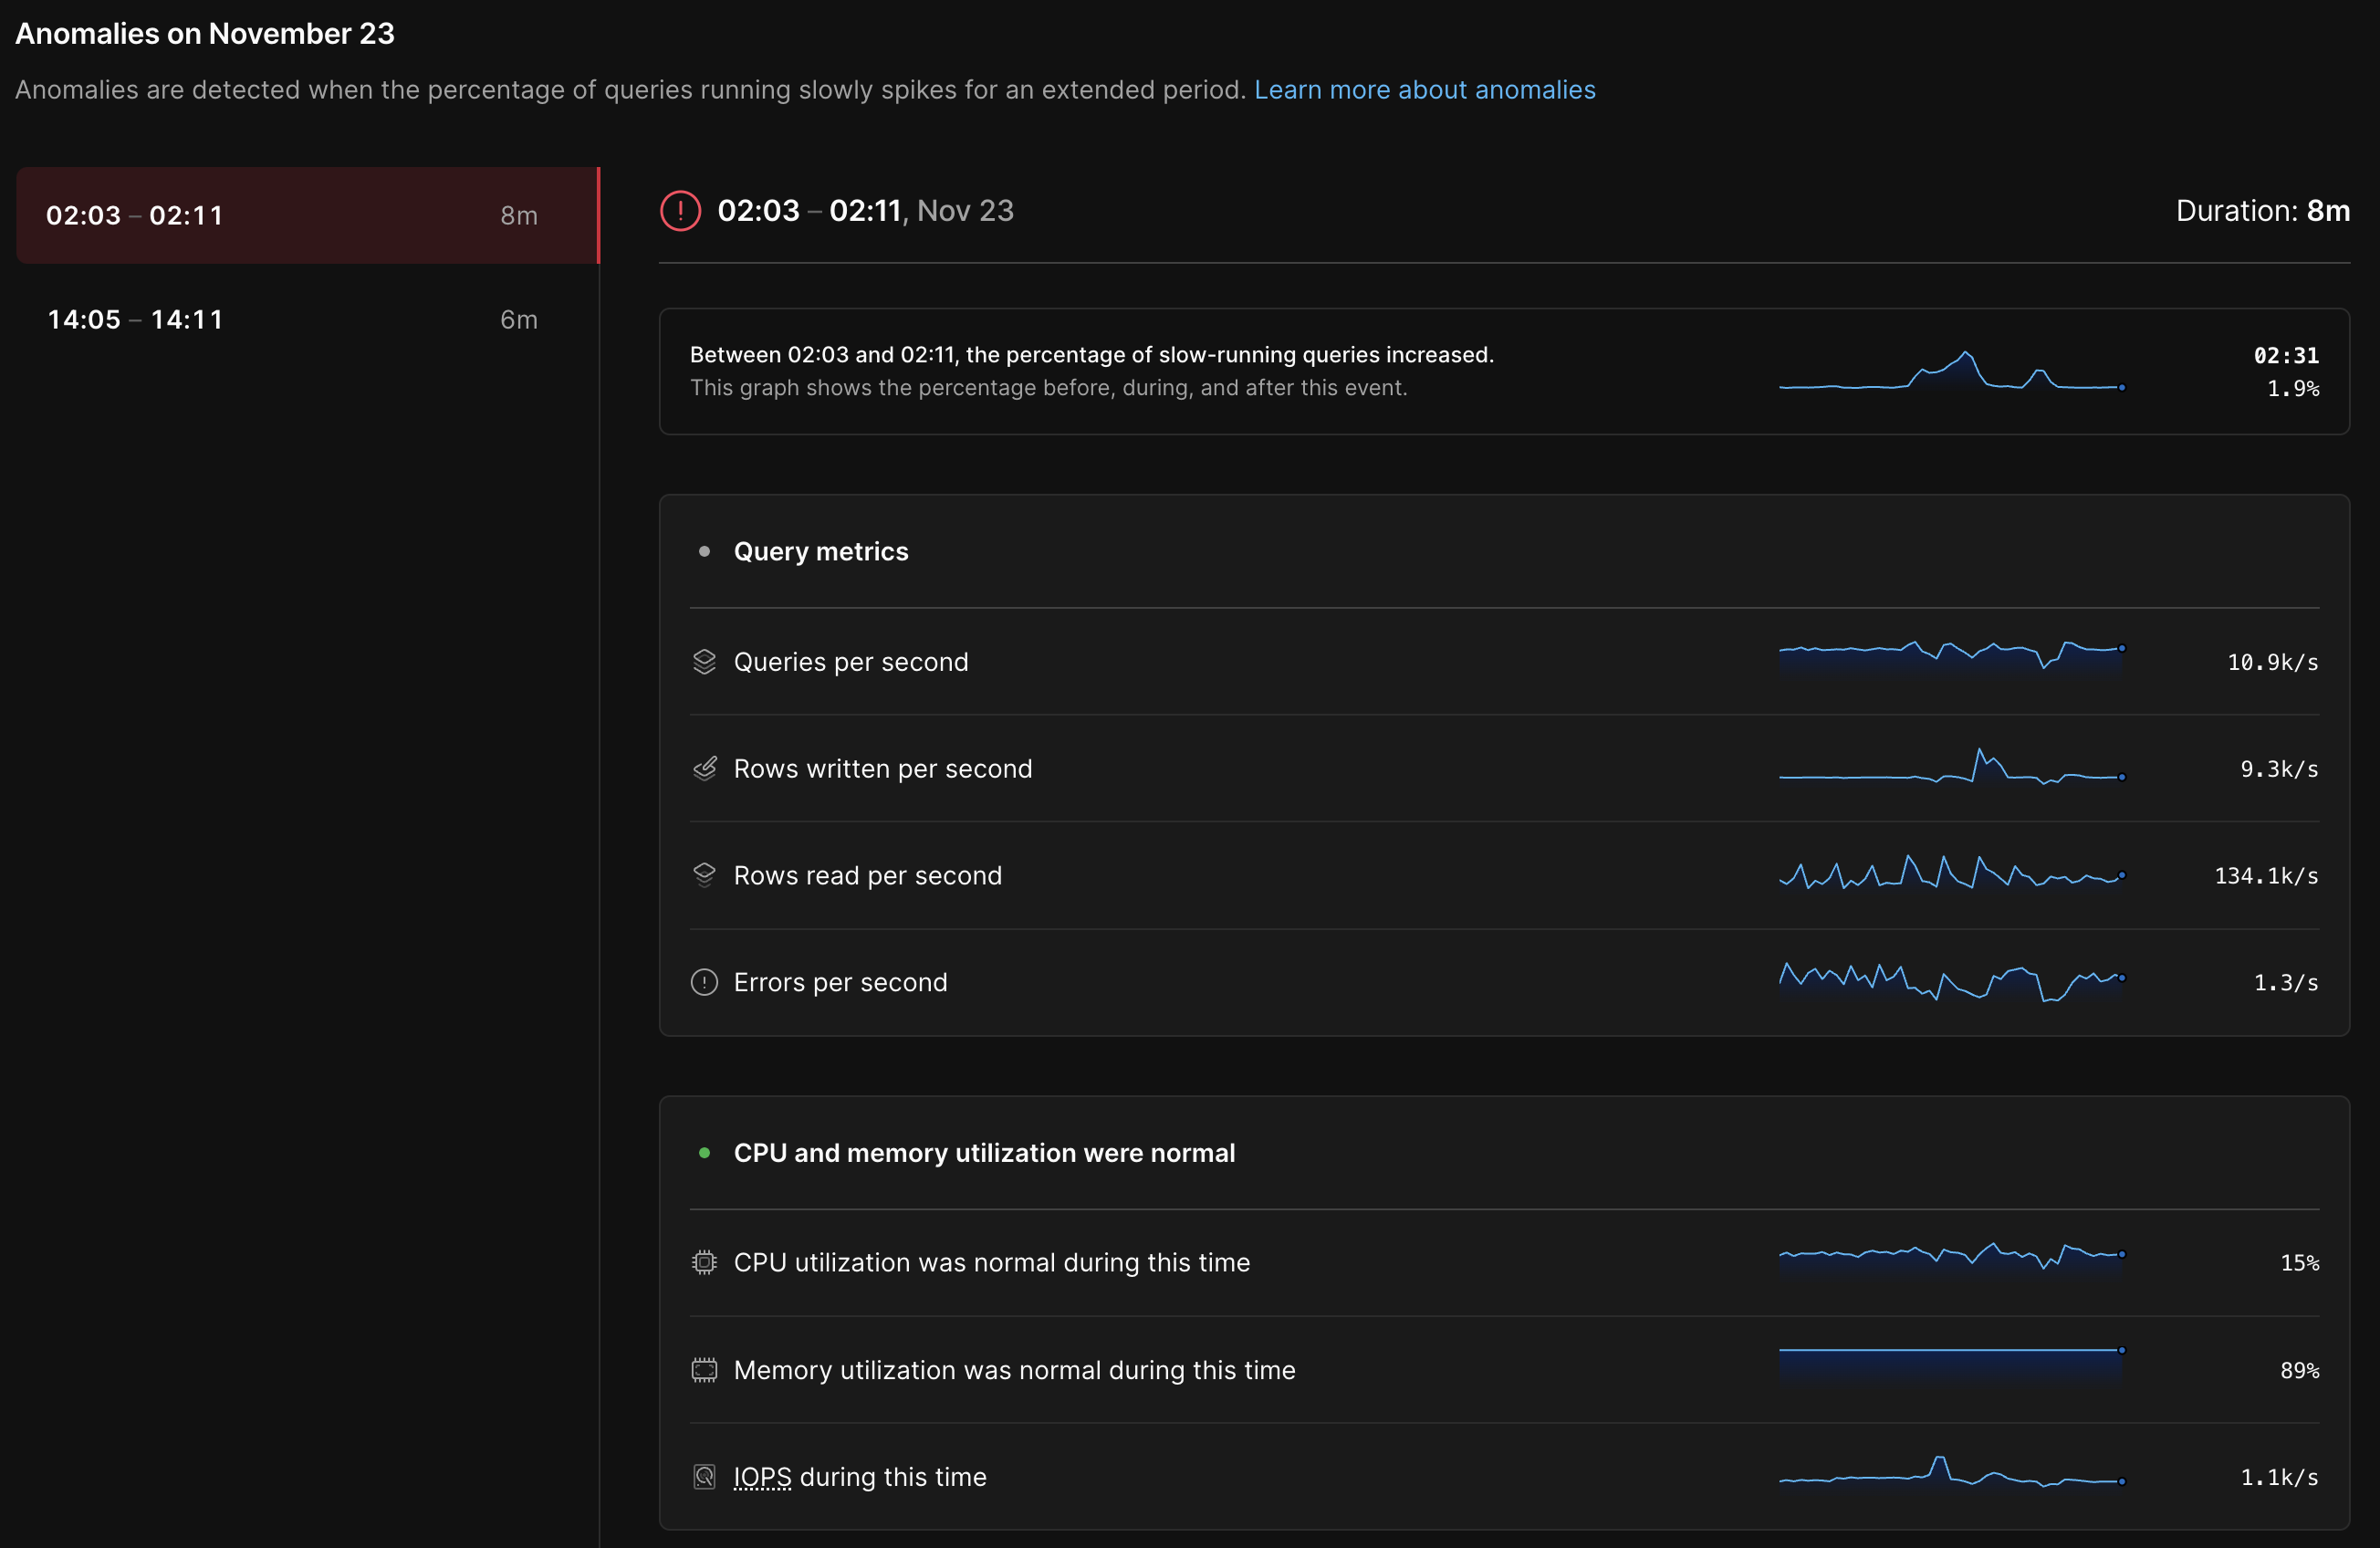
Determining when an anomaly is occurring (or not occurring) is a valuable capability in its own right. Still, it’s equally important to uncover the root causes. To make this easier, Insights lists relevant metrics for each anomaly. In particular, we show:

  • High-level query metrics, such as the number of rows read and written per second
  • Utilization metrics for the underlying database resources, such as CPU and disk usage (IOPS)
  • A list of backups and deploy requests running when the anomaly occurred since these operations have the potential to consume shared resources

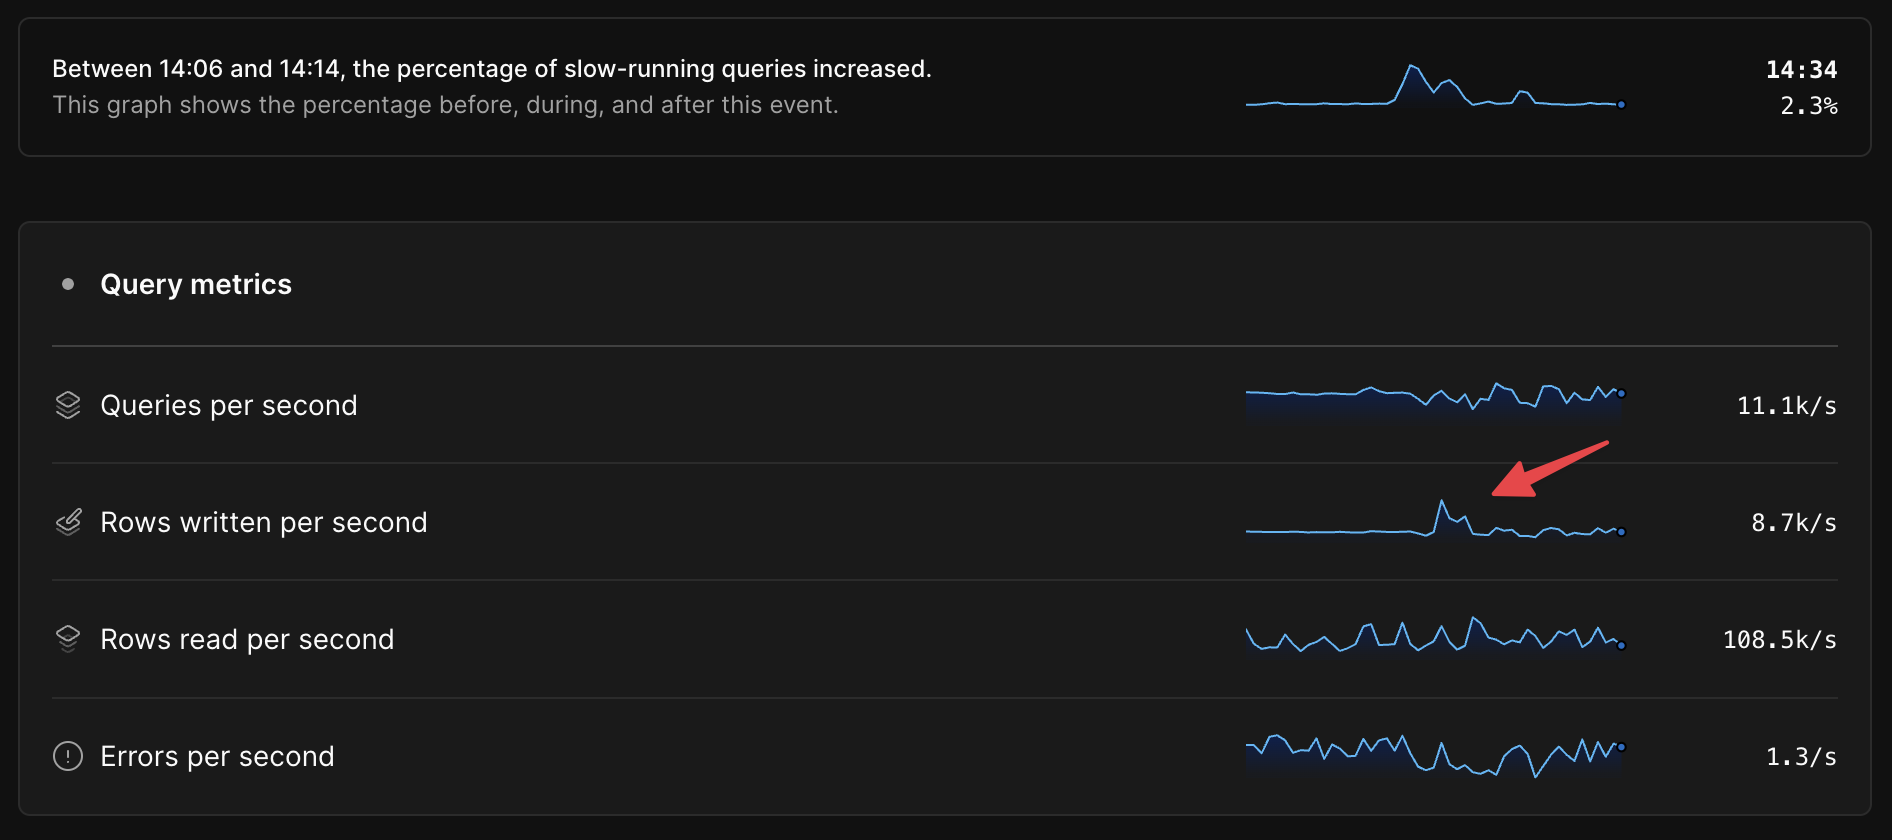
Seeing time series metrics side-by-side with overall database health before, during, and after the anomalous period often makes it very clear where the bottleneck is, as in this example, where there is an approximately 300% increase in rows written per second during the anomaly.

Query level anomaly metrics showing an elevated writes per second graph

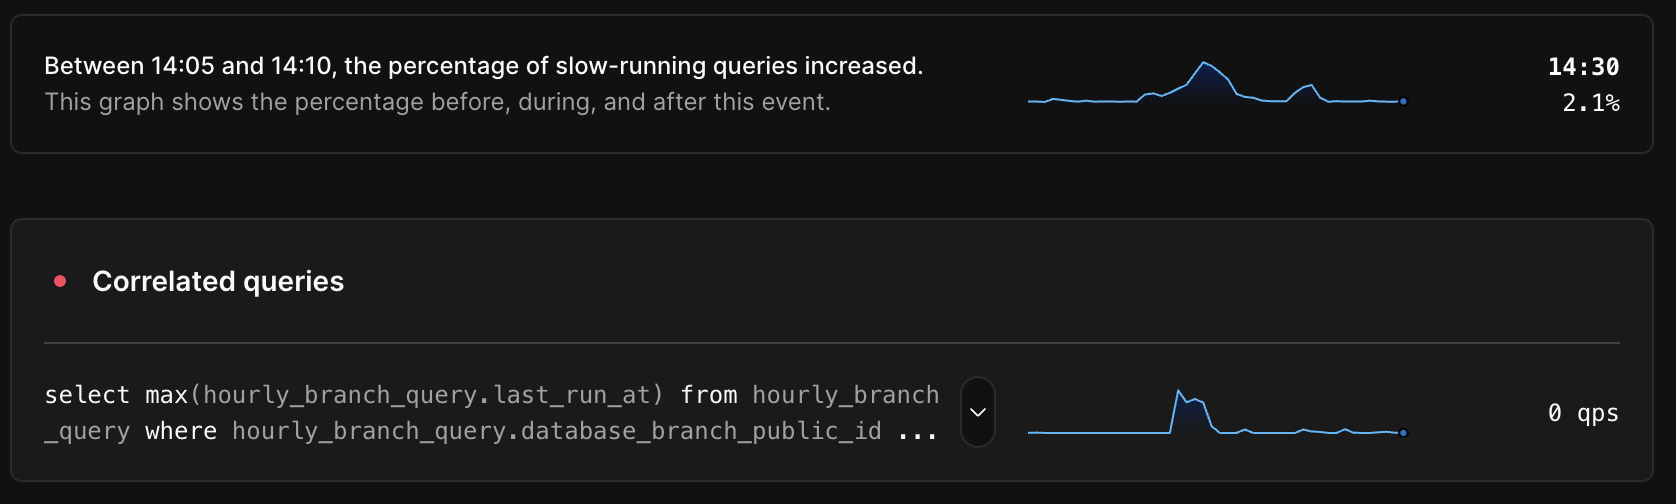
In some cases, we can go deeper than high-level aggregate metrics like reads/writes per second and tell you which specific query patterns are most likely to be at the root of an anomaly.

Because Insights records and stores exact query counts for 100% of your database’s query patterns, we can compare the execution rate of every query pattern with the overall database health metrics and identify highly correlated queries. In the example below we see an obvious correlation between the overall database health metric and the execution rate of an expensive query run intermittently by a background job.

Correlated queries for an anomaly

To find the correlated queries shown in an anomaly, we calculate the Pearson correlation coefficient between the execution rate for each query pattern and the overall database health metric during the anomaly plus a fixed window before and after. We then return the queries with the highest correlation coefficient. Not all anomalies have correlated queries, for example, those caused by running a backup on an under-provisioned database cluster, so we exclude results with a correlation coefficient below a certain threshold. When correlated queries are present, it can shave hours off the time it takes to find the root cause.

Try it today

All PlanetScale databases have access to the Anomalies tab in Insights today. You can read more in the PlanetScale Insights Anomalies documentation. User feedback helps us tune the system to improve accuracy, so please let us know about your experience, positive or not, by sharing on Twitter or contacting us.

  1. There’s nothing magical about 2σ or the 97.7th percentile. This value is used because it’s a fairly common choice for defining a statistical outlier.
  2. For a deeper dive on the motivations behind using 2σ outliers to gauge system health, check out this excellent talk from two Google engineers at SREcon22