


惯性聚合 高效追踪和阅读你感兴趣的博客、新闻、科技资讯
阅读原文 在惯性聚合中打开

推荐订阅源

Recent Commits to openclaw:main
SecWiki News
SecWiki News
Webroot Blog
Webroot Blog
Application and Cybersecurity Blog
cs.CV updates on arXiv.org
N
News and Events Feed by Topic
Recent Announcements
Help Net Security
Help Net Security
Jina AI
Jina AI
O
OpenAI News
雷峰网
雷峰网
Exploit-DB.com RSS Feed
博客园 - 三生石上(FineUI控件)
W
WeLiveSecurity
Schneier on Security
T
Threat Research - Cisco Blogs
IT之家
IT之家
K
KPMG report finds enterprise disconnect between AI and its ROI | CIO
Vercel News
Vercel News
N
News and Events Feed by Topic
T
The Exploit Database - CXSecurity.com
爱范儿
爱范儿
Recorded Future
Recorded Future
Google Online Security Blog
TaoSecurity Blog
TaoSecurity Blog
美团技术团队
Engineering at Meta
Engineering at Meta
Security Latest
Security Latest
V
V2EX
T
Tailwind CSS Blog
P
Privacy & Cybersecurity Law Blog
让小产品的独立变现更简单 - ezindie.com
S
Schneier on Security
B
Blog
www.infosecurity-magazine.com
博客园 - 【当耐特】
PCI Perspectives
PCI Perspectives
GbyAI
GbyAI
I
Intezer
Spread Privacy
Spread Privacy
Security Archives - TechRepublic
Cloudbric
Cloudbric
V
Visual Studio Blog
MongoDB | Blog
MongoDB | Blog
Forbes - Security
Forbes - Security
The Last Watchdog
The Last Watchdog
aimingoo的专栏
aimingoo的专栏
C
CERT Recently Published Vulnerability Notes
A
About on SuperTechFans
罗磊的独立博客

Blog — PlanetScale

Keeping a Postgres queue healthy — PlanetScale Patterns for Postgres Traffic Control — PlanetScale Graceful degradation in Postgres — PlanetScale High memory usage in Postgres is good, actually — PlanetScale Stripe Projects partnership: Provision PlanetScale Postgres and MySQL databases from the Stripe CLI — PlanetScale Enhanced tagging in Postgres Query Insights — PlanetScale Behind the scenes: How Database Traffic Control works — PlanetScale Introducing Database Traffic Control — PlanetScale Scaling Postgres connections with PgBouncer — PlanetScale Drizzle joins PlanetScale — PlanetScale Video Conferencing with Postgres — PlanetScale Faster PlanetScale Postgres connections with Cloudflare Hyperdrive — PlanetScale Introducing the PlanetScale MCP server — PlanetScale Database Transactions — PlanetScale Automating our changelog with Cursor commands — PlanetScale Postgres 18 is now available — PlanetScale Using MotherDuck with PlanetScale — PlanetScale $50 PlanetScale Metal is GA for Postgres — PlanetScale AI-Powered Postgres index suggestions — PlanetScale $5 PlanetScale is live — PlanetScale Announcing Vitess 23 — PlanetScale $50 PlanetScale Metal — PlanetScale Report on our investigation of the 2025-10-20 incident in AWS us-east-1 — PlanetScale $5 PlanetScale — PlanetScale Benchmarking Postgres 17 vs 18 — PlanetScale Larger than RAM Vector Indexes for Relational Databases — PlanetScale Partnering with Cloudflare to bring you the fastest globally distributed applications — PlanetScale Processes and Threads — PlanetScale PlanetScale for Postgres is now GA — PlanetScale Postgres High Availability with CDC — PlanetScale Announcing Neki — PlanetScale Caching — PlanetScale The principles of extreme fault tolerance — PlanetScale Announcing PlanetScale for Postgres — PlanetScale Benchmarking Postgres — PlanetScale Announcing Vitess 22 — PlanetScale The Real Failure Rate of EBS — PlanetScale IO devices and latency — PlanetScale Announcing PlanetScale Metal — PlanetScale PlanetScale Metal: There’s no replacement for displacement — PlanetScale Upgrading Query Insights to Metal — PlanetScale Automating cherry-picks between OSS and private forks — PlanetScale Database Sharding — PlanetScale Anatomy of a Throttler, part 3 — PlanetScale Introducing sharding on PlanetScale with workflows — PlanetScale Announcing Vitess 21 — PlanetScale Announcing the PlanetScale vectors public beta — PlanetScale Anatomy of a Throttler, part 2 — PlanetScale Instant deploy requests — PlanetScale Anatomy of a Throttler, part 1 — PlanetScale Increase IOPS and throughput with sharding — PlanetScale Faster backups with sharding — PlanetScale Building data pipelines with Vitess — PlanetScale The State of Online Schema Migrations in MySQL — PlanetScale Optimizing aggregation in the Vitess query planner — PlanetScale Dealing with large tables — PlanetScale Announcing Vitess 20 — PlanetScale Self-managed Vitess vs Managed Vitess with PlanetScale — PlanetScale Achieving data consistency with the consistent lookup Vindex — PlanetScale The MySQL adaptive hash index — PlanetScale Introducing global replica credentials — PlanetScale Profiling memory usage in MySQL — PlanetScale Summer 2023: Fuzzing Vitess at PlanetScale — PlanetScale How PlanetScale makes schema changes — PlanetScale Identifying and profiling problematic MySQL queries — PlanetScale The Problem with Using a UUID Primary Key in MySQL — PlanetScale Announcing Vitess 19 — PlanetScale PlanetScale forever — PlanetScale Introducing schema recommendations — PlanetScale Amazon Aurora Pricing: The many surprising costs of running an Aurora database — PlanetScale Three common MySQL database design mistakes — PlanetScale OAuth applications are now available to everyone — PlanetScale Deprecating the Scaler plan — PlanetScale PlanetScale branching vs. Amazon Aurora blue/green deployments — PlanetScale Databases at scale — PlanetScale Considerations for building a database disaster recovery plan — PlanetScale Working with Geospatial Features in MySQL — PlanetScale PlanetScale vs Amazon Aurora replication — PlanetScale Introducing the Vantage and PlanetScale integration — PlanetScale MySQL isolation levels and how they work — PlanetScale Introducing the schemadiff command line tool — PlanetScale $ pscale ping — PlanetScale Announcing foreign key constraints support — PlanetScale The challenges of supporting foreign key constraints — PlanetScale What is HTAP? — PlanetScale Introducing Insights Anomalies — PlanetScale Webhook security: a hands-on guide — PlanetScale Announcing the Fivetran integration — PlanetScale Introducing webhooks — PlanetScale What is MySQL replication and when should you use it? — PlanetScale Sync user data between Clerk and a PlanetScale MySQL database — PlanetScale Introducing database reports — PlanetScale Distributed caching systems and MySQL — PlanetScale What is MySQL partitioning? — PlanetScale MySQL High Availability: Connection handling and concurrency — PlanetScale Personalizing your onboarding with Markdoc — PlanetScale PlanetScale vs. Amazon Aurora — PlanetScale PlanetScale vs. Amazon RDS — PlanetScale PlanetScale is bringing vector search and storage to MySQL — PlanetScale PlanetScale Managed is now PCI compliant — PlanetScale
Tracking index usage with Insights — PlanetScale
Rafer Hazen · 2024-08-14 · via Blog — PlanetScale

Rafer Hazen |

For relational databases, creating and maintaining the right indexes for your workload is critical to ensuring good performance. Unfortunately, creating good indexes isn’t a one-time activity performed only when adding new tables. Tables grow, schemas evolve, and, most importantly, the queries sent by your application change over time. To ensure your application’s queries are indexed correctly, it’s important to be able to observe which indexes are (or are not) actually being used.

To help with this, we’ve added a new capability to PlanetScale Insights: index usage tracking. With this feature, it’s easy to see which indexes your queries are using and how that usage is changing over time.

Let’s dive right in.

Feature walkthrough

To see the index usage graph for a query pattern, go to your insights dashboard, click on a SELECT query, then click on the new Indexes tab in the upper right hand corner. Here’s an example of what the index usage page looks like.
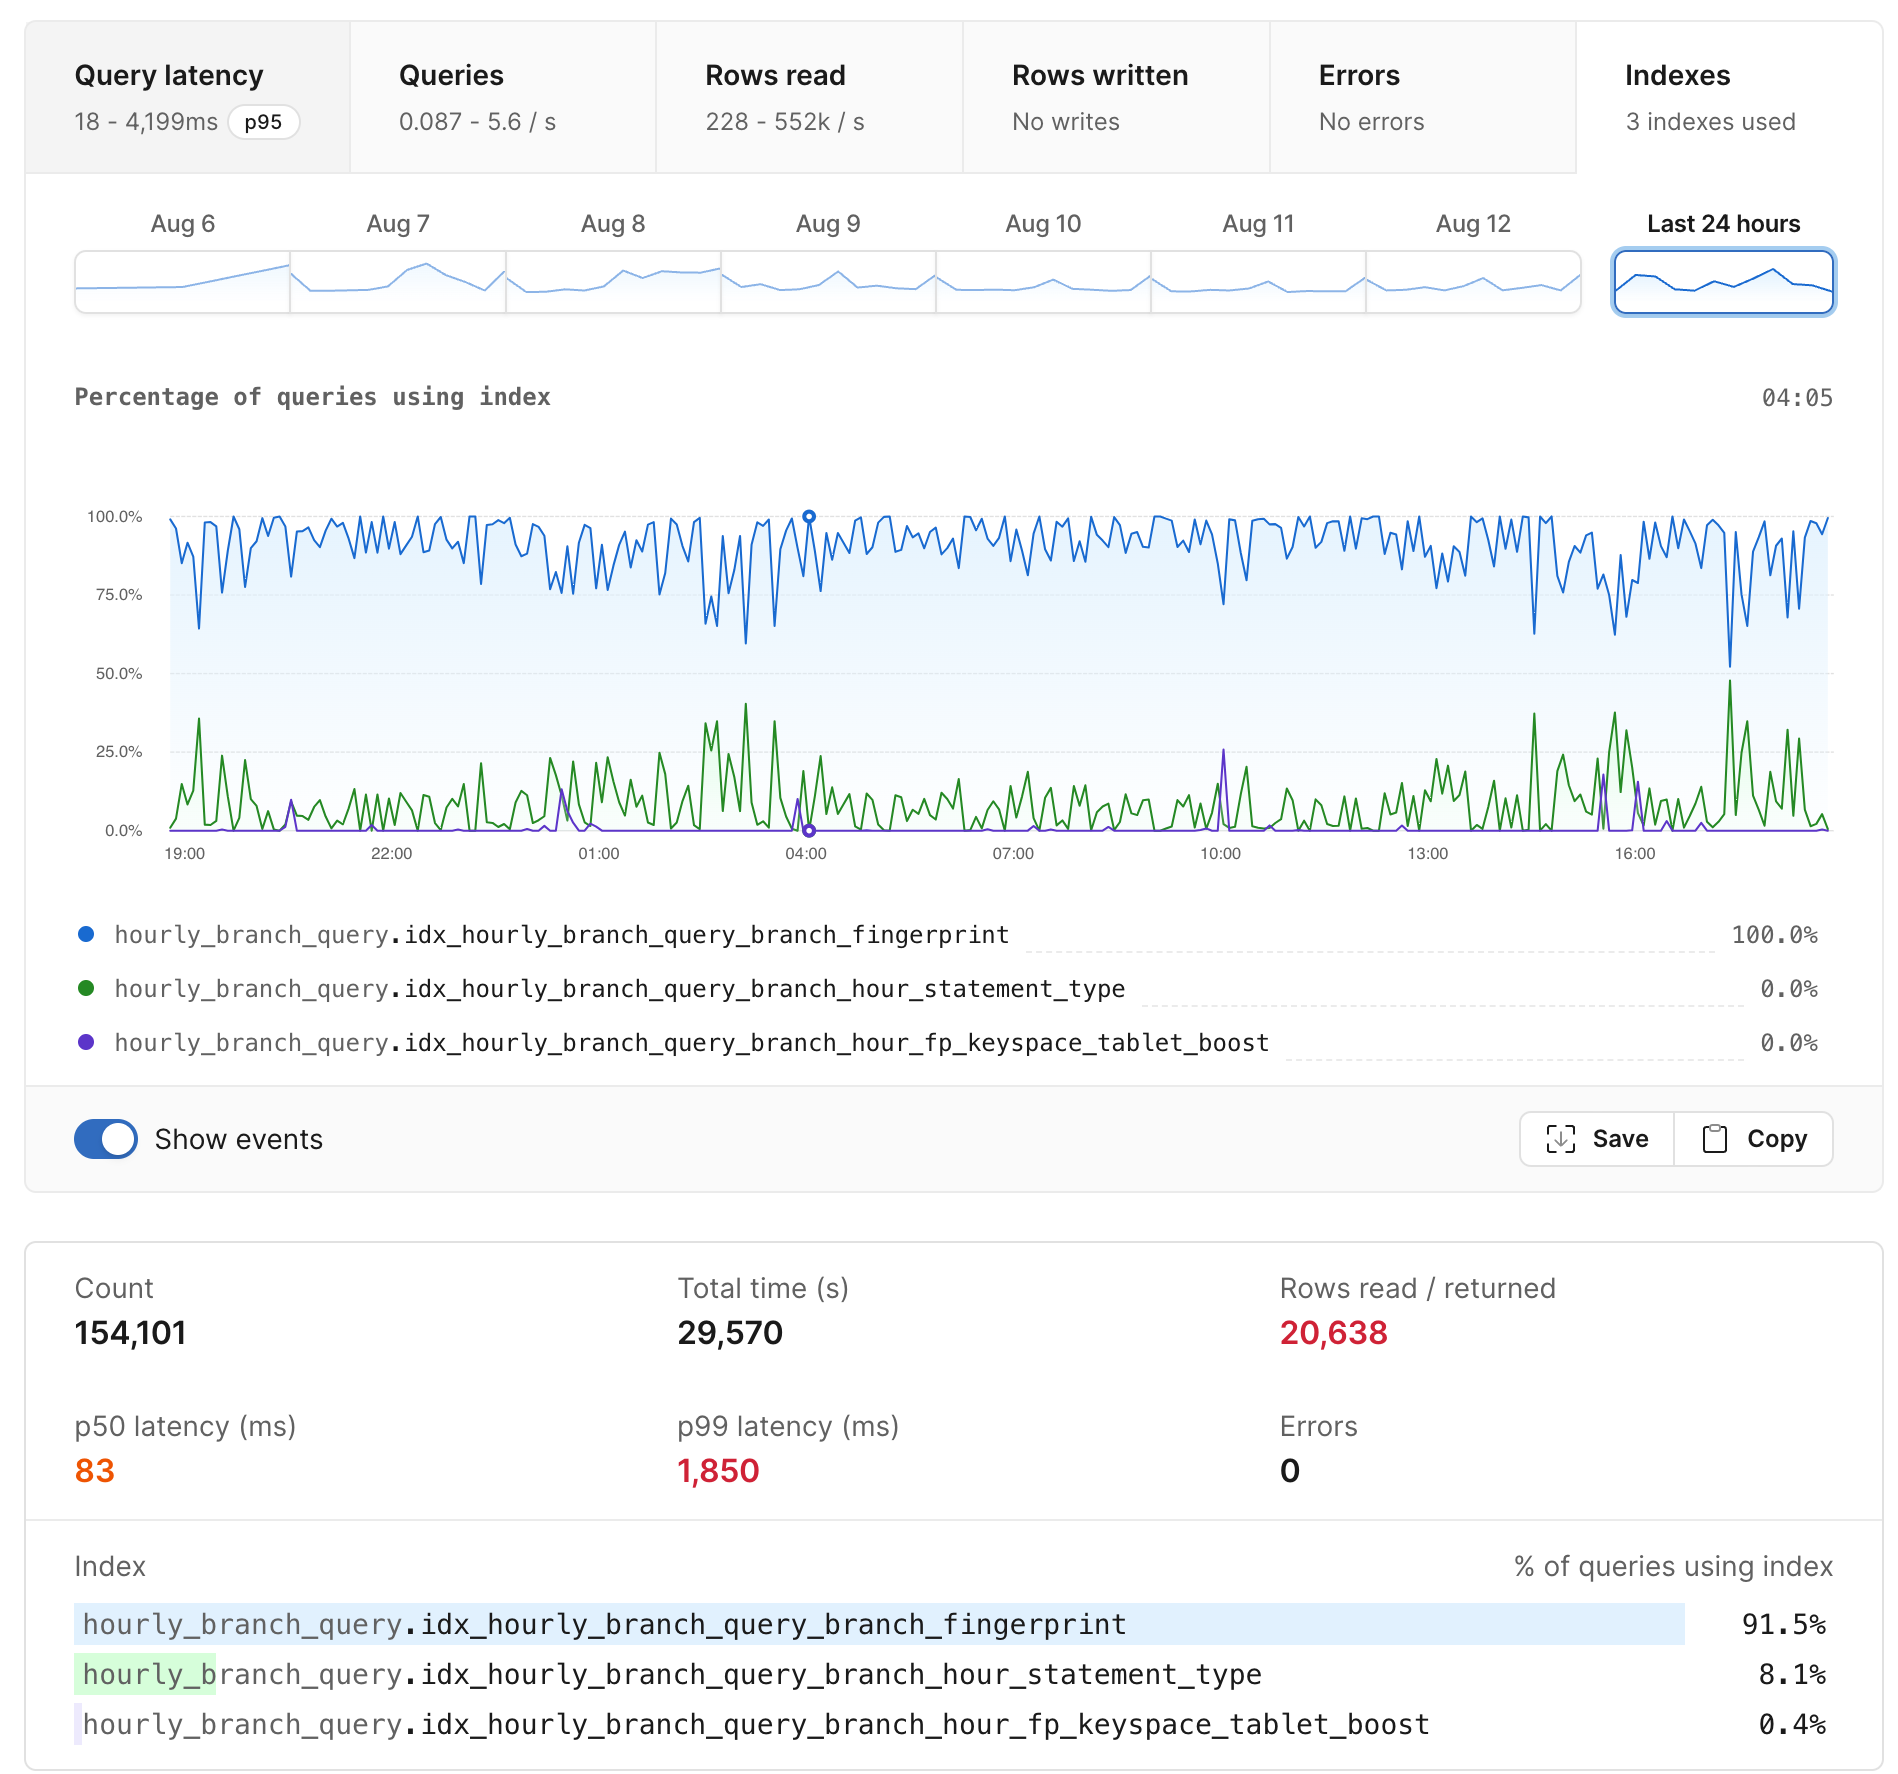
Query pattern index usage graph

The main graph shows a time series of the percentage of queries that use each index. The bar graph at the bottom shows cumulative usage over the entire time span. In the example above we see that MySQL is selecting from one of three indexes each time it executes the query pattern.

This view shows us which indexes a given query is using, but we can also ask the question in reverse: which queries are using a given index? To answer this, go to the main Insights page, and add index:$TABLE_NAME.$INDEX_NAME as a search term. For example:
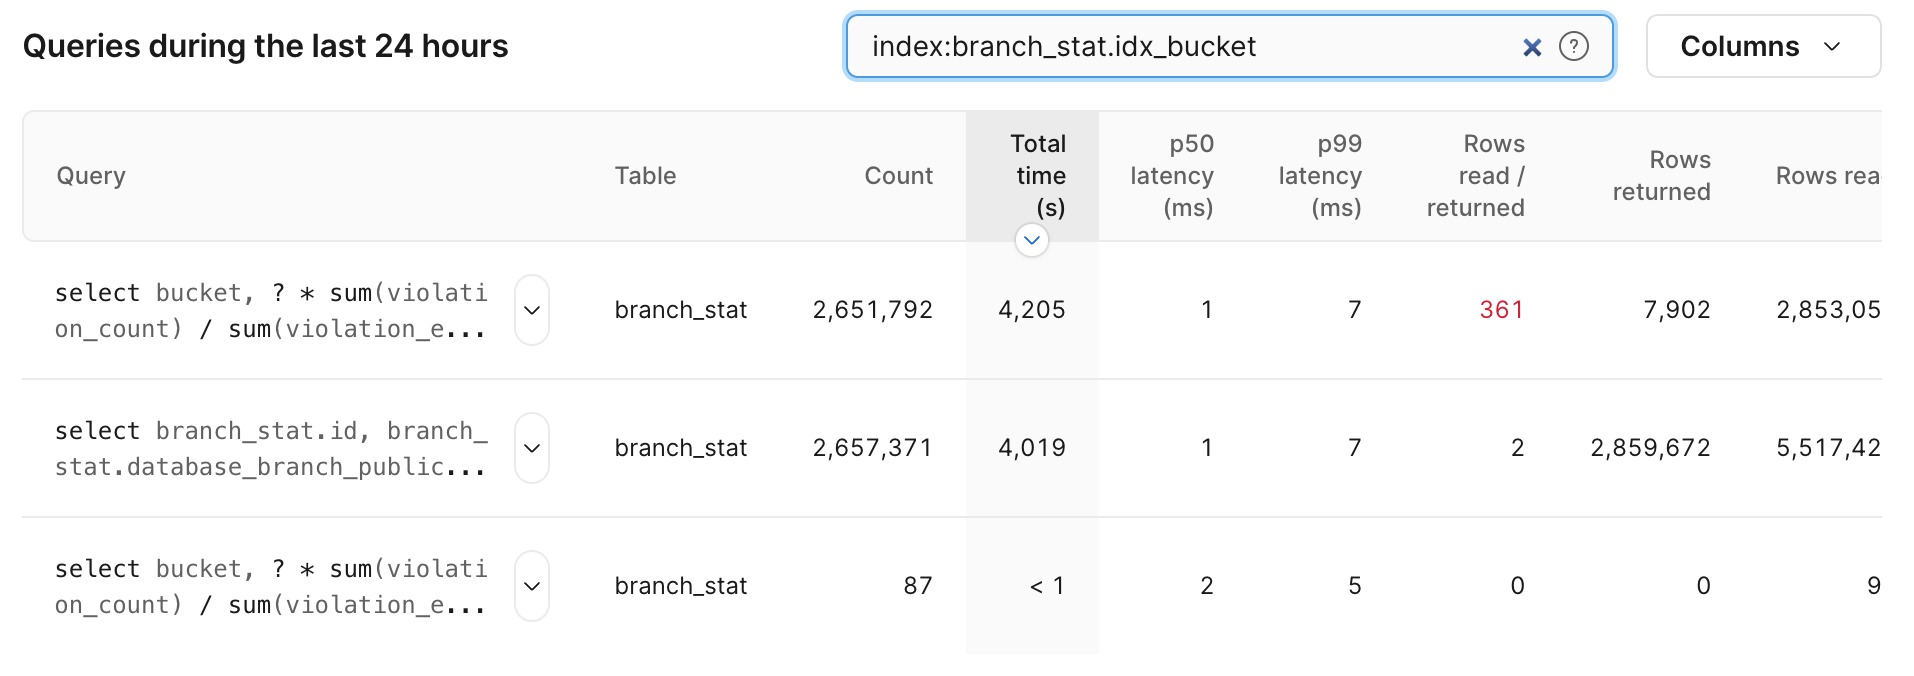
Search for queries by index

Note: index information is only reported for SELECT queries, so it’s important to independently verify that indexes aren’t being used in UPDATE or DELETE queries before removing an index.

We can also use insights to find a list of query patterns that use no indexes at all by entering indexed:false in the insights search box.

Search for unindexed queries

These index-related search terms can be combined with existing search terms. For example, to find a list of all unindexed queries that have been executed at least a thousand times in the last 24 hours and have a p50 response time over 250ms, you’d enter indexed:false query_count:>1000 p50:>250.

To learn more about how and why we implemented this feature, read on.

Before building a new system to monitor index usage, we evaluated the available tools for monitoring and understanding index usage. We’ll explore these tools first to motivate the decisions we made in designing Insights usage tracking.

The first tool most developers reach for when trying to understand index usage is explain, and for good reason. Explain is an incredibly powerful tool that exposes a wealth of information about how MySQL executes your query, including index usage. It’s great for troubleshooting a problematic query or testing out a new index. Unfortunately, explain can only provide information for queries you explicitly provide. It doesn’t record information for the actual queries processed by MySQL, so it can’t show how a query pattern is using indexes over time, across shards, or with the different query parameters from your production workload.

For aggregate index usage from your production environment, MySQL’s built in performance schema provides counters for how many times each index has been used in the table_io_waits_summary_by_index_usage table. This is a useful facility, but comes with a number of limitations that make it difficult to use in practice:

  • Stats are in the form of global counts for each MySQL server, and are reset when MySQL is restarted. This means you can’t see usage trends over time, and counts may be reset at any time.
  • Counters are only provided at the index level, so it’s not clear which query patterns are using which indexes.

To make it easy to understand index usage patterns, we wanted a system that:

  • Breaks down index usage information per query pattern.
  • Stores index usage as a timeseries, so it’s obvious when something has changed.
  • Provides cumulative data for all your queries, without sampling or extrapolating based on explain plans.

With these goals in mind, our first task was to extract query index usage information from MySQL. Since PlanetScale databases exclusively use the InnoDB storage engine, we were able to focus our efforts there. The InnoDB storage handler includes an index-initialization function that MySQL calls (once) prior to using an index in a query. By recording the index name passed to this function in a per query data structure, we’re able to find the set of all indexes used by each query. When the query is finished we return the list of used indexes in the final packet returned by MySQL to the client, and ultimately to VTGate, Vitess’s query proxying layer.

With the per-query index information in VTGate, we aggregate index usage information per query-pattern and send it into the Insights pipeline every 15 seconds. This approach allows us to aggregate the time series count of indexes used for 100% of queries with negligible overhead in MySQL.

Try it out now

Index usage information is available on all PlanetScale databases. We’ve found this feature useful in managing our own databases and we hope you do too.