惯性聚合 高效追踪和阅读你感兴趣的博客、新闻、科技资讯
阅读原文 在惯性聚合中打开

推荐订阅源

H
Heimdal Security Blog
小众软件
小众软件
钛媒体:引领未来商业与生活新知
钛媒体:引领未来商业与生活新知
罗磊的独立博客
Google DeepMind News
大猫的无限游戏
大猫的无限游戏
奇客Solidot–传递最新科技情报
奇客Solidot–传递最新科技情报
Hugging Face - Blog
Hugging Face - Blog
阮一峰的网络日志
阮一峰的网络日志
A
About on SuperTechFans
宝玉的分享
宝玉的分享
博客园 - 聂微东
月光博客
月光博客
Cyberwarzone
Cyberwarzone
Microsoft Security Blog
V
Visual Studio Blog
Project Zero
Project Zero
T
Tor Project blog
freeCodeCamp Programming Tutorials: Python, JavaScript, Git & More
L
LINUX DO - 最新话题
博客园 - 叶小钗
Recent Commits to openclaw:main
Attack and Defense Labs
Spread Privacy
Spread Privacy
Forbes - Security
Forbes - Security
Simon Willison's Weblog
N
Netflix TechBlog - Medium
P
Proofpoint News Feed
Engineering at Meta
Engineering at Meta
Hacker News: Ask HN
Hacker News: Ask HN
I
InfoQ
M
MIT News - Artificial intelligence
AI
AI
博客园 - 三生石上(FineUI控件)
W
WeLiveSecurity
C
Check Point Blog
The Hacker News
The Hacker News
C
Cyber Attacks, Cyber Crime and Cyber Security
Application and Cybersecurity Blog
T
Tenable Blog
让小产品的独立变现更简单 - ezindie.com
Threat Intelligence Blog | Flashpoint
The Cloudflare Blog
Blog — PlanetScale
Blog — PlanetScale
美团技术团队
D
Darknet – Hacking Tools, Hacker News & Cyber Security
GbyAI
GbyAI
Hacker News - Newest:
Hacker News - Newest: "LLM"
腾讯CDC
K
Kaspersky official blog

Blog — PlanetScale

Keeping a Postgres queue healthy — PlanetScale Patterns for Postgres Traffic Control — PlanetScale Graceful degradation in Postgres — PlanetScale High memory usage in Postgres is good, actually — PlanetScale Stripe Projects partnership: Provision PlanetScale Postgres and MySQL databases from the Stripe CLI — PlanetScale Enhanced tagging in Postgres Query Insights — PlanetScale Behind the scenes: How Database Traffic Control works — PlanetScale Introducing Database Traffic Control — PlanetScale Scaling Postgres connections with PgBouncer — PlanetScale Drizzle joins PlanetScale — PlanetScale Video Conferencing with Postgres — PlanetScale Faster PlanetScale Postgres connections with Cloudflare Hyperdrive — PlanetScale Introducing the PlanetScale MCP server — PlanetScale Database Transactions — PlanetScale Automating our changelog with Cursor commands — PlanetScale Postgres 18 is now available — PlanetScale Using MotherDuck with PlanetScale — PlanetScale $50 PlanetScale Metal is GA for Postgres — PlanetScale AI-Powered Postgres index suggestions — PlanetScale $5 PlanetScale is live — PlanetScale Announcing Vitess 23 — PlanetScale $50 PlanetScale Metal — PlanetScale Report on our investigation of the 2025-10-20 incident in AWS us-east-1 — PlanetScale $5 PlanetScale — PlanetScale Benchmarking Postgres 17 vs 18 — PlanetScale Larger than RAM Vector Indexes for Relational Databases — PlanetScale Partnering with Cloudflare to bring you the fastest globally distributed applications — PlanetScale Processes and Threads — PlanetScale PlanetScale for Postgres is now GA — PlanetScale Postgres High Availability with CDC — PlanetScale Announcing Neki — PlanetScale Caching — PlanetScale The principles of extreme fault tolerance — PlanetScale Announcing PlanetScale for Postgres — PlanetScale Benchmarking Postgres — PlanetScale Announcing Vitess 22 — PlanetScale The Real Failure Rate of EBS — PlanetScale IO devices and latency — PlanetScale Announcing PlanetScale Metal — PlanetScale PlanetScale Metal: There’s no replacement for displacement — PlanetScale Upgrading Query Insights to Metal — PlanetScale Automating cherry-picks between OSS and private forks — PlanetScale Database Sharding — PlanetScale Anatomy of a Throttler, part 3 — PlanetScale Introducing sharding on PlanetScale with workflows — PlanetScale Announcing Vitess 21 — PlanetScale Announcing the PlanetScale vectors public beta — PlanetScale Anatomy of a Throttler, part 2 — PlanetScale Instant deploy requests — PlanetScale Anatomy of a Throttler, part 1 — PlanetScale Increase IOPS and throughput with sharding — PlanetScale Tracking index usage with Insights — PlanetScale Faster backups with sharding — PlanetScale Building data pipelines with Vitess — PlanetScale The State of Online Schema Migrations in MySQL — PlanetScale Optimizing aggregation in the Vitess query planner — PlanetScale Dealing with large tables — PlanetScale Announcing Vitess 20 — PlanetScale Self-managed Vitess vs Managed Vitess with PlanetScale — PlanetScale Achieving data consistency with the consistent lookup Vindex — PlanetScale The MySQL adaptive hash index — PlanetScale Introducing global replica credentials — PlanetScale Profiling memory usage in MySQL — PlanetScale Summer 2023: Fuzzing Vitess at PlanetScale — PlanetScale How PlanetScale makes schema changes — PlanetScale Identifying and profiling problematic MySQL queries — PlanetScale The Problem with Using a UUID Primary Key in MySQL — PlanetScale Announcing Vitess 19 — PlanetScale PlanetScale forever — PlanetScale Introducing schema recommendations — PlanetScale Amazon Aurora Pricing: The many surprising costs of running an Aurora database — PlanetScale Three common MySQL database design mistakes — PlanetScale OAuth applications are now available to everyone — PlanetScale Deprecating the Scaler plan — PlanetScale PlanetScale branching vs. Amazon Aurora blue/green deployments — PlanetScale Databases at scale — PlanetScale Considerations for building a database disaster recovery plan — PlanetScale Working with Geospatial Features in MySQL — PlanetScale PlanetScale vs Amazon Aurora replication — PlanetScale Introducing the Vantage and PlanetScale integration — PlanetScale MySQL isolation levels and how they work — PlanetScale Introducing the schemadiff command line tool — PlanetScale $ pscale ping — PlanetScale Announcing foreign key constraints support — PlanetScale The challenges of supporting foreign key constraints — PlanetScale What is HTAP? — PlanetScale Introducing Insights Anomalies — PlanetScale Webhook security: a hands-on guide — PlanetScale MySQL replication: Best practices and considerations — PlanetScale A guide to HTML email with Ruby on Rails and Tailwind CSS — PlanetScale Sharding for cost-effective database management — PlanetScale PlanetScale ranks 188th in Deloitte’s top 500 fastest-growing companies — PlanetScale Announcing the Fivetran integration — PlanetScale Introducing webhooks — PlanetScale What is MySQL replication and when should you use it? — PlanetScale Sync user data between Clerk and a PlanetScale MySQL database — PlanetScale Introducing database reports — PlanetScale Distributed caching systems and MySQL — PlanetScale What is MySQL partitioning? — PlanetScale MySQL High Availability: Connection handling and concurrency — PlanetScale
Introducing PlanetScale Insights: Advanced query monitoring — PlanetScale
Holly Guevara · 2022-05-26 · via Blog — PlanetScale

Holly Guevara [@hollylawly] |

If you’ve ever experienced the frustration of debugging slow or costly queries, we’ve got a treat for you. With PlanetScale Insights, you can now analyze and debug individual query performance during specified time frames without leaving your PlanetScale dashboard.

What is PlanetScale Insights

Insights is the next generation of our in-dashboard query statistics tool. This update brings an interactive graph that maps your PlanetScale database query performance to selected time frames for quick debugging. We’re also introducing a new section that shows important metrics for all active queries running against the database over the past 24 hours.

Insights time-based graph

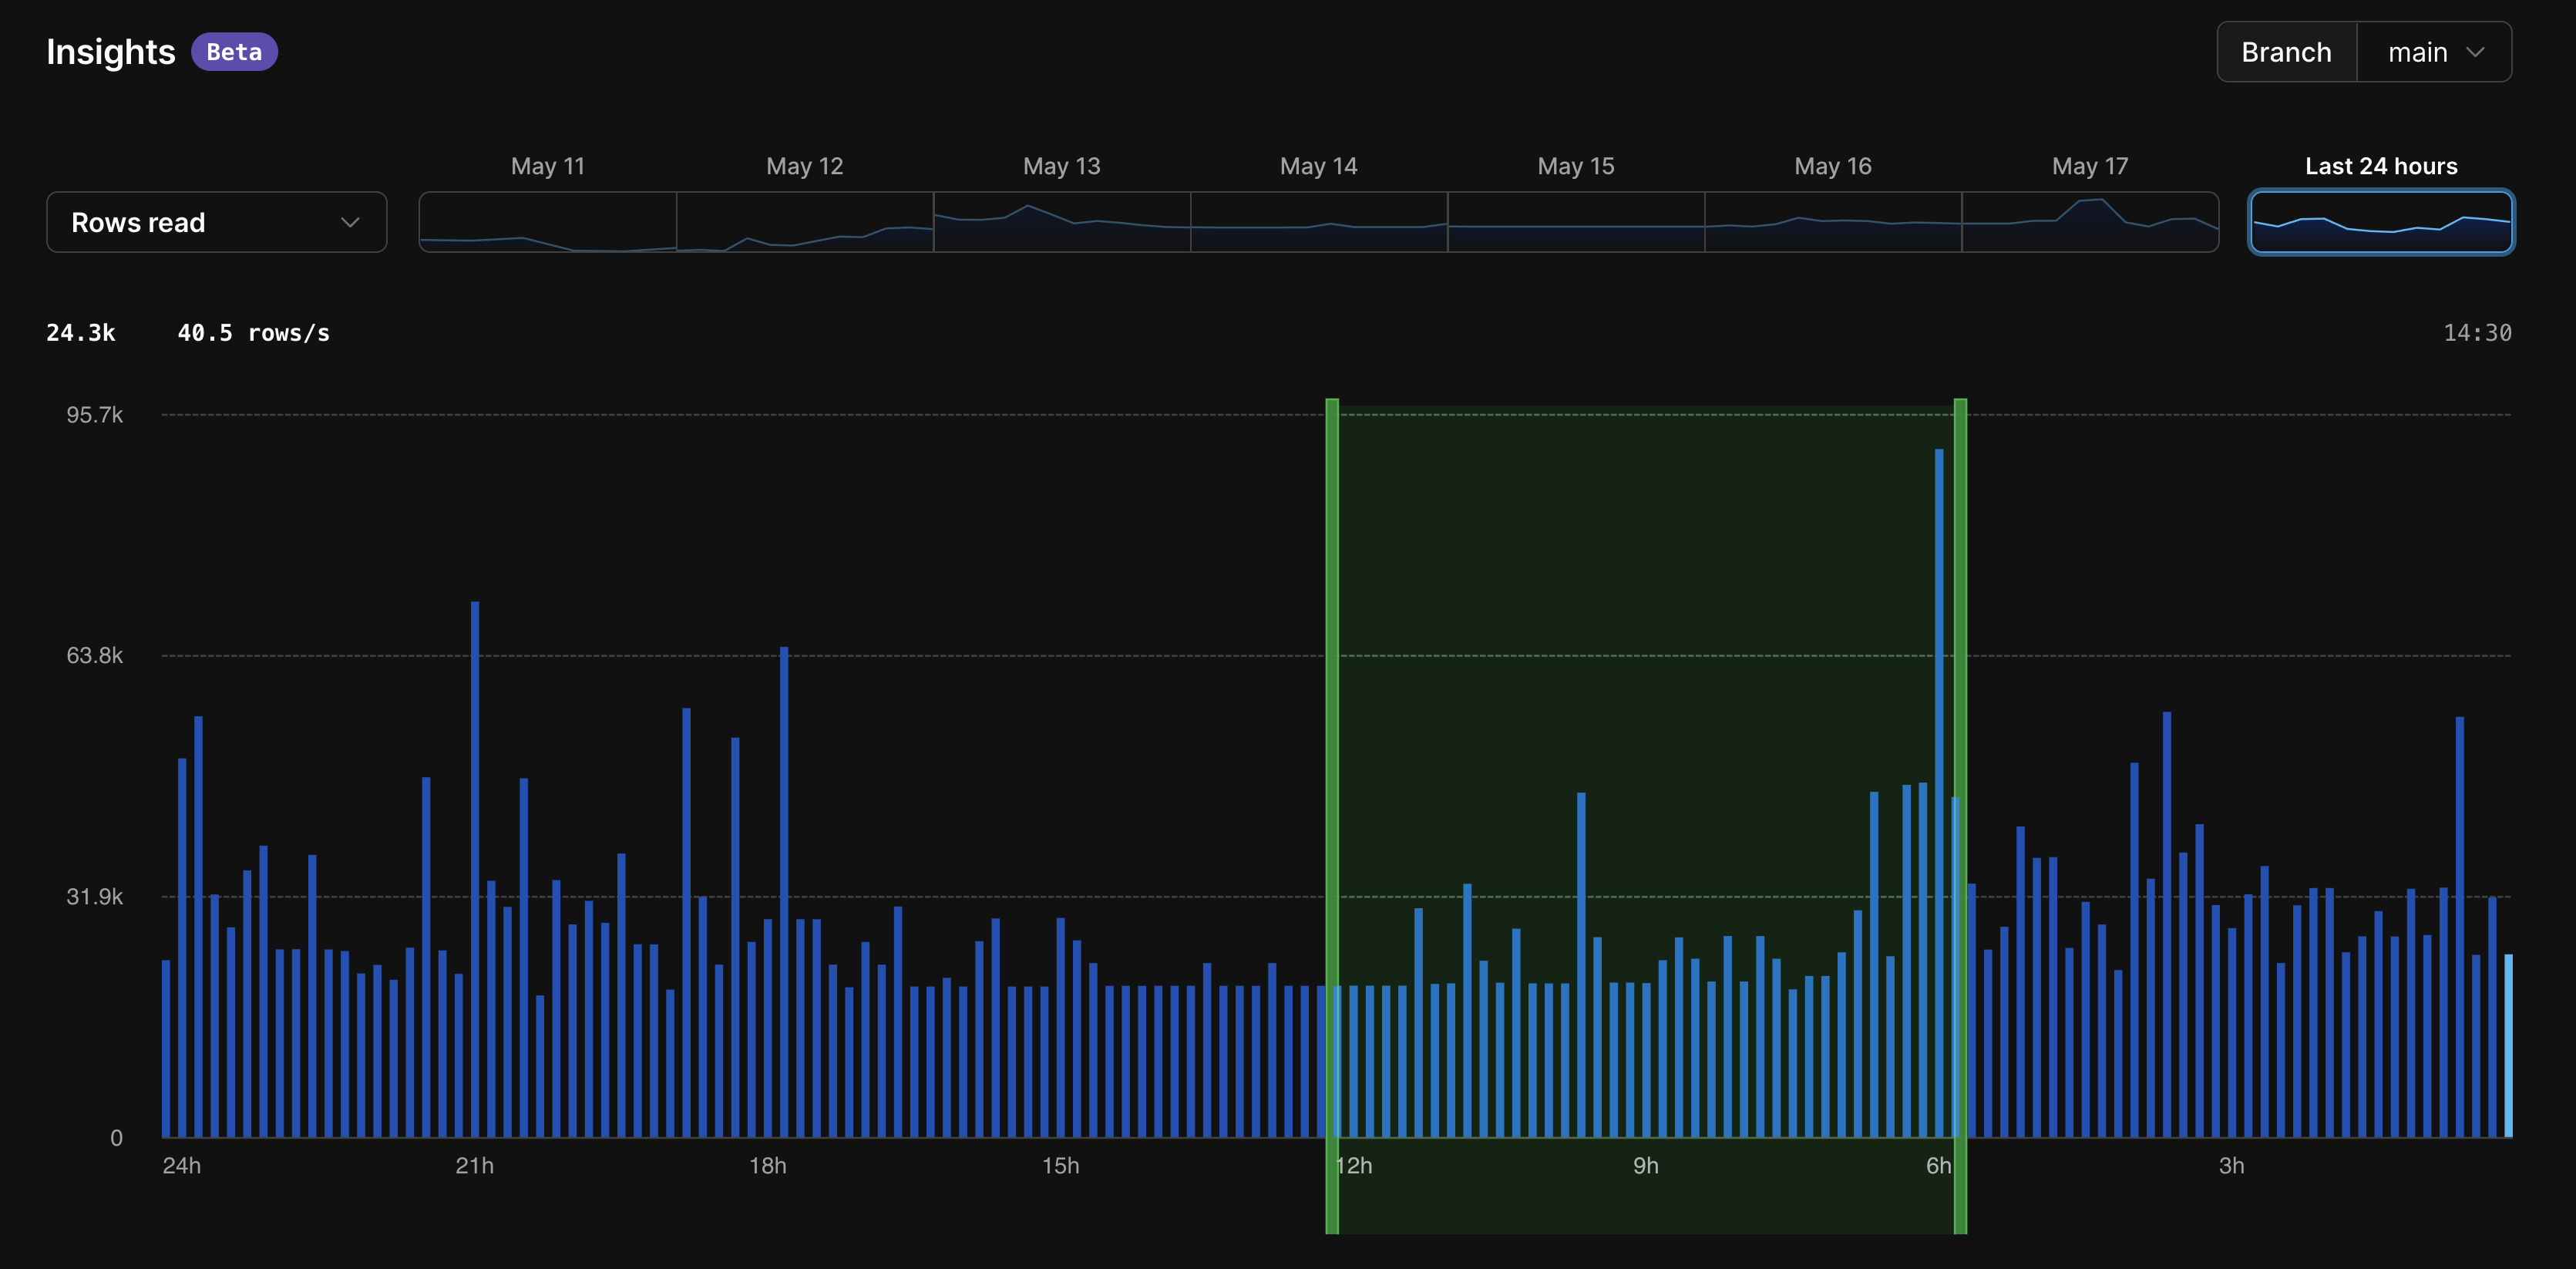
With the new Insights graph, you can monitor the following metrics at a glance:

  • Rows read
  • Rows written
  • Query latency
  • Queries per second

You can hover over a point on the graph to see the metrics in 10-minute increments. This will surface the total rows read, rows written, latency, or queries per second during the selected period.

Additionally, deploy requests will show up on the graph, allowing you to quickly see the impact of the latest schema changes.

Queries during the last 24 hours

We’ve also added a new section that shows all queries that have run against your database over the past 24 hours.

If you have a lot of active queries, you can zoom in on a shorter time frame by dragging your cursor on the graph to select the period you want to analyze.

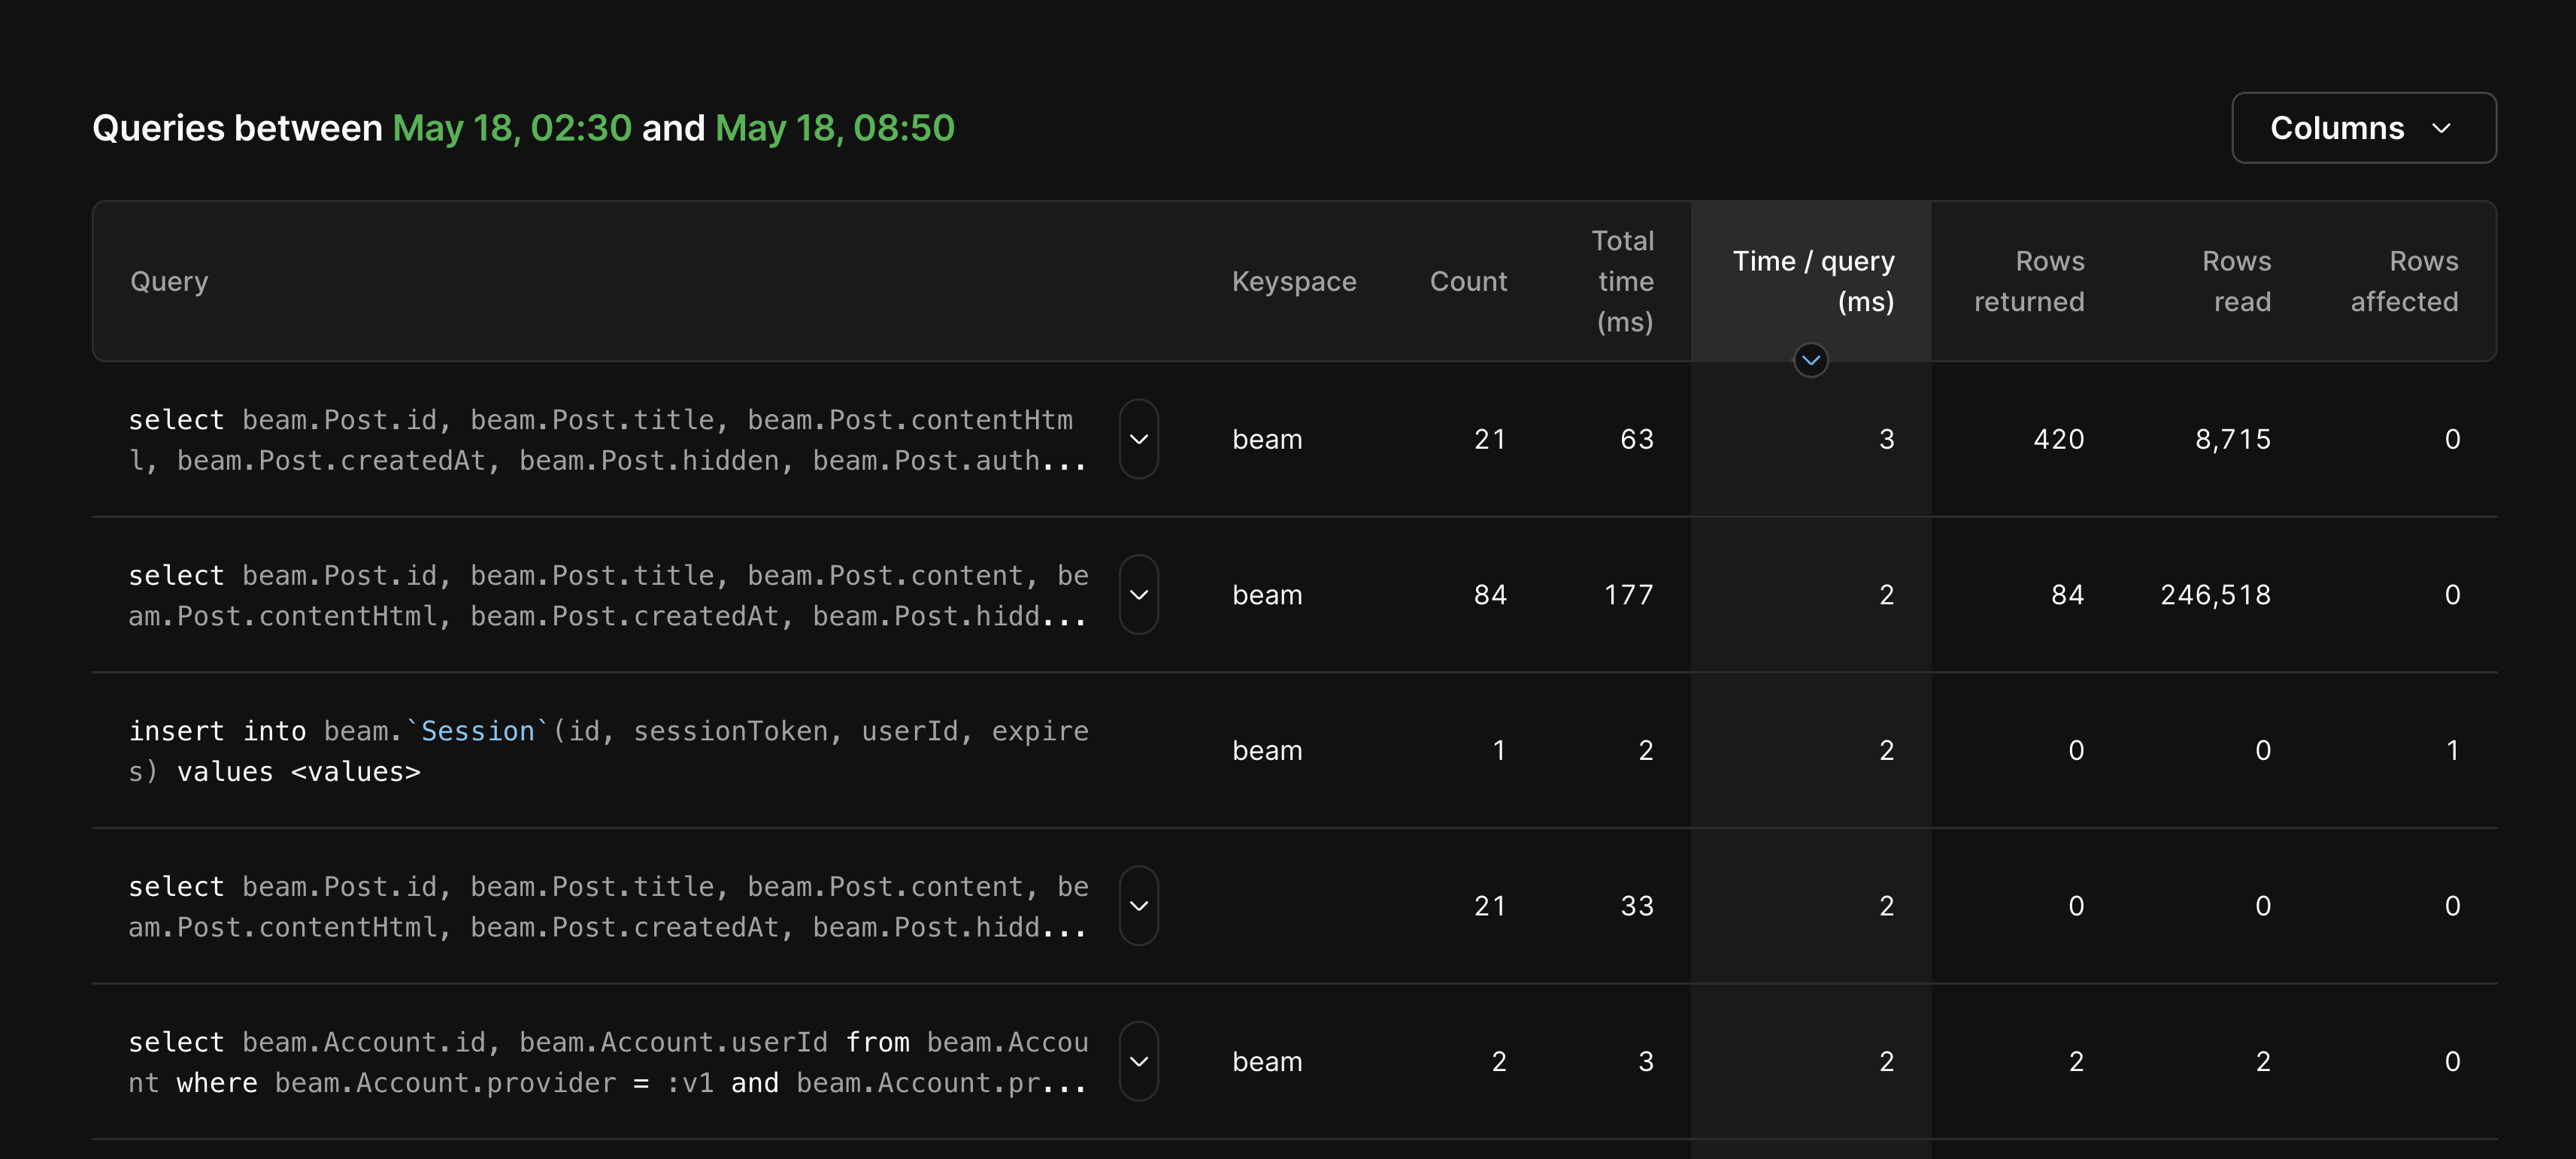
The following metrics are available for each query:

  • Number of times the query has run
  • Total time the query has run
  • Time per query
  • Rows returned
  • Rows read
  • Rows affected

We’re especially excited to surface the rows read per query! One component of PlanetScale billing includes total rows read per month, so Insights is a great resource to help you monitor how your queries affect rows read.

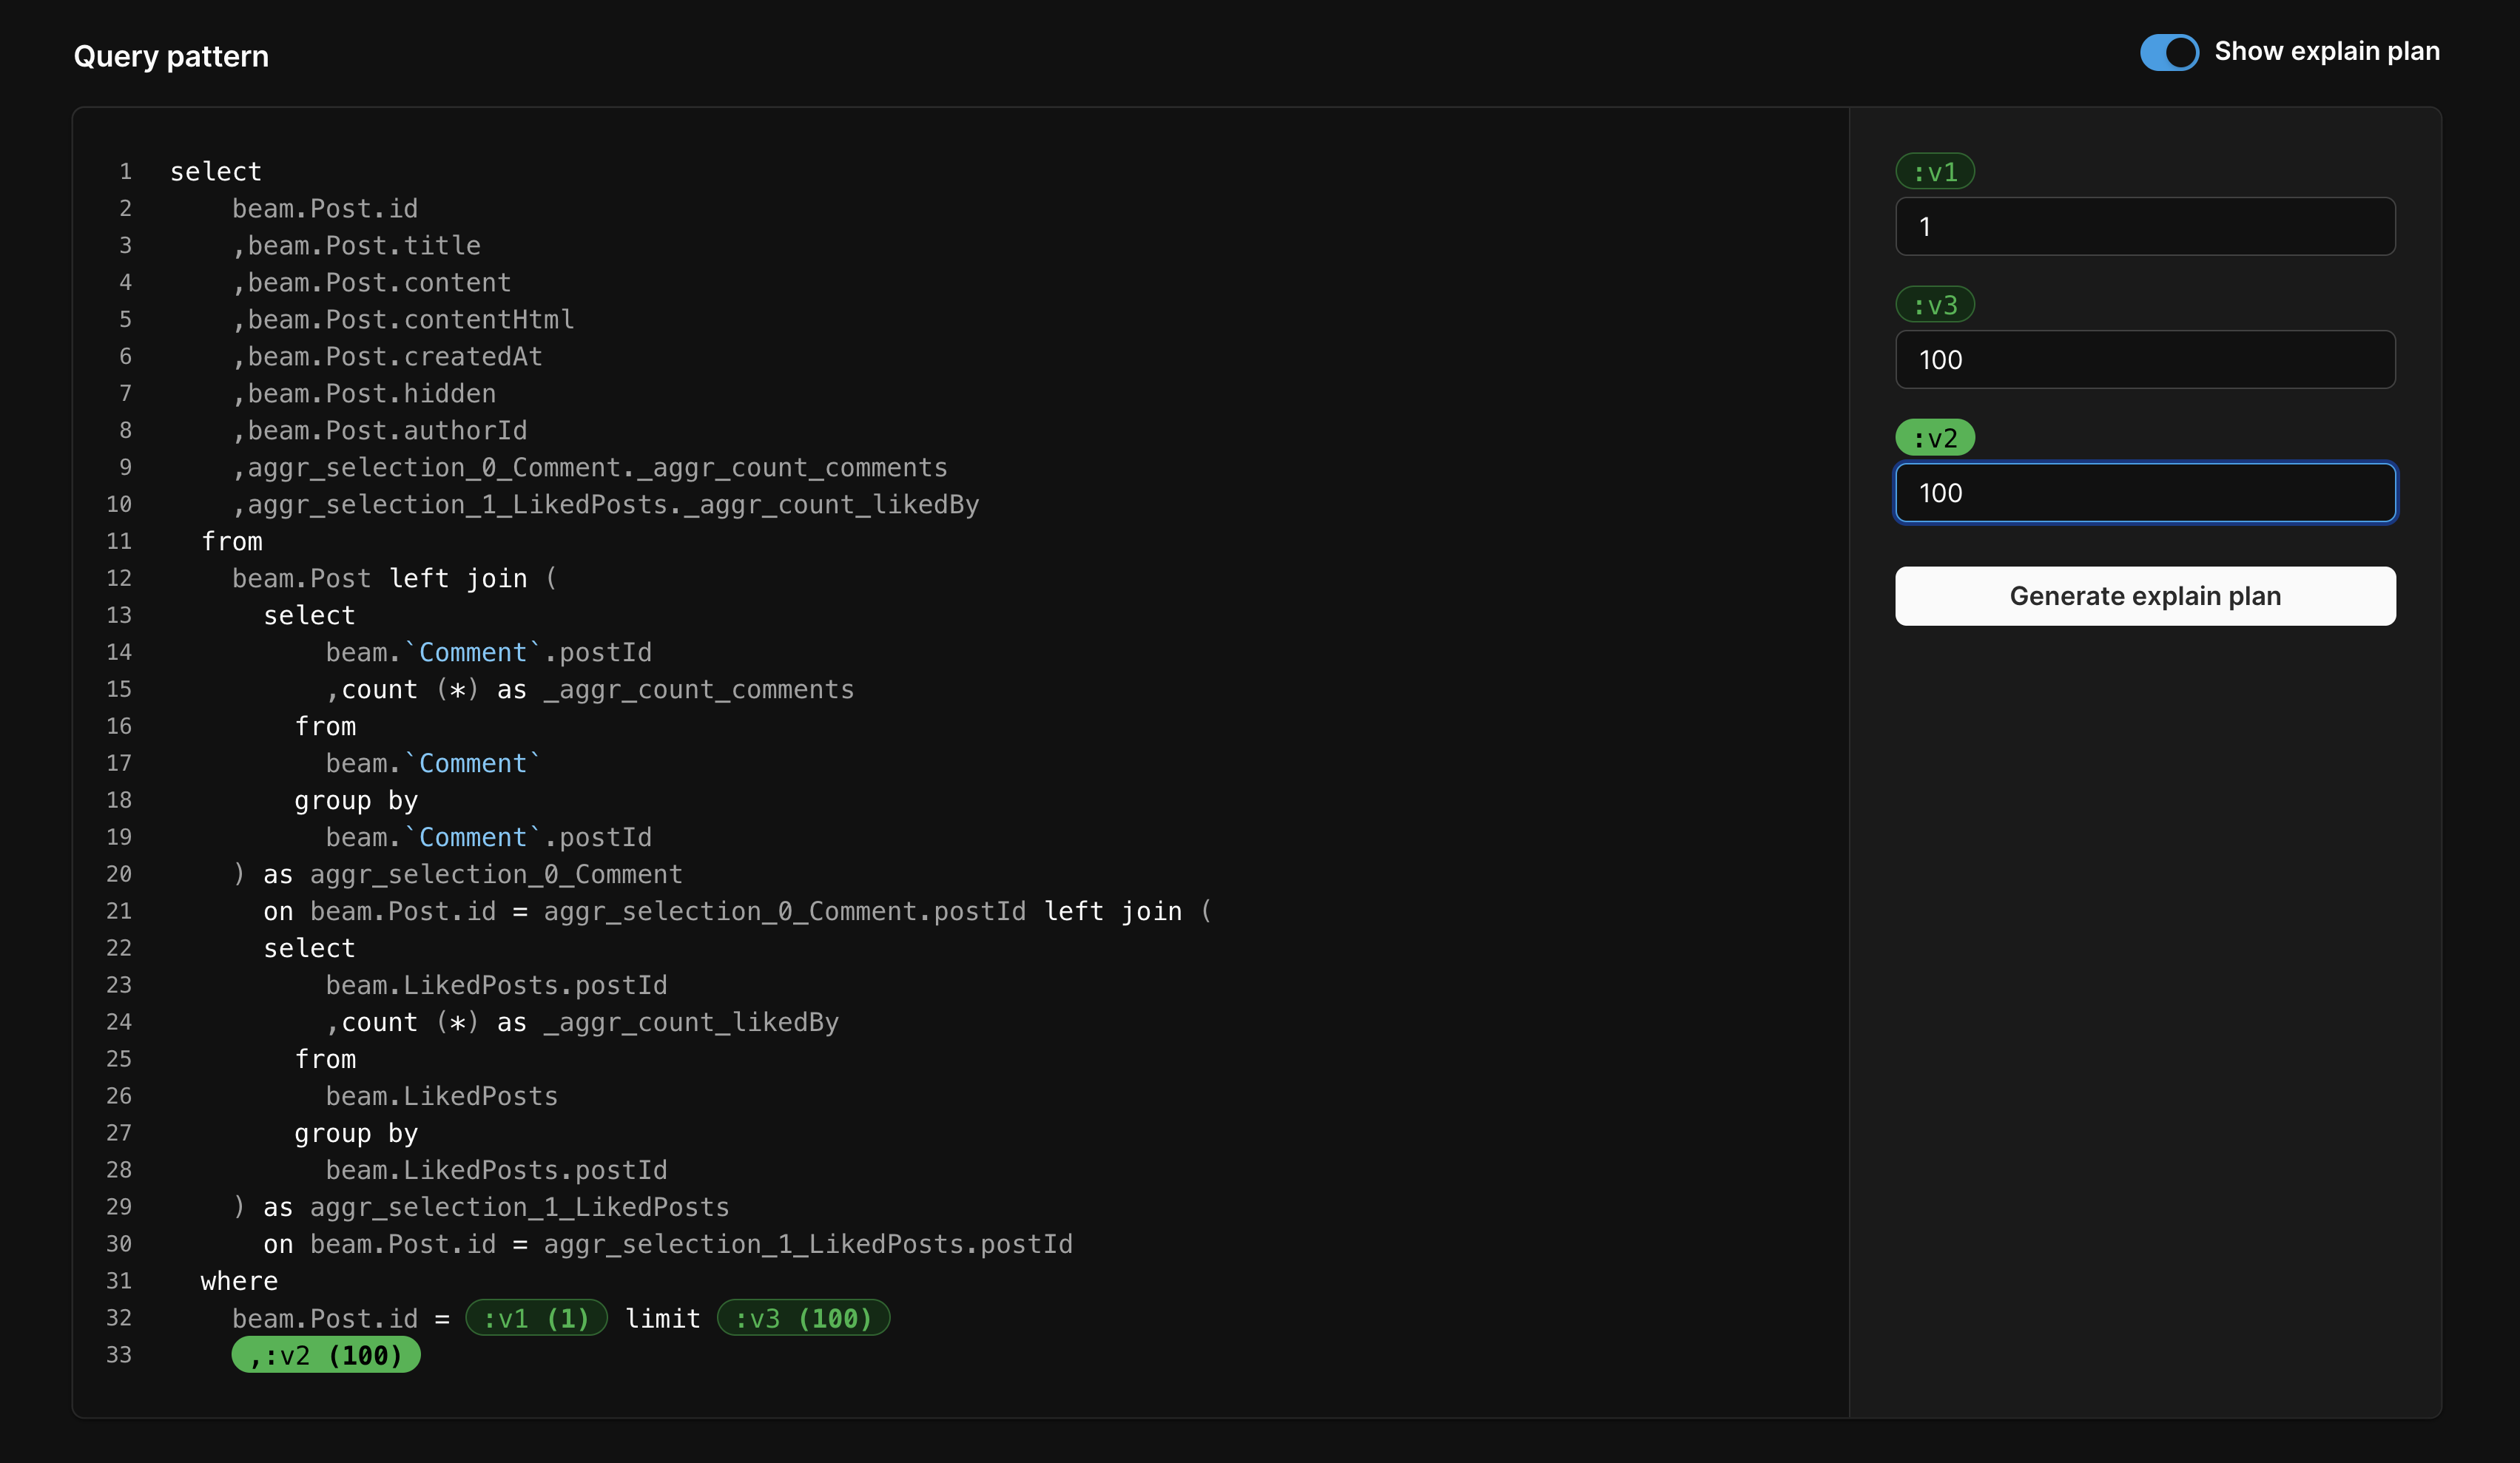
You can also click on a query to drill down even further. On the individual query page, you’ll find slow instances of the query, if applicable. We’ve also included a new UI for generating an EXPLAIN plan for each individual query, with the option to open it up in the web console as well.

Pricing and availability

Insights is included with all databases at no additional cost, with 7 days of query data retention.

To access Insights, select your database in the PlanetScale dashboard and click the "Insights" tab.

Insights in action

To help drive the power of Insights home, let’s see it in action.

In this example, we’ll walk through a practical use case using our very own database for an internal blogging platform.

Say we deployed a schema change to the production database and later noticed the posts page is loading slower than usual. Instead of spending hours searching for the offending query, we come to the Insights page to begin debugging.

We first look at the graph to identify any anomalies, such as any spikes in rows read or rows written. If this performance impact coincided with a deployment, the deploy request would show up on the graph next to the spike. This provides direct insight into what schema change caused the performance issues.

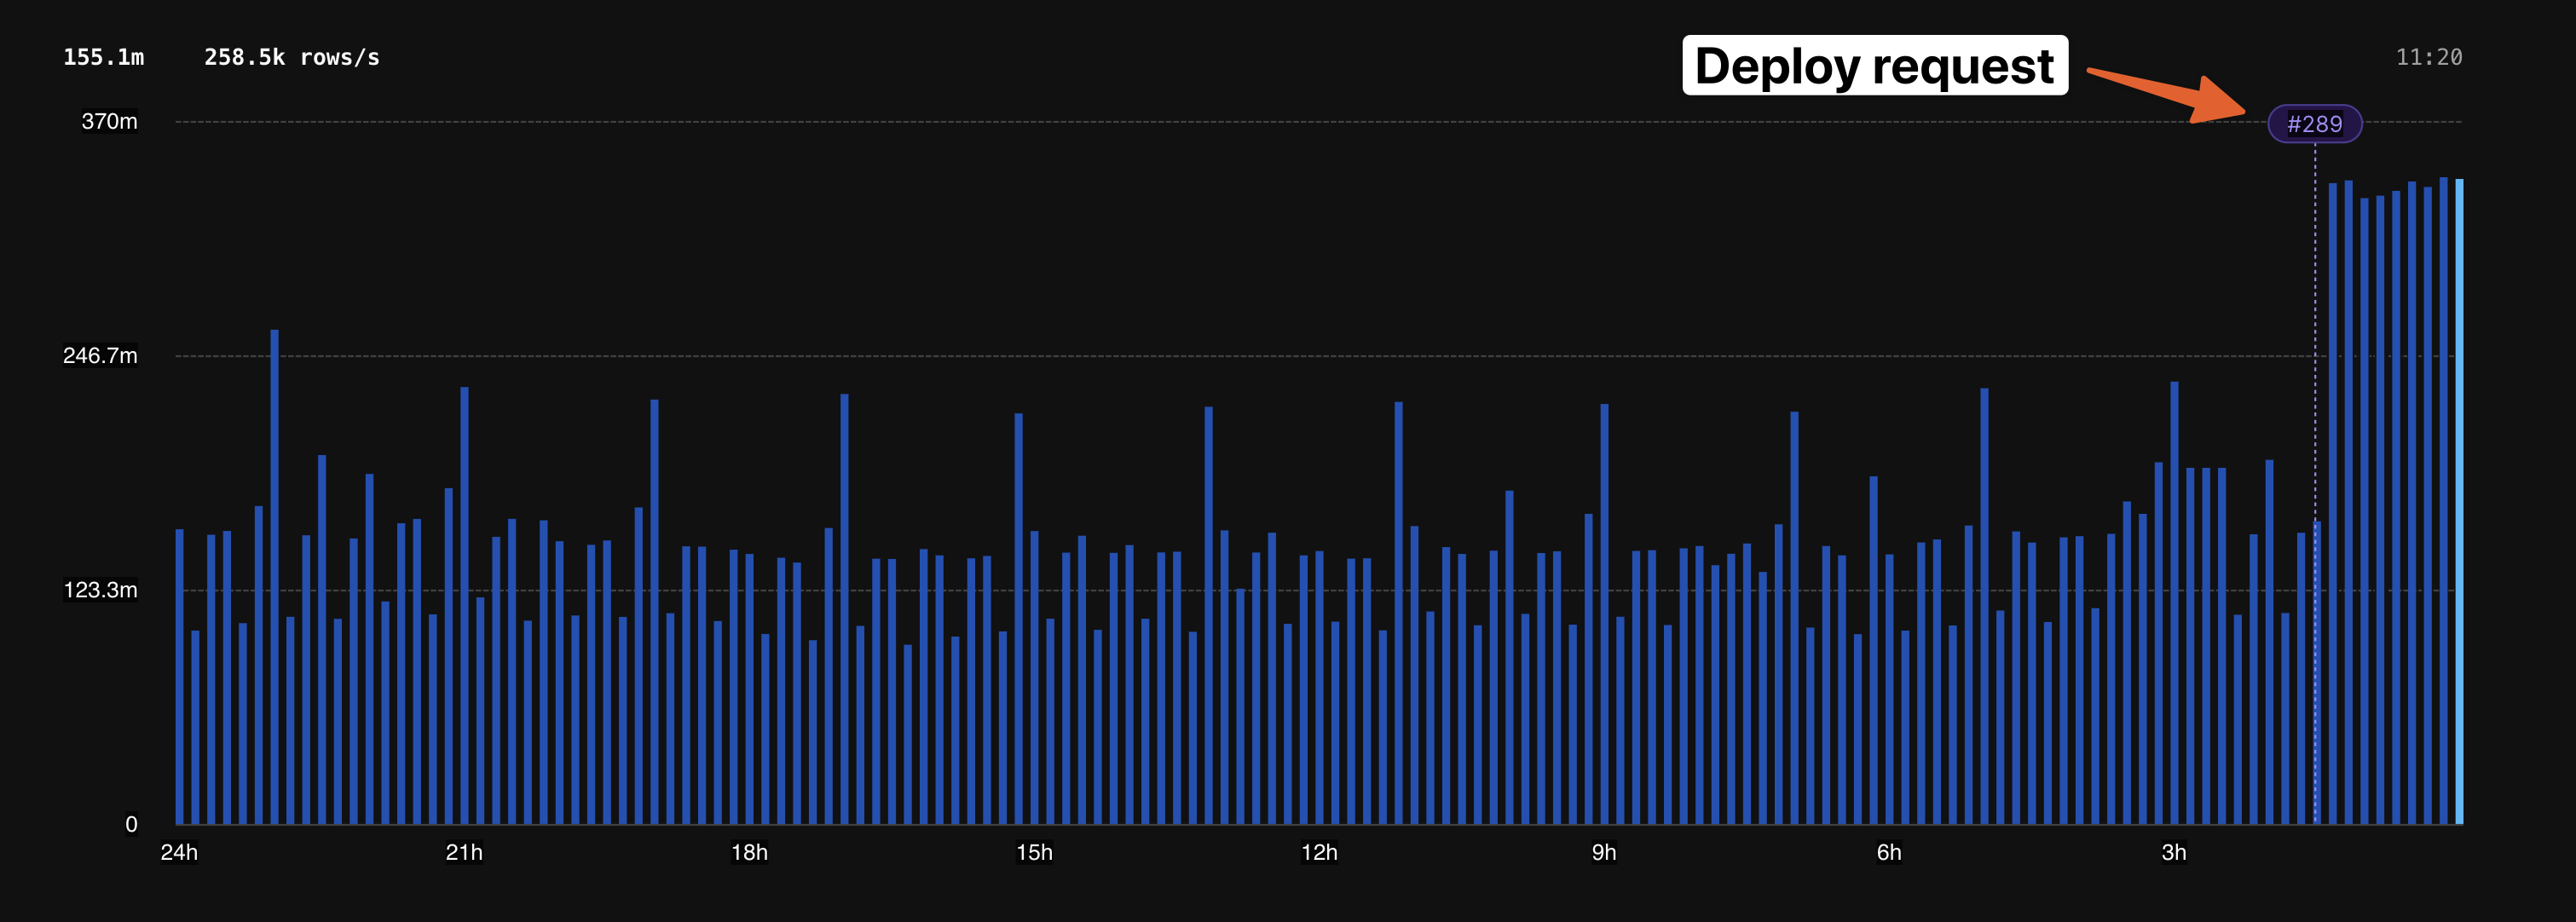
Based on the graph, we can see that there was a large spike right at the time we merged deploy request #289. This information gives us more confidence that this performance impact is indeed a database issue.

Next, we can drill down further by looking at the "Queries during the last 24 hours" table. We’ll sort by "Rows read" to quickly identify our largest queries and attempt to find the one that matches the spike on the graph.

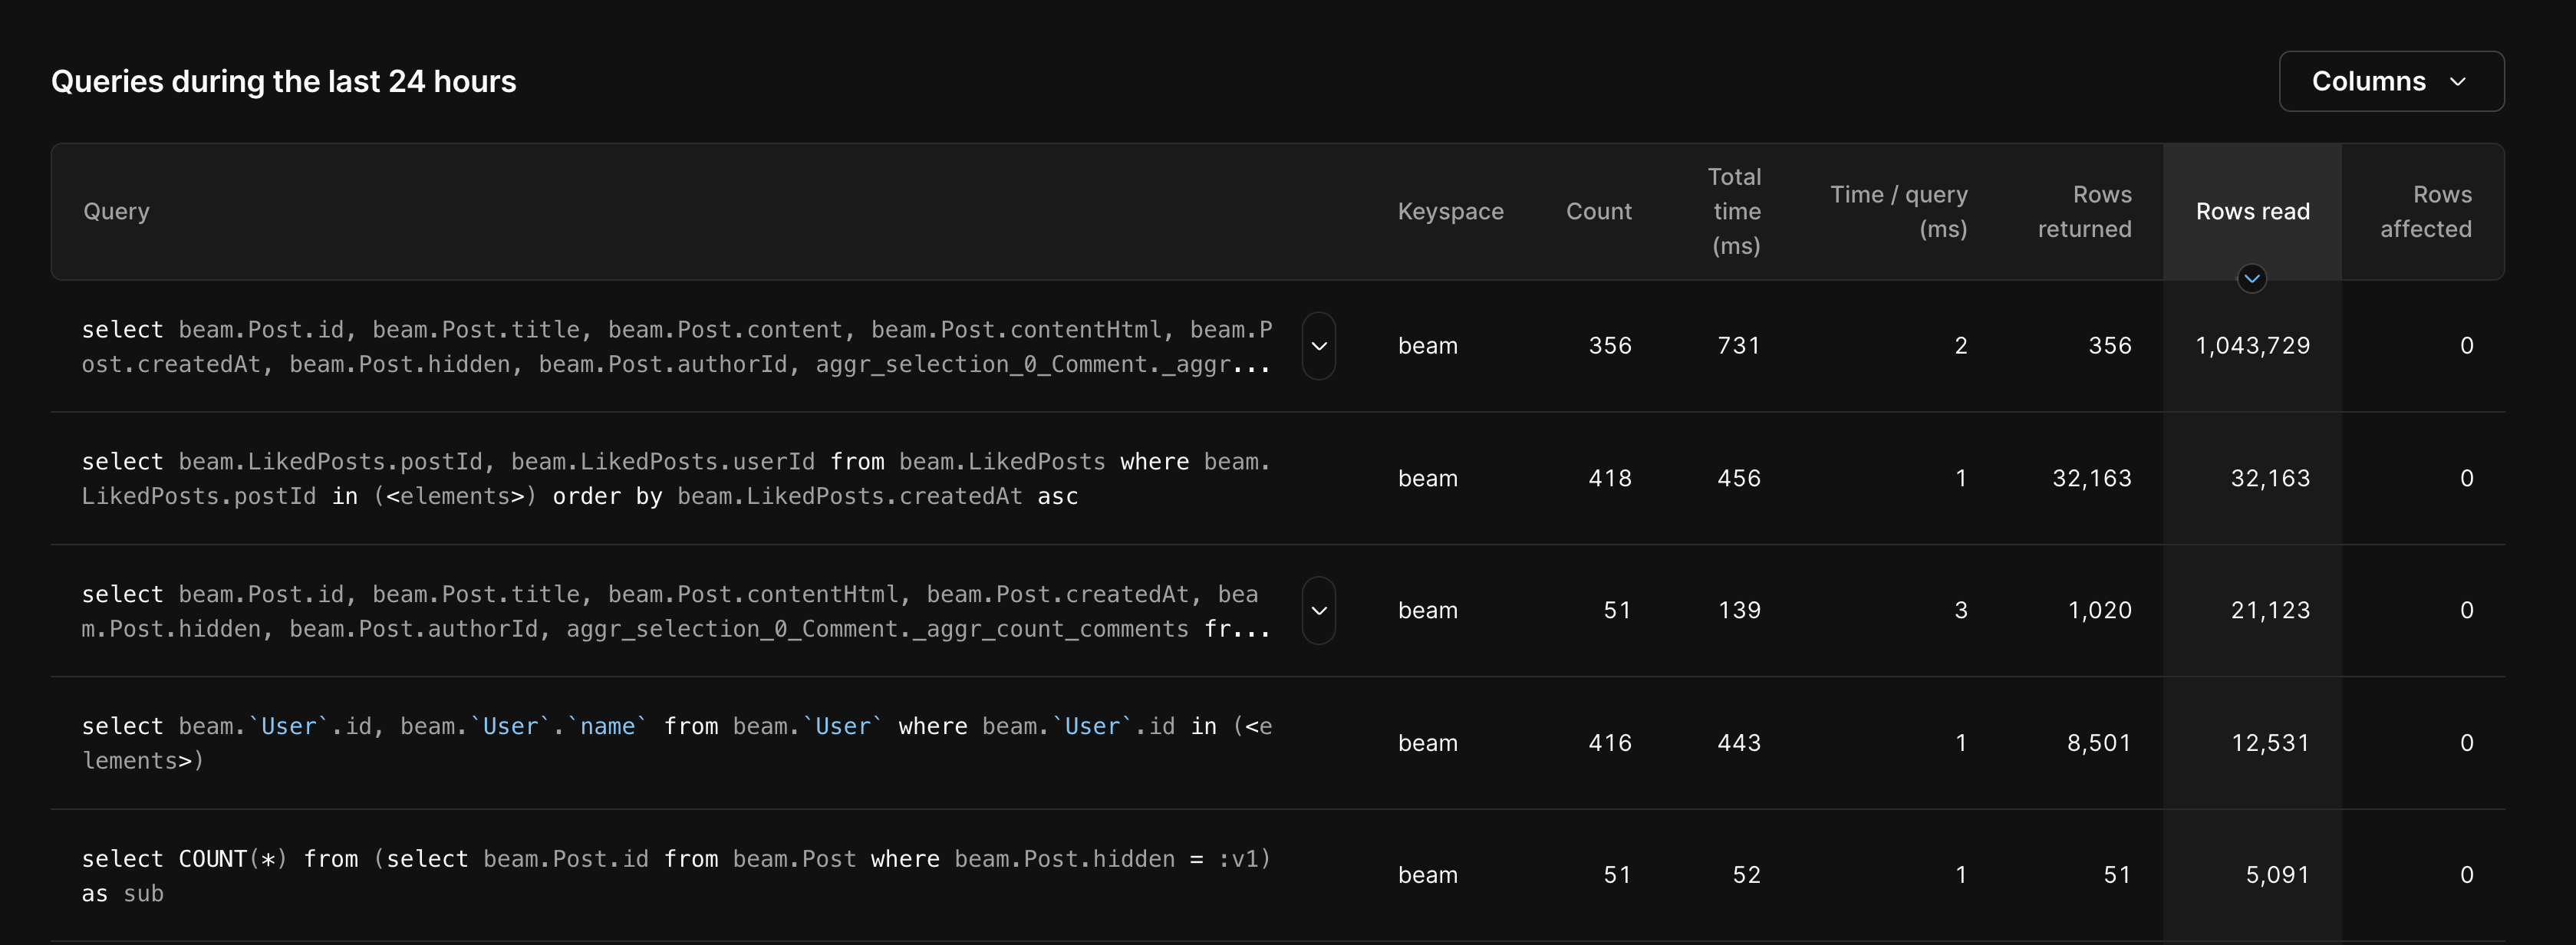
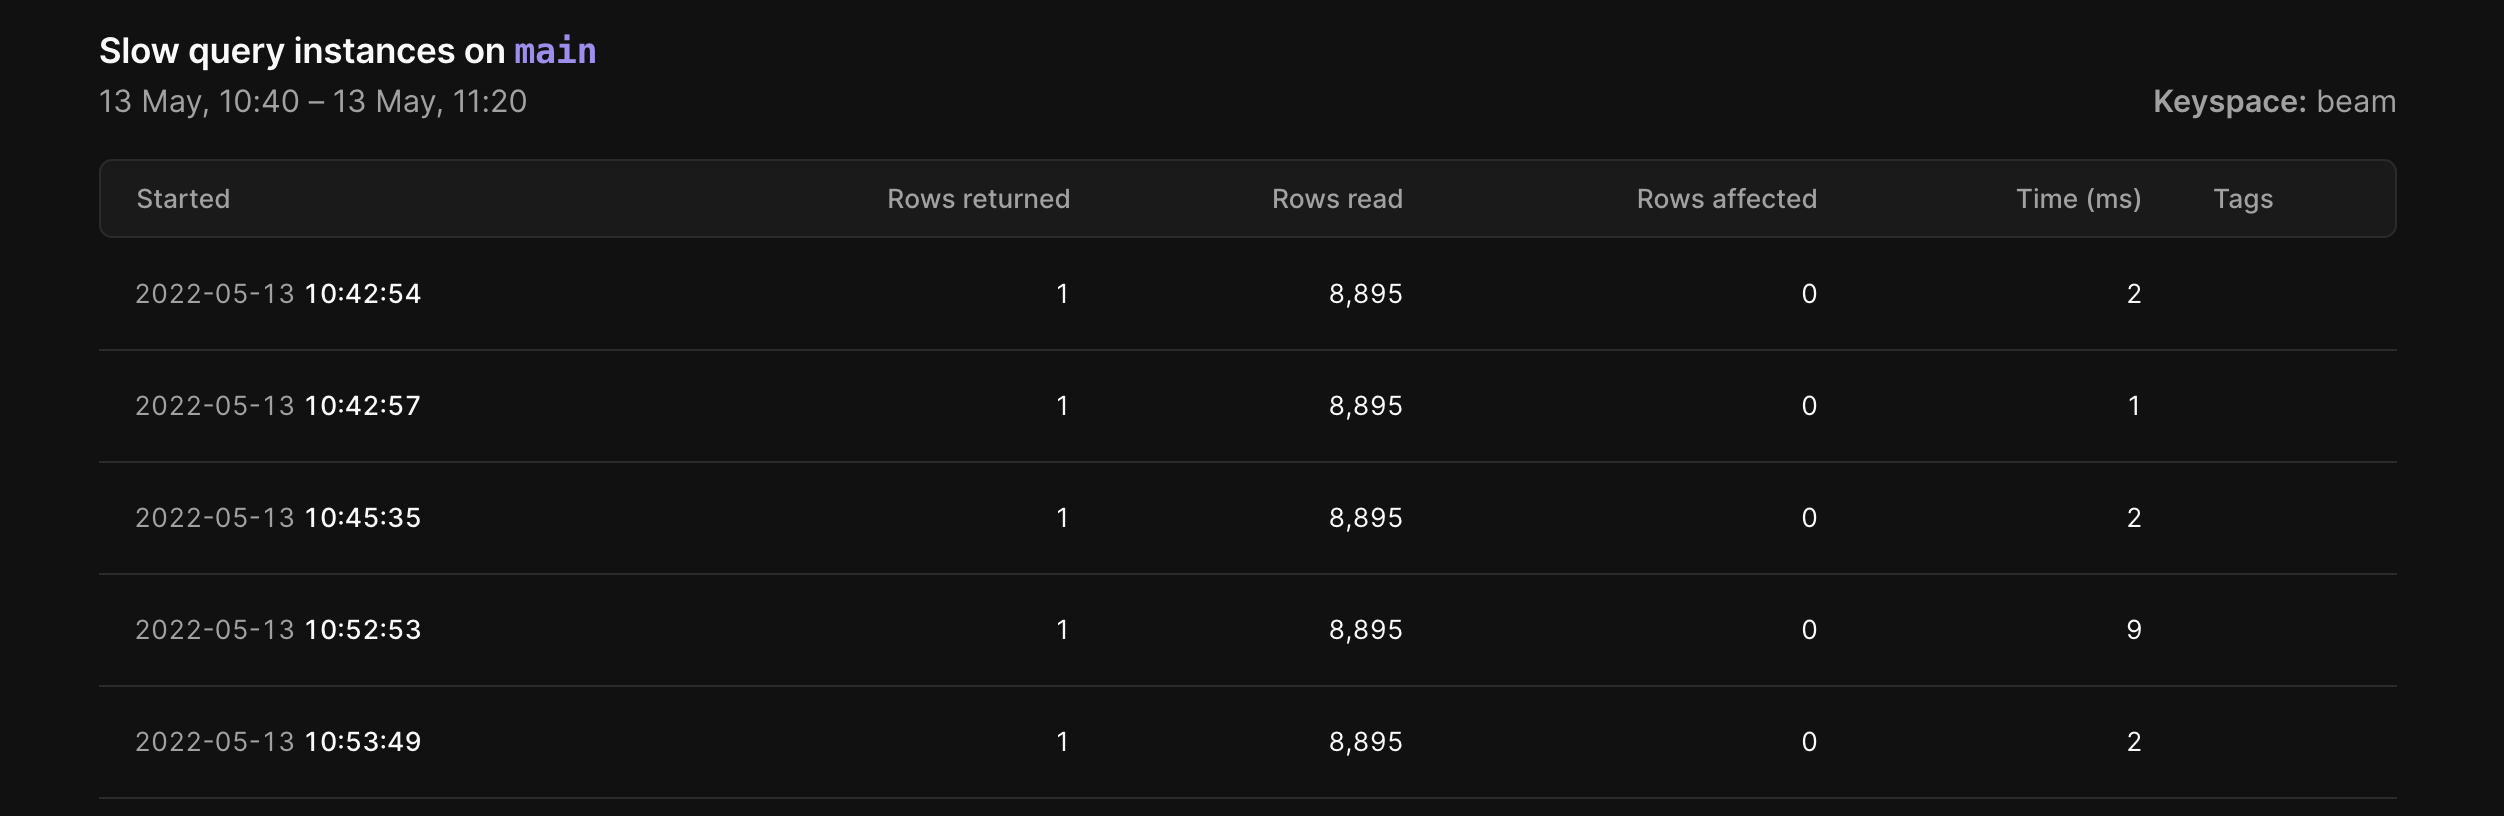
Up at the top, we see one query that stands out. At 1,043,729 rows read, it’s reading many more rows than we expect. Clicking on the query brings up the detailed view, which includes a list of all instances of the query running slowly in the past 24 hours.

Taking a closer look, we notice that this query has been running slowly since the previous deployment that we saw on the graph. We can open that deploy request to see what changed.

We have now identified the problematic query and linked it back to a schema change from our deploy request. With this information, we can create a new development branch where we can attempt to fix the issue. With Insights, we can see performance metrics for any branch, including development branches. As we’re developing the fix, we can come back to the Insights graph to confirm that our changes worked.

Finally, after deploying it to production, we come back to the Insights page to confirm production performance is back to normal.

Try it yourself

You can give Insights a spin today in the PlanetScale dashboard. You can then access Insights by clicking the “Insights” tab from your database overview page.

For more information, check out our Insights documentation. We love hearing from you! If you have any questions or feedback, don’t hesitate to contact us.