



惯性聚合 高效追踪和阅读你感兴趣的博客、新闻、科技资讯
阅读原文 在惯性聚合中打开

推荐订阅源

Spread Privacy
Spread Privacy
Engineering at Meta
Engineering at Meta
钛媒体:引领未来商业与生活新知
钛媒体:引领未来商业与生活新知
D
DataBreaches.Net
N
Netflix TechBlog - Medium
T
The Blog of Author Tim Ferriss
L
LangChain Blog
Jina AI
Jina AI
MongoDB | Blog
MongoDB | Blog
B
Blog
酷 壳 – CoolShell
酷 壳 – CoolShell
让小产品的独立变现更简单 - ezindie.com
月光博客
月光博客
freeCodeCamp Programming Tutorials: Python, JavaScript, Git & More
T
Tailwind CSS Blog
Google DeepMind News
WordPress大学
WordPress大学
T
Threatpost
V
V2EX
Security Archives - TechRepublic
GbyAI
GbyAI
Scott Helme
Scott Helme
Cyberwarzone
Cyberwarzone
H
Help Net Security
大猫的无限游戏
大猫的无限游戏
Security Latest
Security Latest
T
The Exploit Database - CXSecurity.com
T
Tenable Blog
S
Schneier on Security
博客园 - 叶小钗
Apple Machine Learning Research
F
Full Disclosure
腾讯CDC
cs.CL updates on arXiv.org
S
Security @ Cisco Blogs
A
Arctic Wolf
S
Securelist
Recent Commits to openclaw:main
T
Tor Project blog
The Register - Security
L
LINUX DO - 最新话题
Blog — PlanetScale
Blog — PlanetScale
U
Unit 42
V
Vulnerabilities – Threatpost
Google Online Security Blog
L
LINUX DO - 热门话题
TaoSecurity Blog
TaoSecurity Blog
Y
Y Combinator Blog
博客园 - 三生石上(FineUI控件)
C
CERT Recently Published Vulnerability Notes

Blog — PlanetScale

Keeping a Postgres queue healthy — PlanetScale Patterns for Postgres Traffic Control — PlanetScale Graceful degradation in Postgres — PlanetScale High memory usage in Postgres is good, actually — PlanetScale Stripe Projects partnership: Provision PlanetScale Postgres and MySQL databases from the Stripe CLI — PlanetScale Enhanced tagging in Postgres Query Insights — PlanetScale Behind the scenes: How Database Traffic Control works — PlanetScale Introducing Database Traffic Control — PlanetScale Scaling Postgres connections with PgBouncer — PlanetScale Drizzle joins PlanetScale — PlanetScale Video Conferencing with Postgres — PlanetScale Faster PlanetScale Postgres connections with Cloudflare Hyperdrive — PlanetScale Introducing the PlanetScale MCP server — PlanetScale Database Transactions — PlanetScale Automating our changelog with Cursor commands — PlanetScale Postgres 18 is now available — PlanetScale Using MotherDuck with PlanetScale — PlanetScale $50 PlanetScale Metal is GA for Postgres — PlanetScale AI-Powered Postgres index suggestions — PlanetScale $5 PlanetScale is live — PlanetScale Announcing Vitess 23 — PlanetScale $50 PlanetScale Metal — PlanetScale Report on our investigation of the 2025-10-20 incident in AWS us-east-1 — PlanetScale $5 PlanetScale — PlanetScale Benchmarking Postgres 17 vs 18 — PlanetScale Larger than RAM Vector Indexes for Relational Databases — PlanetScale Partnering with Cloudflare to bring you the fastest globally distributed applications — PlanetScale Processes and Threads — PlanetScale PlanetScale for Postgres is now GA — PlanetScale Postgres High Availability with CDC — PlanetScale Announcing Neki — PlanetScale Caching — PlanetScale The principles of extreme fault tolerance — PlanetScale Announcing PlanetScale for Postgres — PlanetScale Benchmarking Postgres — PlanetScale Announcing Vitess 22 — PlanetScale IO devices and latency — PlanetScale Announcing PlanetScale Metal — PlanetScale PlanetScale Metal: There’s no replacement for displacement — PlanetScale Upgrading Query Insights to Metal — PlanetScale Automating cherry-picks between OSS and private forks — PlanetScale Database Sharding — PlanetScale Anatomy of a Throttler, part 3 — PlanetScale Introducing sharding on PlanetScale with workflows — PlanetScale Announcing Vitess 21 — PlanetScale Announcing the PlanetScale vectors public beta — PlanetScale Anatomy of a Throttler, part 2 — PlanetScale Instant deploy requests — PlanetScale Anatomy of a Throttler, part 1 — PlanetScale Increase IOPS and throughput with sharding — PlanetScale Tracking index usage with Insights — PlanetScale Faster backups with sharding — PlanetScale Building data pipelines with Vitess — PlanetScale The State of Online Schema Migrations in MySQL — PlanetScale Optimizing aggregation in the Vitess query planner — PlanetScale Dealing with large tables — PlanetScale Announcing Vitess 20 — PlanetScale Self-managed Vitess vs Managed Vitess with PlanetScale — PlanetScale Achieving data consistency with the consistent lookup Vindex — PlanetScale The MySQL adaptive hash index — PlanetScale Introducing global replica credentials — PlanetScale Profiling memory usage in MySQL — PlanetScale Summer 2023: Fuzzing Vitess at PlanetScale — PlanetScale How PlanetScale makes schema changes — PlanetScale Identifying and profiling problematic MySQL queries — PlanetScale The Problem with Using a UUID Primary Key in MySQL — PlanetScale Announcing Vitess 19 — PlanetScale PlanetScale forever — PlanetScale Introducing schema recommendations — PlanetScale Amazon Aurora Pricing: The many surprising costs of running an Aurora database — PlanetScale Three common MySQL database design mistakes — PlanetScale OAuth applications are now available to everyone — PlanetScale Deprecating the Scaler plan — PlanetScale PlanetScale branching vs. Amazon Aurora blue/green deployments — PlanetScale Databases at scale — PlanetScale Considerations for building a database disaster recovery plan — PlanetScale Working with Geospatial Features in MySQL — PlanetScale PlanetScale vs Amazon Aurora replication — PlanetScale Introducing the Vantage and PlanetScale integration — PlanetScale MySQL isolation levels and how they work — PlanetScale Introducing the schemadiff command line tool — PlanetScale $ pscale ping — PlanetScale Announcing foreign key constraints support — PlanetScale The challenges of supporting foreign key constraints — PlanetScale What is HTAP? — PlanetScale Introducing Insights Anomalies — PlanetScale Webhook security: a hands-on guide — PlanetScale Announcing the Fivetran integration — PlanetScale Introducing webhooks — PlanetScale What is MySQL replication and when should you use it? — PlanetScale Sync user data between Clerk and a PlanetScale MySQL database — PlanetScale Introducing database reports — PlanetScale Distributed caching systems and MySQL — PlanetScale What is MySQL partitioning? — PlanetScale MySQL High Availability: Connection handling and concurrency — PlanetScale Personalizing your onboarding with Markdoc — PlanetScale PlanetScale vs. Amazon Aurora — PlanetScale PlanetScale vs. Amazon RDS — PlanetScale PlanetScale is bringing vector search and storage to MySQL — PlanetScale PlanetScale Managed is now PCI compliant — PlanetScale
The Real Failure Rate of EBS — PlanetScale
Nick Van Wiggeren · 2025-03-18 · via Blog — PlanetScale

Nick Van Wiggeren |

PlanetScale has deployed millions of Amazon Elastic Block Store (EBS) volumes across the world. We create and destroy tens of thousands of them every day as we stand up databases for customers, take backups, and test our systems end-to-end. Through this experience, we have an unique viewpoint into the failure rate and mechanisms of EBS, and have spent a lot of time working on how to mitigate them.

In complex systems, failure isn’t a binary outcome. Cloud native systems are built without single paths of failure, but partial failure can still result in degraded performance, loss of user-facing availability, and undefined behavior. Often, minor failure in one part of the stack appears as a full failure in others.

For example, if a single instance inside of a multi-node distributed caching system runs out of networking resources, the downstream application will interpret error cases as cache misses to avoid failing the request. This will overwhelm the database when the application floods it with queries to fetch data as though it was missing. In this, a partial failure at one level results in a full failure of the database tier, causing downtime.

Defining Failure

While full failure and data loss is very rare with EBS, “slow” is often as bad as “failed”, and that happens much much more often.

Here’s what “slow” looks like, from the AWS Console:
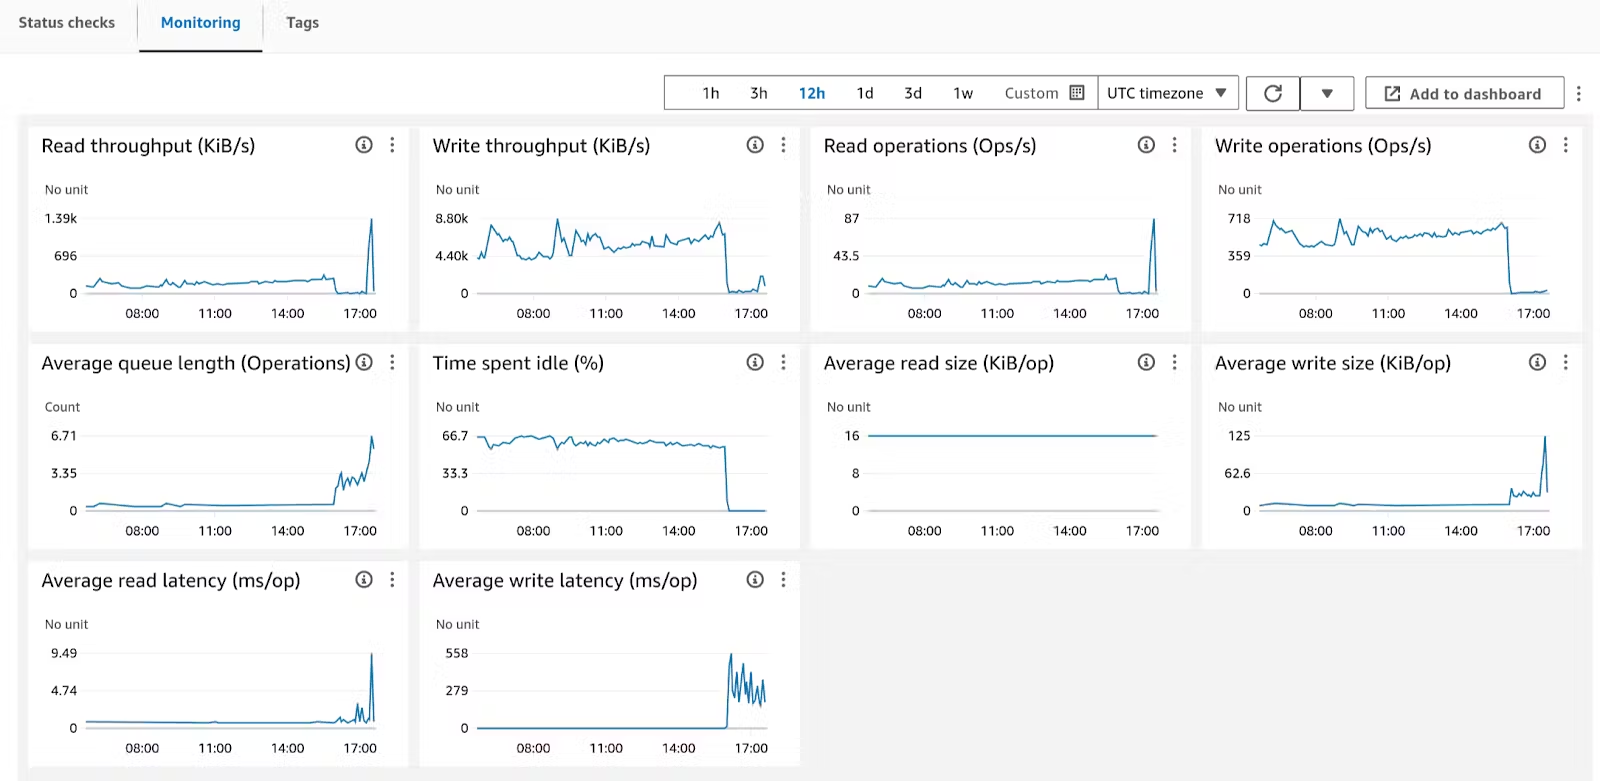
EBS Volume Degrading

This volume has been operating steadily for at least 10 hours. AWS has reported it at 67% idle, with write latency measuring at single-digit ms/operation. Well within expectations. Suddenly, at around 16:00, write latency spikes to 200ms-500ms/operation, idle time races to zero, and the volume is effectively blocked from reading and writing data.

To the application running on top of this database: this is a failure. To the user, this is a 500 response on a webpage after a 10 second wait. To you, this is an incident. At PlanetScale, we consider this full failure because our customers do.

The EBS documentation is useful in helping us understand what promises AWS’ gp3 is able to make:

When attached to an EBS–optimized instance, General Purpose SSD (gp2 and gp3) volumes are designed to deliver at least 90 percent of their provisioned IOPS performance 99 percent of the time in a given year

This means a volume is expected to experience under 90% of its provisioned performance 1% of the time. That’s 14 minutes of every day or 86 hours out of the year of potential impact. This rate of degradation far exceeds that of a single disk drive or SSD. This is the cost of separating storage and compute and the sheer complexity of the software and networking components between the client and the backing disks for the volume.

In our experience, the documentation is accurate: sometimes volumes pass in and out of their provisioned performance in small time windows:

EBS volume having a short blip

However, these short windows are enough to have impact on real-time workloads:
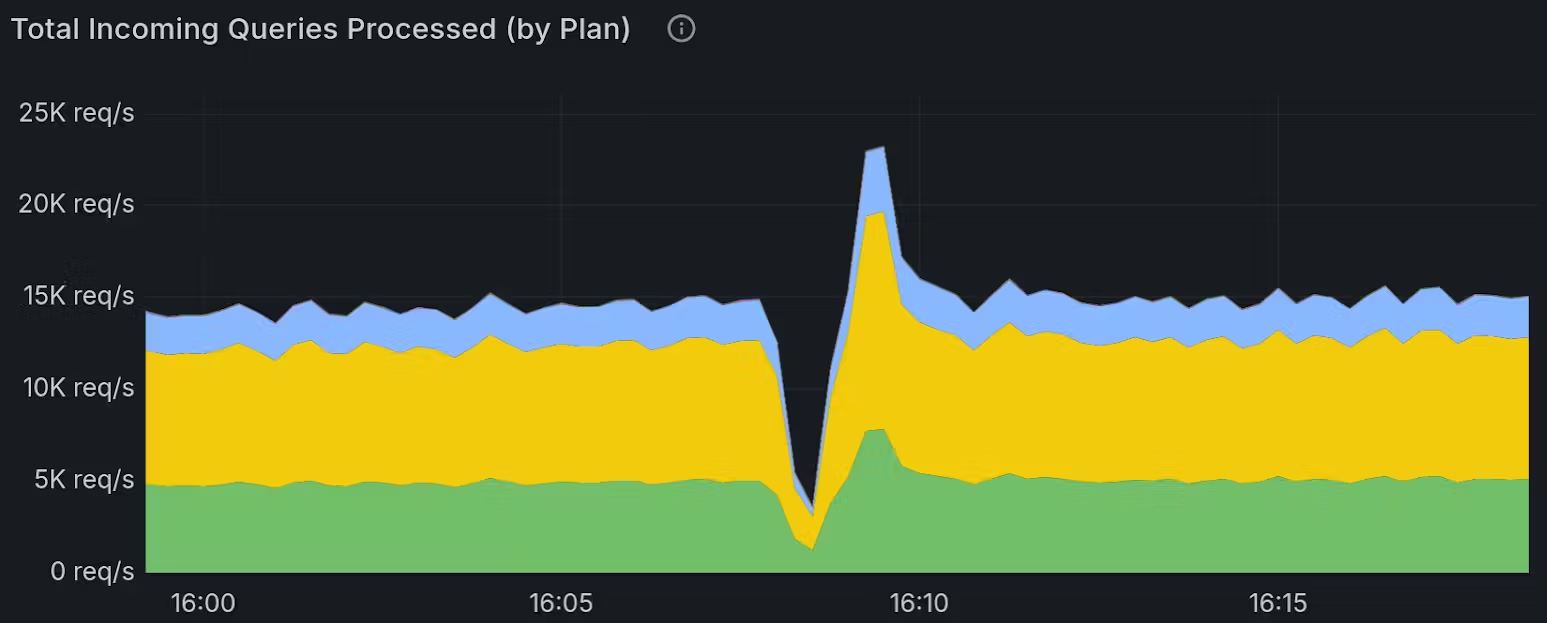
Database blip due to EBS

Production systems are not built to handle this level of sudden variance. When there are no guarantees, even overprovisioning doesn’t solve the problem. If this were a once-in-a-million chance, it would be different, but as we’ll discuss below, that is far from the case.

The True Rate of Failure

At PlanetScale, we see failures like this on a daily basis - the rate of failure is frequent enough that we’ve built systems that monitor EBS volumes directly to minimize impact.

This is not a secret, it's from the documentation. AWS doesn’t describe how failure is distributed for gp3 volumes, but in our experience it tends to last 1-10 minutes at a time. This is likely the time needed for a failover in a network or compute component.

Let's assume the following: Each degradation event is random, meaning the level of reduced performance is somewhere between 1% and 89% of provisioned, and your application is designed to withstand losing 50% of its expected throughput before erroring. If each individual failure event lasts 10 minutes, every volume would experience about 43 events per month, with at least 21 of them causing downtime!

In a large database composed of many shards, this failure compounds. Assume a 256 shard database where each shard has one primary and two replicas: a total of 768 gp3 EBS volumes provisioned. If we take the 50% threshold from above, there is a 99.65% chance you have at least one node experiencing a production-impacting event at any given time.

Even if you use io2, which AWS sells at 4x to 10x the price, you’d still be expected to be in a failure condition roughly one third of the time in any given year on just that one database!

To make matters worse, we also see these frequently as correlated failure inside of a single zone, even using io2 volumes:
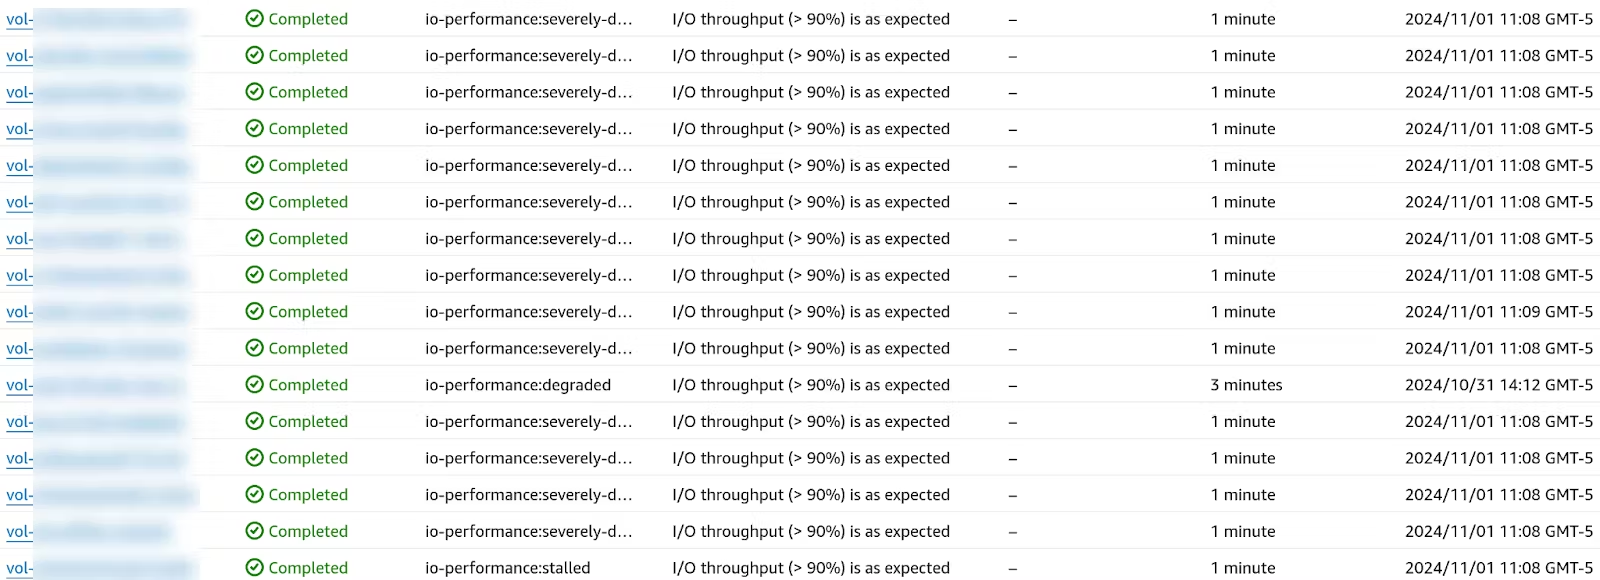
Correlated EBS Failure

With enough volumes, the rate of experiencing EBS failure is 100%: our automated mitigations are consistently recycling underperforming EBS volumes to reduce customer-impact, and we expect to see multiple events on a daily basis.

That’s the true rate of failure of EBS: it’s constant, variable, and all by design. Because there are no performance guarantees when volumes are not operating to their specifications, it is extremely difficult to plan around for workloads that require consistent performance. You can pay for additional nines, but with enough drives over a long enough timeframe, failure is guaranteed.

Handling Failure

At PlanetScale, our mitigations have clamped down on the expected maximum time for an impact window. We monitor metrics such as read/write latency and idle % closely, and we've even developed basic tests like making sure we can write to a file. This allows us to respond quickly to performance issues, and ensures that an EBS volume isn’t ‘stuck’.

When we detect that an EBS volume is in a degraded state using these heuristics, we can perform a zero-downtime reparent in seconds to another node in the cluster, and automatically bring up a replacement volume. This doesn’t reduce the impact to zero, as it’s impossible to detect this failure before it happens, but it does ensure the majority of the cases don’t require a human to remediate and are over before users notice.

This is why we built PlanetScale Metal. With a shared-nothing architecture that uses local storage instead of network-attached storage like EBS, the rest of the shards and nodes in a database are able to continue to operate without problem.