







Simeon Griggs [@simeonGriggs] |
There are so many ways your database can disappoint you. It'll make your application perform in ways you don't expect and upset your users.
In a sufficiently complex application, finding and eliminating performance problems can be difficult. Fortunately, PlanetScale gives you the tools to isolate the problem. PlanetScale Insights, available in the dashboard and through the MCP server, provides accurate, up-to-date information on how the queries in your codebase perform in production.
But with so many different metrics available, how do you differentiate good numbers from bad, signal from noise, or know what the most likely fix is once you've pinned down the problem?
For this post, I'll walk through exploring Query Insights for a demo e-commerce app connected to a PlanetScale Postgres PS-10 database with a few million rows of data. I set up a flow of constant, regular traffic along with a few "unexpected" spikes.
PlanetScale Insights also works for PlanetScale Vitess/MySQL databases and has many of the same features. This post focuses only on PlanetScale Postgres.
Latency timeline graph
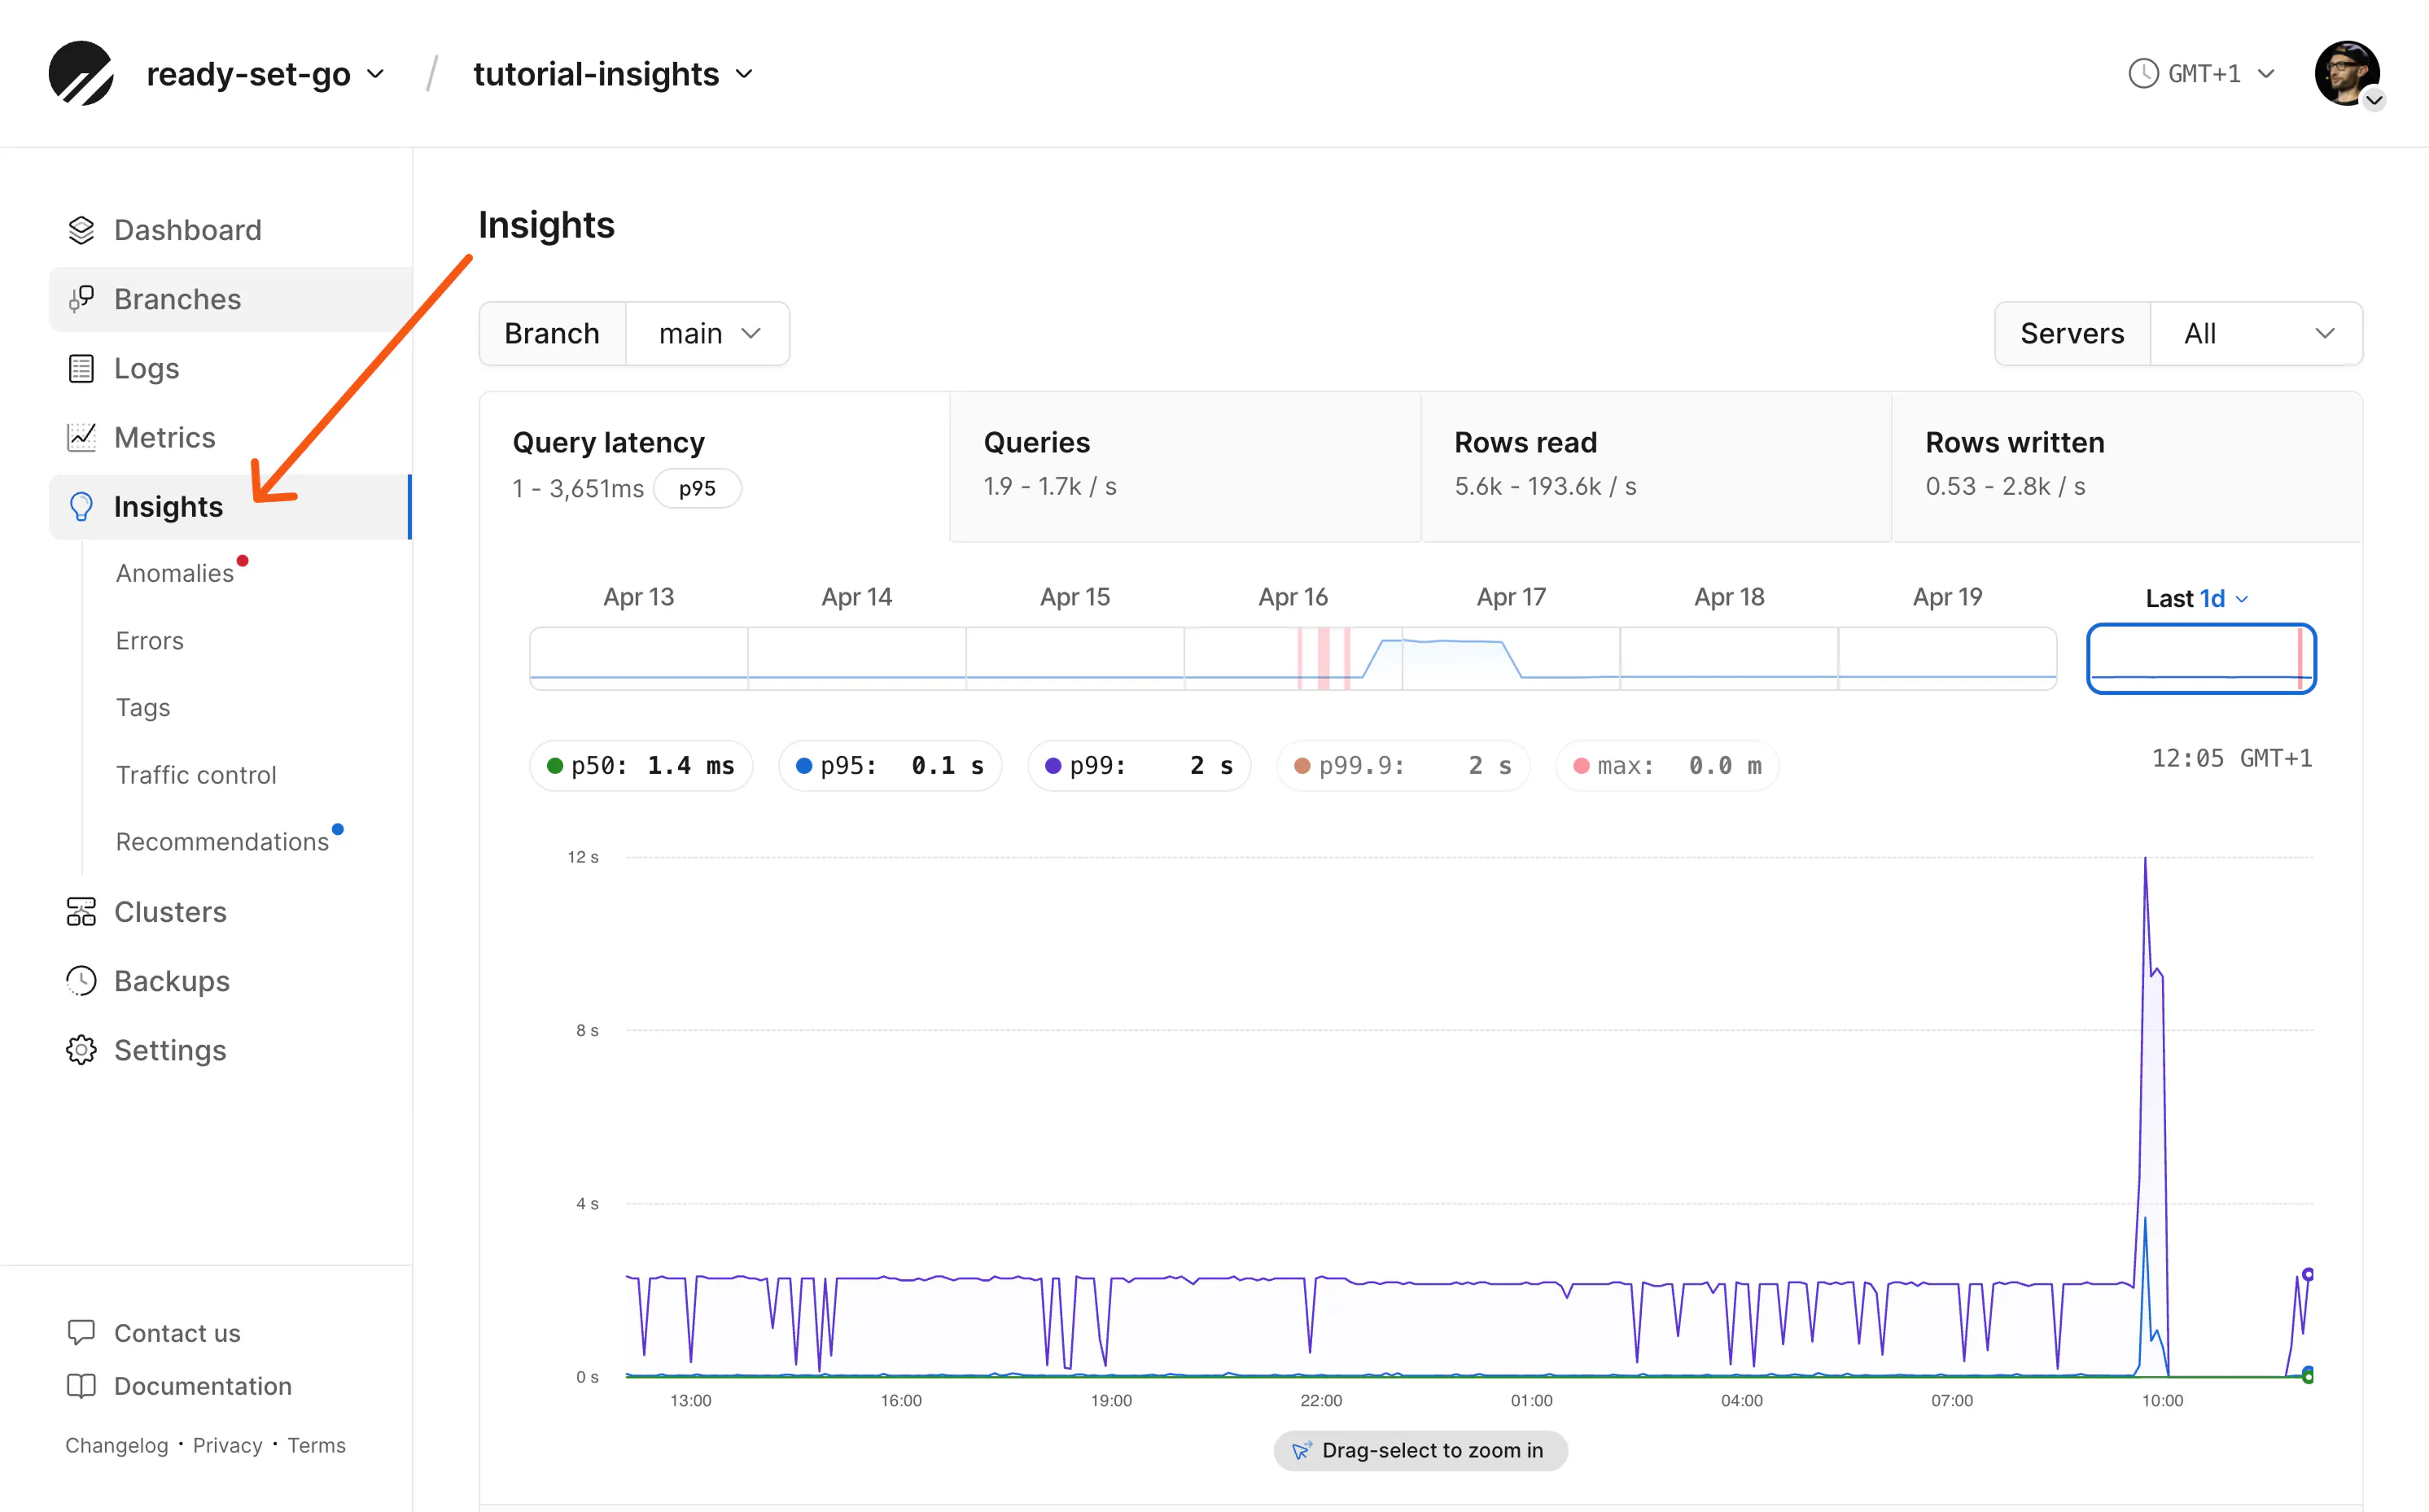
The default view of the PlanetScale Insights dashboard shows query performance, counts, and row reads and writes for the past 24 hours. You can navigate through up to seven days' worth of traffic data.
Query latency is the best starting point for isolating query performance issues. You can toggle trend lines in the graph on and off; the query list below aligns with the same timeline.
On this page, latency percentiles are computed from all query pattern executions performed within the observable time window. How fast most runs are versus the slow tail. That is how you differentiate the median run (p50) versus the worst few percent (p99 and above).
- p50: Half of this query's executions complete faster than this value, half slower. This is the median latency for that pattern.
- p95: 95% of executions complete faster than this; only 1 in 20 are slower. This filter identifies patterns that occasionally misbehave, but tuning them often will not move overall database latency (for example, workload p50) very much.
- p99: 99% of executions complete faster than this; only 1 in 100 are slower. This is where gains can be made for that pattern's worst runs.
- p99.9: Only 1 in 1,000 executions are slower. These are usually extreme outliers for that pattern: lock contention, cold caches, missing indexes, table scans, and similar.
- Max: The single slowest execution of this pattern in the time window. Useful for spotting worst-case scenarios, but a single anomaly can skew this number and may be related to an almost random event that never reoccurs. Always compare it against the percentiles above.
For a deeper dive on understanding latency percentiles, watch Ben's video.
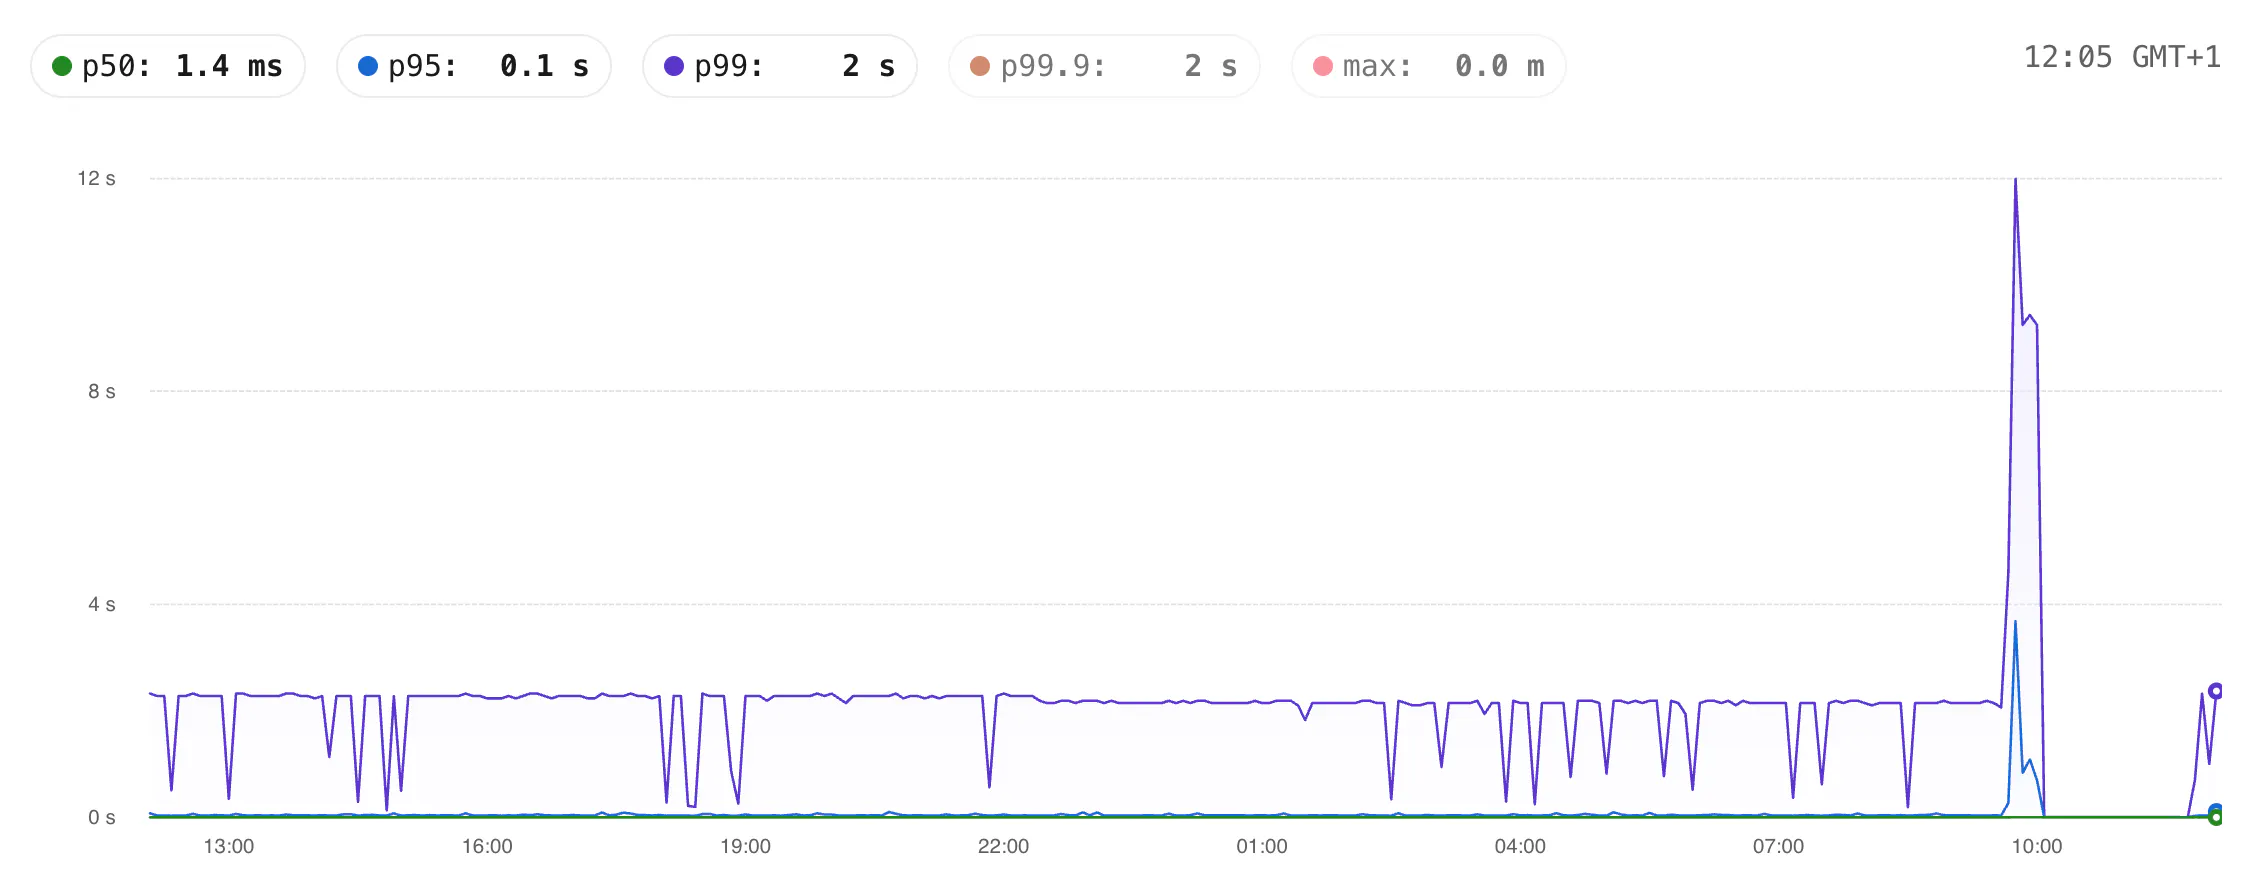
Given this screenshot of Insights from my example application, the tabs at the top show that at 12:05 GMT+1 the p50 is 1.4ms and the p99 is 2s.
Point-in-time performance numbers can be useful, but execution trends over time matter much more to find real, unexpected outliers.
From the graph we can see the p99 is consistently far higher than the p50 and p95, with one huge spike where it got as high as 12s.
Generally, you may think that if "only" 1/100 queries are slow this latency may have a limited blast radius. But if a page load in your application triggers 10s or 100+ queries to your database the impact could be widespread and affect more users than you think.
These slower p99 queries we need to find and resolve. Let's find the guilty parties.
Query list
Below the latency graph, filtered to the same timeline, is a list of queries. From here, you can investigate the performance of each individual query that was run on your database at the same time. There are many columns of data you can read to investigate query performance. Which data is useful to you will depend on what you're debugging.
If you're not sure which numbers to look for, the tabs on the top right have preconfigured columns.
For example, if your database consistently shows high CPU usage, click the "Resources" tab to view CPU usage metrics. You can click any column to sort by that metric.
Since we're looking to fix query latency, we'll click the Performance preset and sort queries by p99 latency (ms).
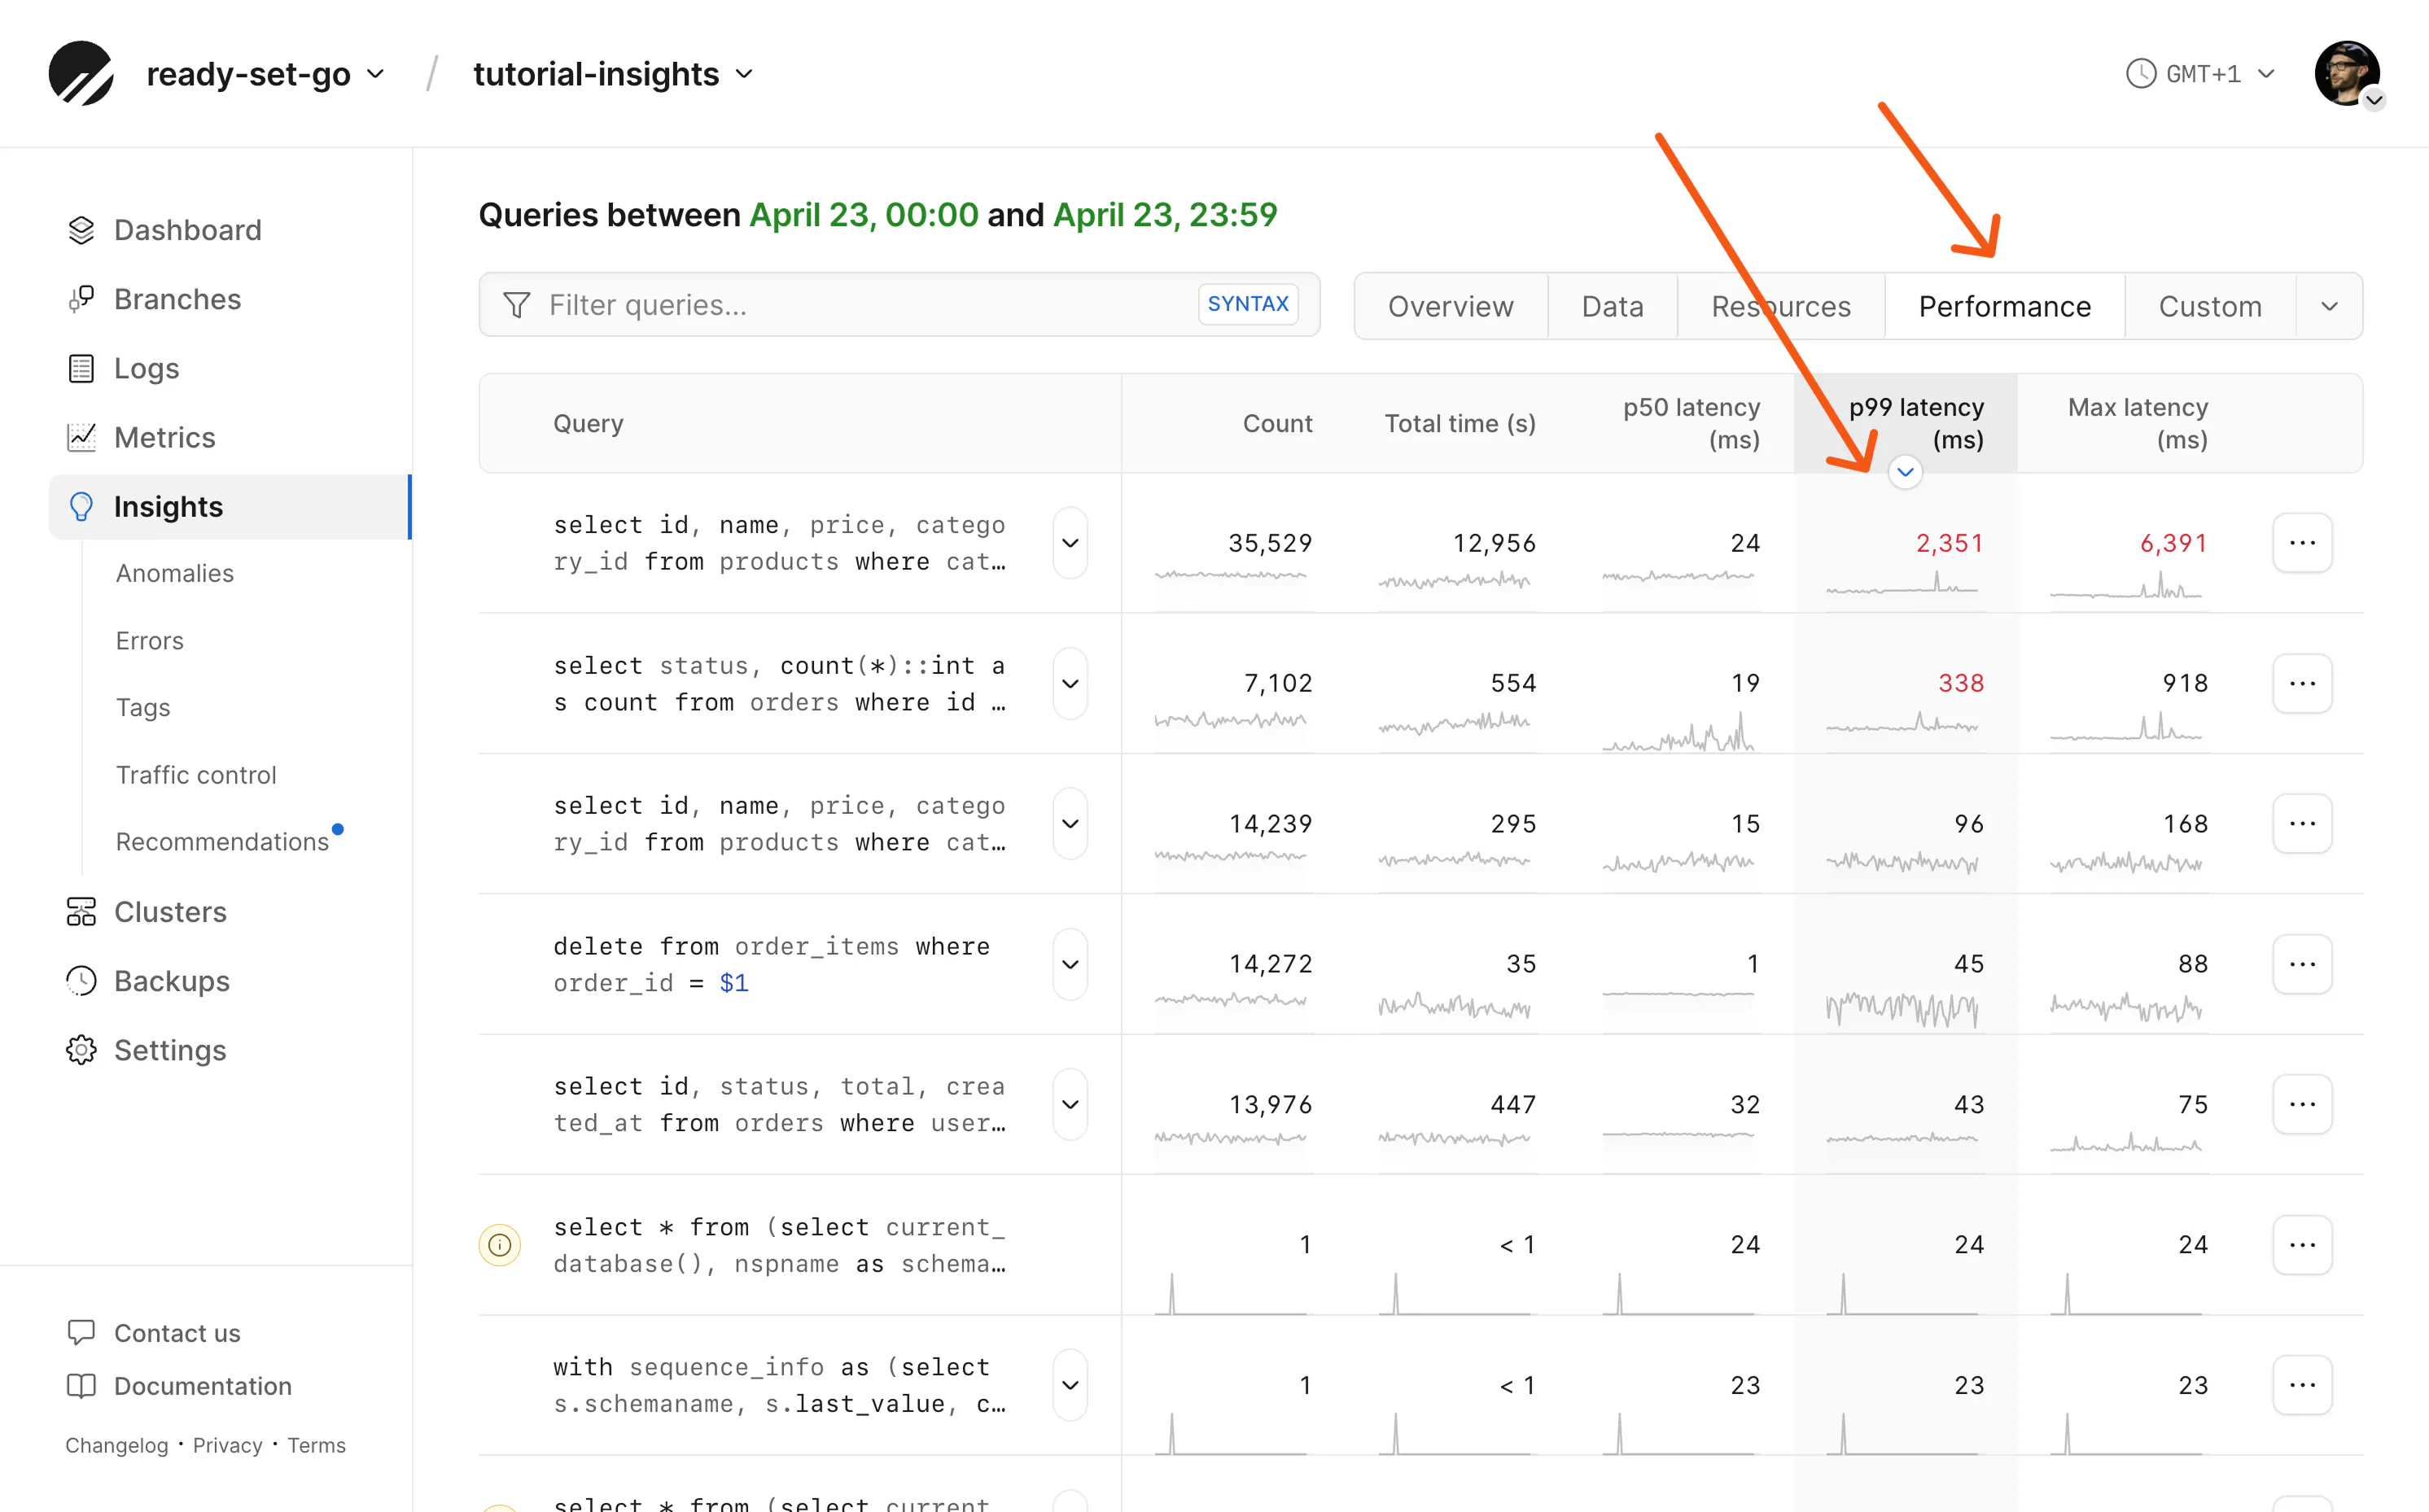
Note that the Performance preset also includes the "Rows read/returned" column; this is often the simplest identifier of slow queries. It contrasts rows the engine had to read with rows actually returned—when reads are high but returns are low, the database is doing a lot of work per useful row, often because of missing or unsuitable indexes. Most often, these queries can be fixed with an index.
Solving the response time issues for some of these queries will be simpler than for others. A number of these queries have a little (i) information icon beside them showing that the queries are being performed without an index and may benefit from one.
(It's also worth noting that some of these queries are slow because they're deliberately bad queries. I needed an exceptionally unoptimized application for this blog post. So, for example, we're not going to "fix" a query for a random product ID.)
Searching for queries
The search box above the query list lets you perform targeted searches for specific queries. You may write part of an SQL query in this box, but there are additional search syntaxes to query by feature, latency, tag, or more. Examples include:
indexed:false— find all queries not using an indexindex:table_name.index_name— find all queries using a specific indexp50:>250— filter by latency thresholdquery_count:>1000— filter by execution counttag:key:value— filter by tag
Clicking the SYNTAX button on the right side of the search box reveals the full set of filters you can use to narrow down your query filtering.
Other graphs
Along with Query latency there are graphs to show other activity trends in your database.
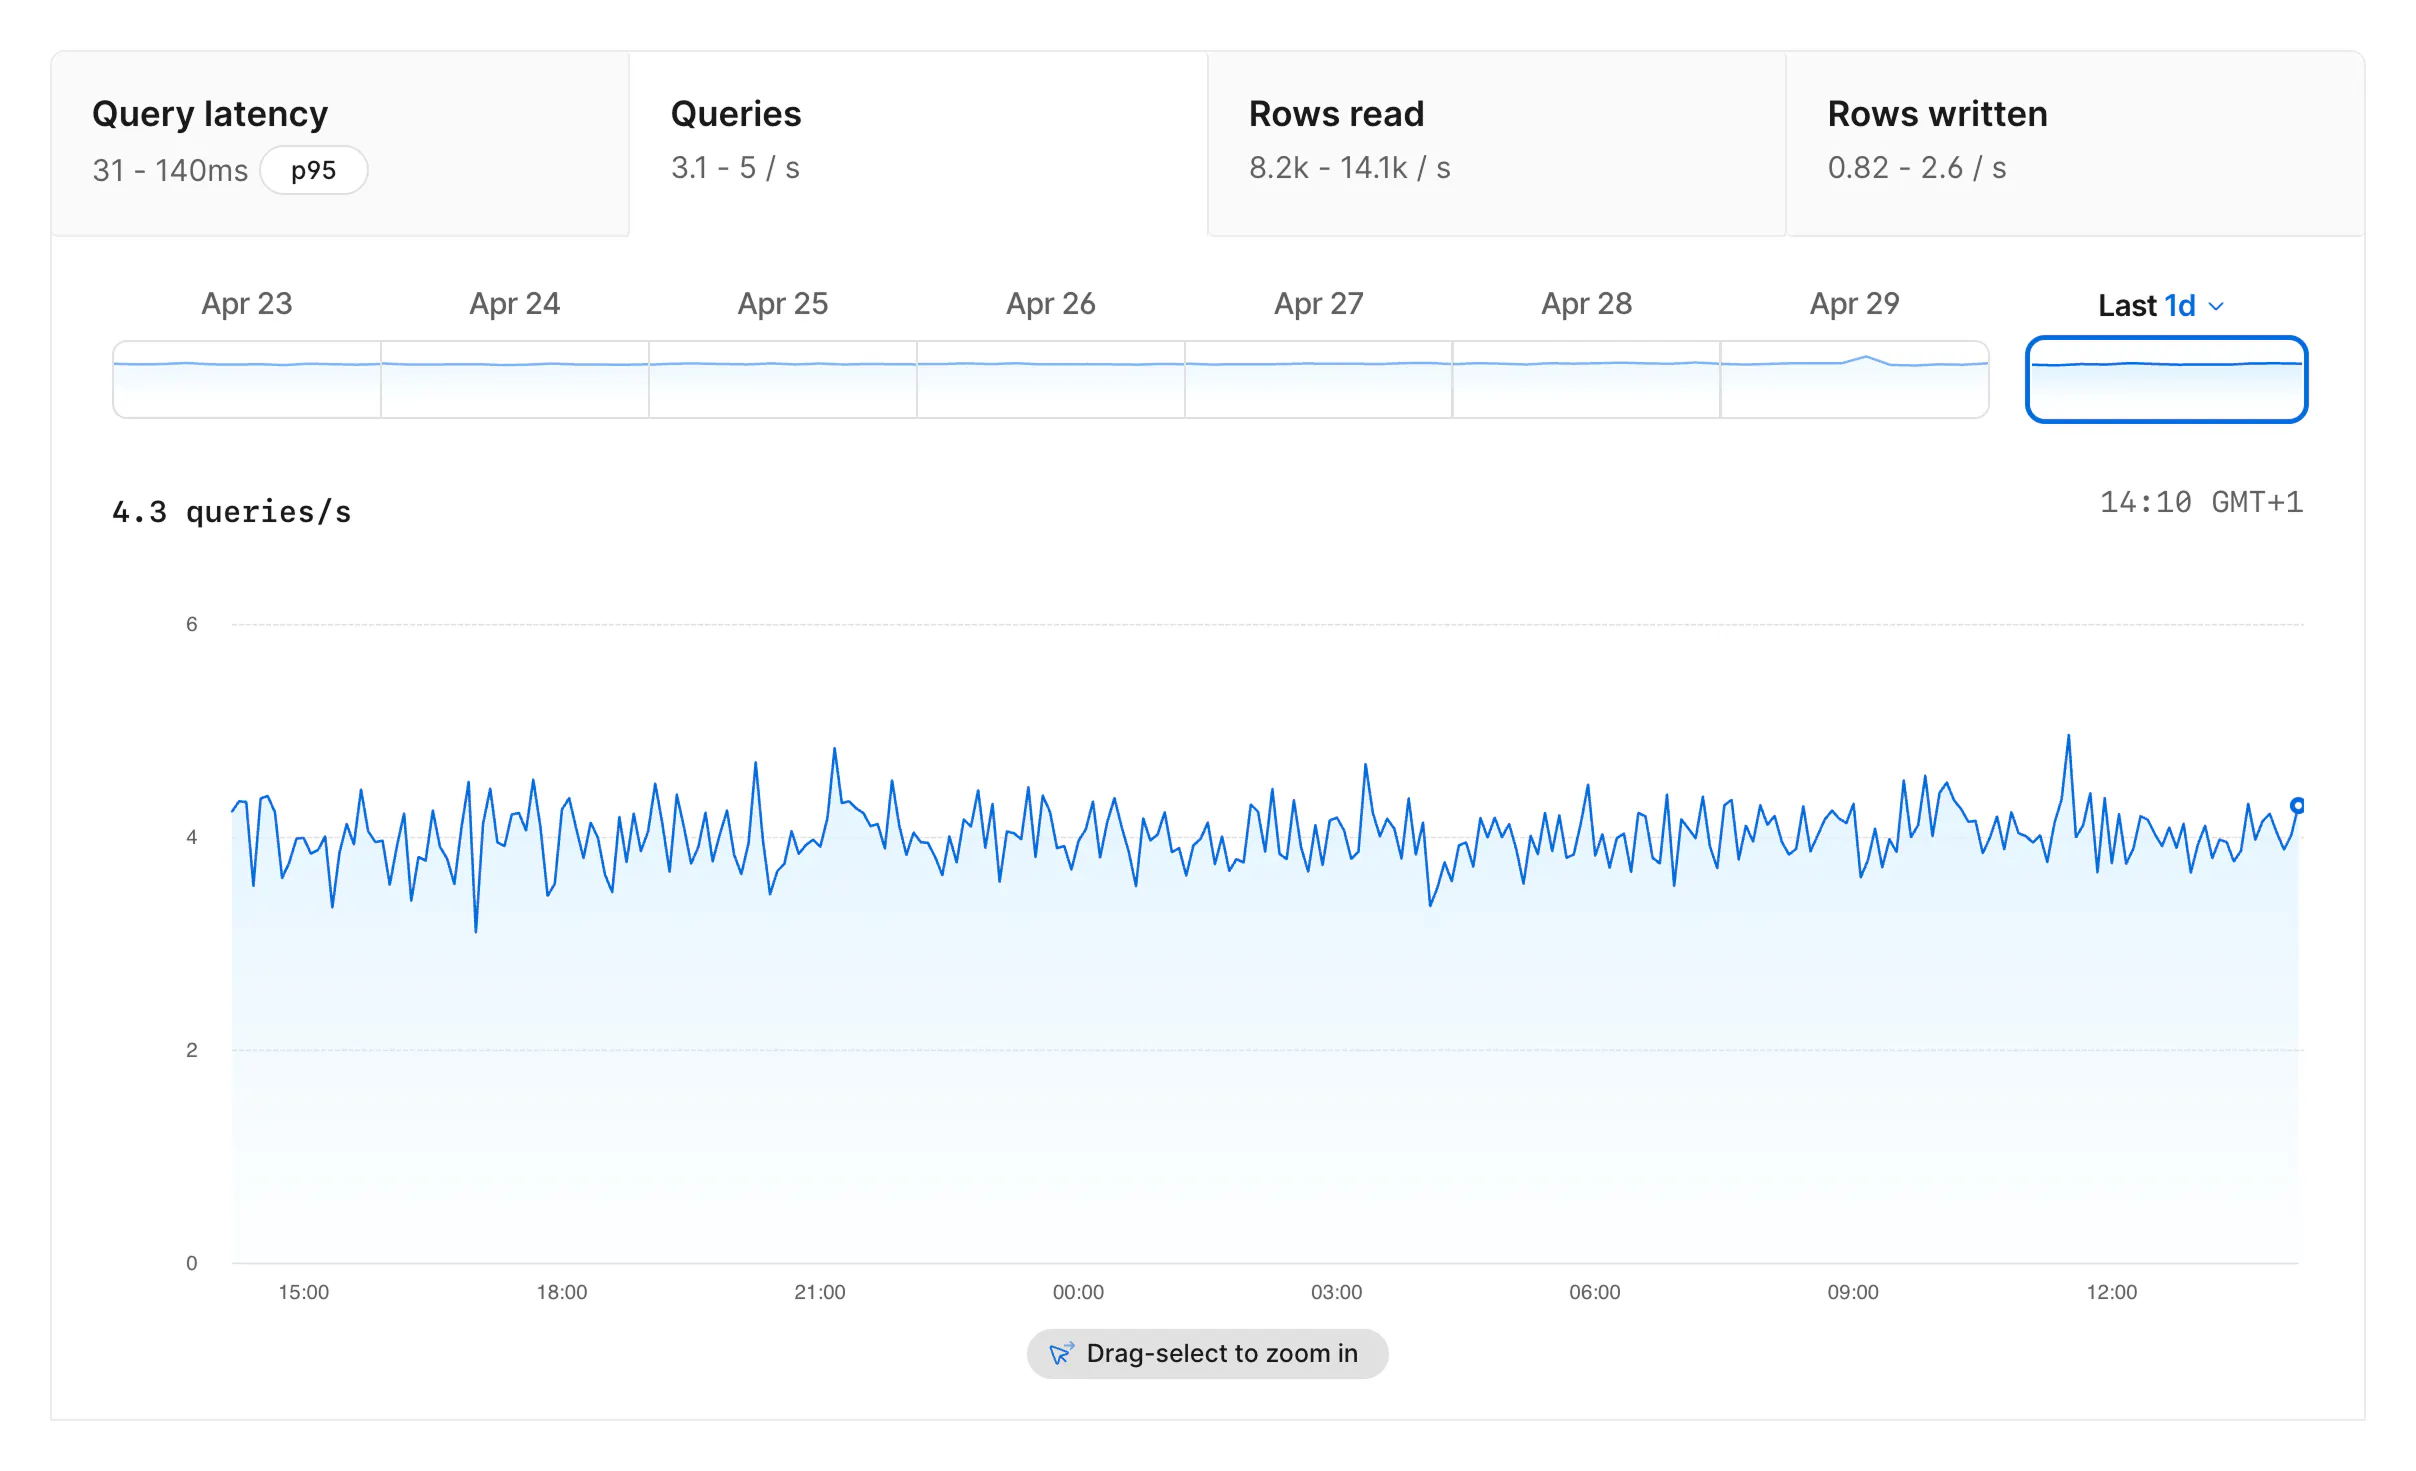
The Queries tab shows total queries per second over time. If latency rises at the same time as query volume, you may be looking at a traffic spike rather than a single query pattern getting worse.
The Rows read tab shows how many rows the database reads per second. High rows read, especially compared to rows returned in the query list, can indicate that the database is reading unnecessary rows and may benefit from a better index.
The Rows written tab shows rows written per second over the selected time period. It gives you a separate view of write volume alongside query latency, query count, and rows read.
Query details
Let's click in to look at an individual query and what Insights can tell us.
If your application writes raw, sensible SQL, your query might look as simple as this:
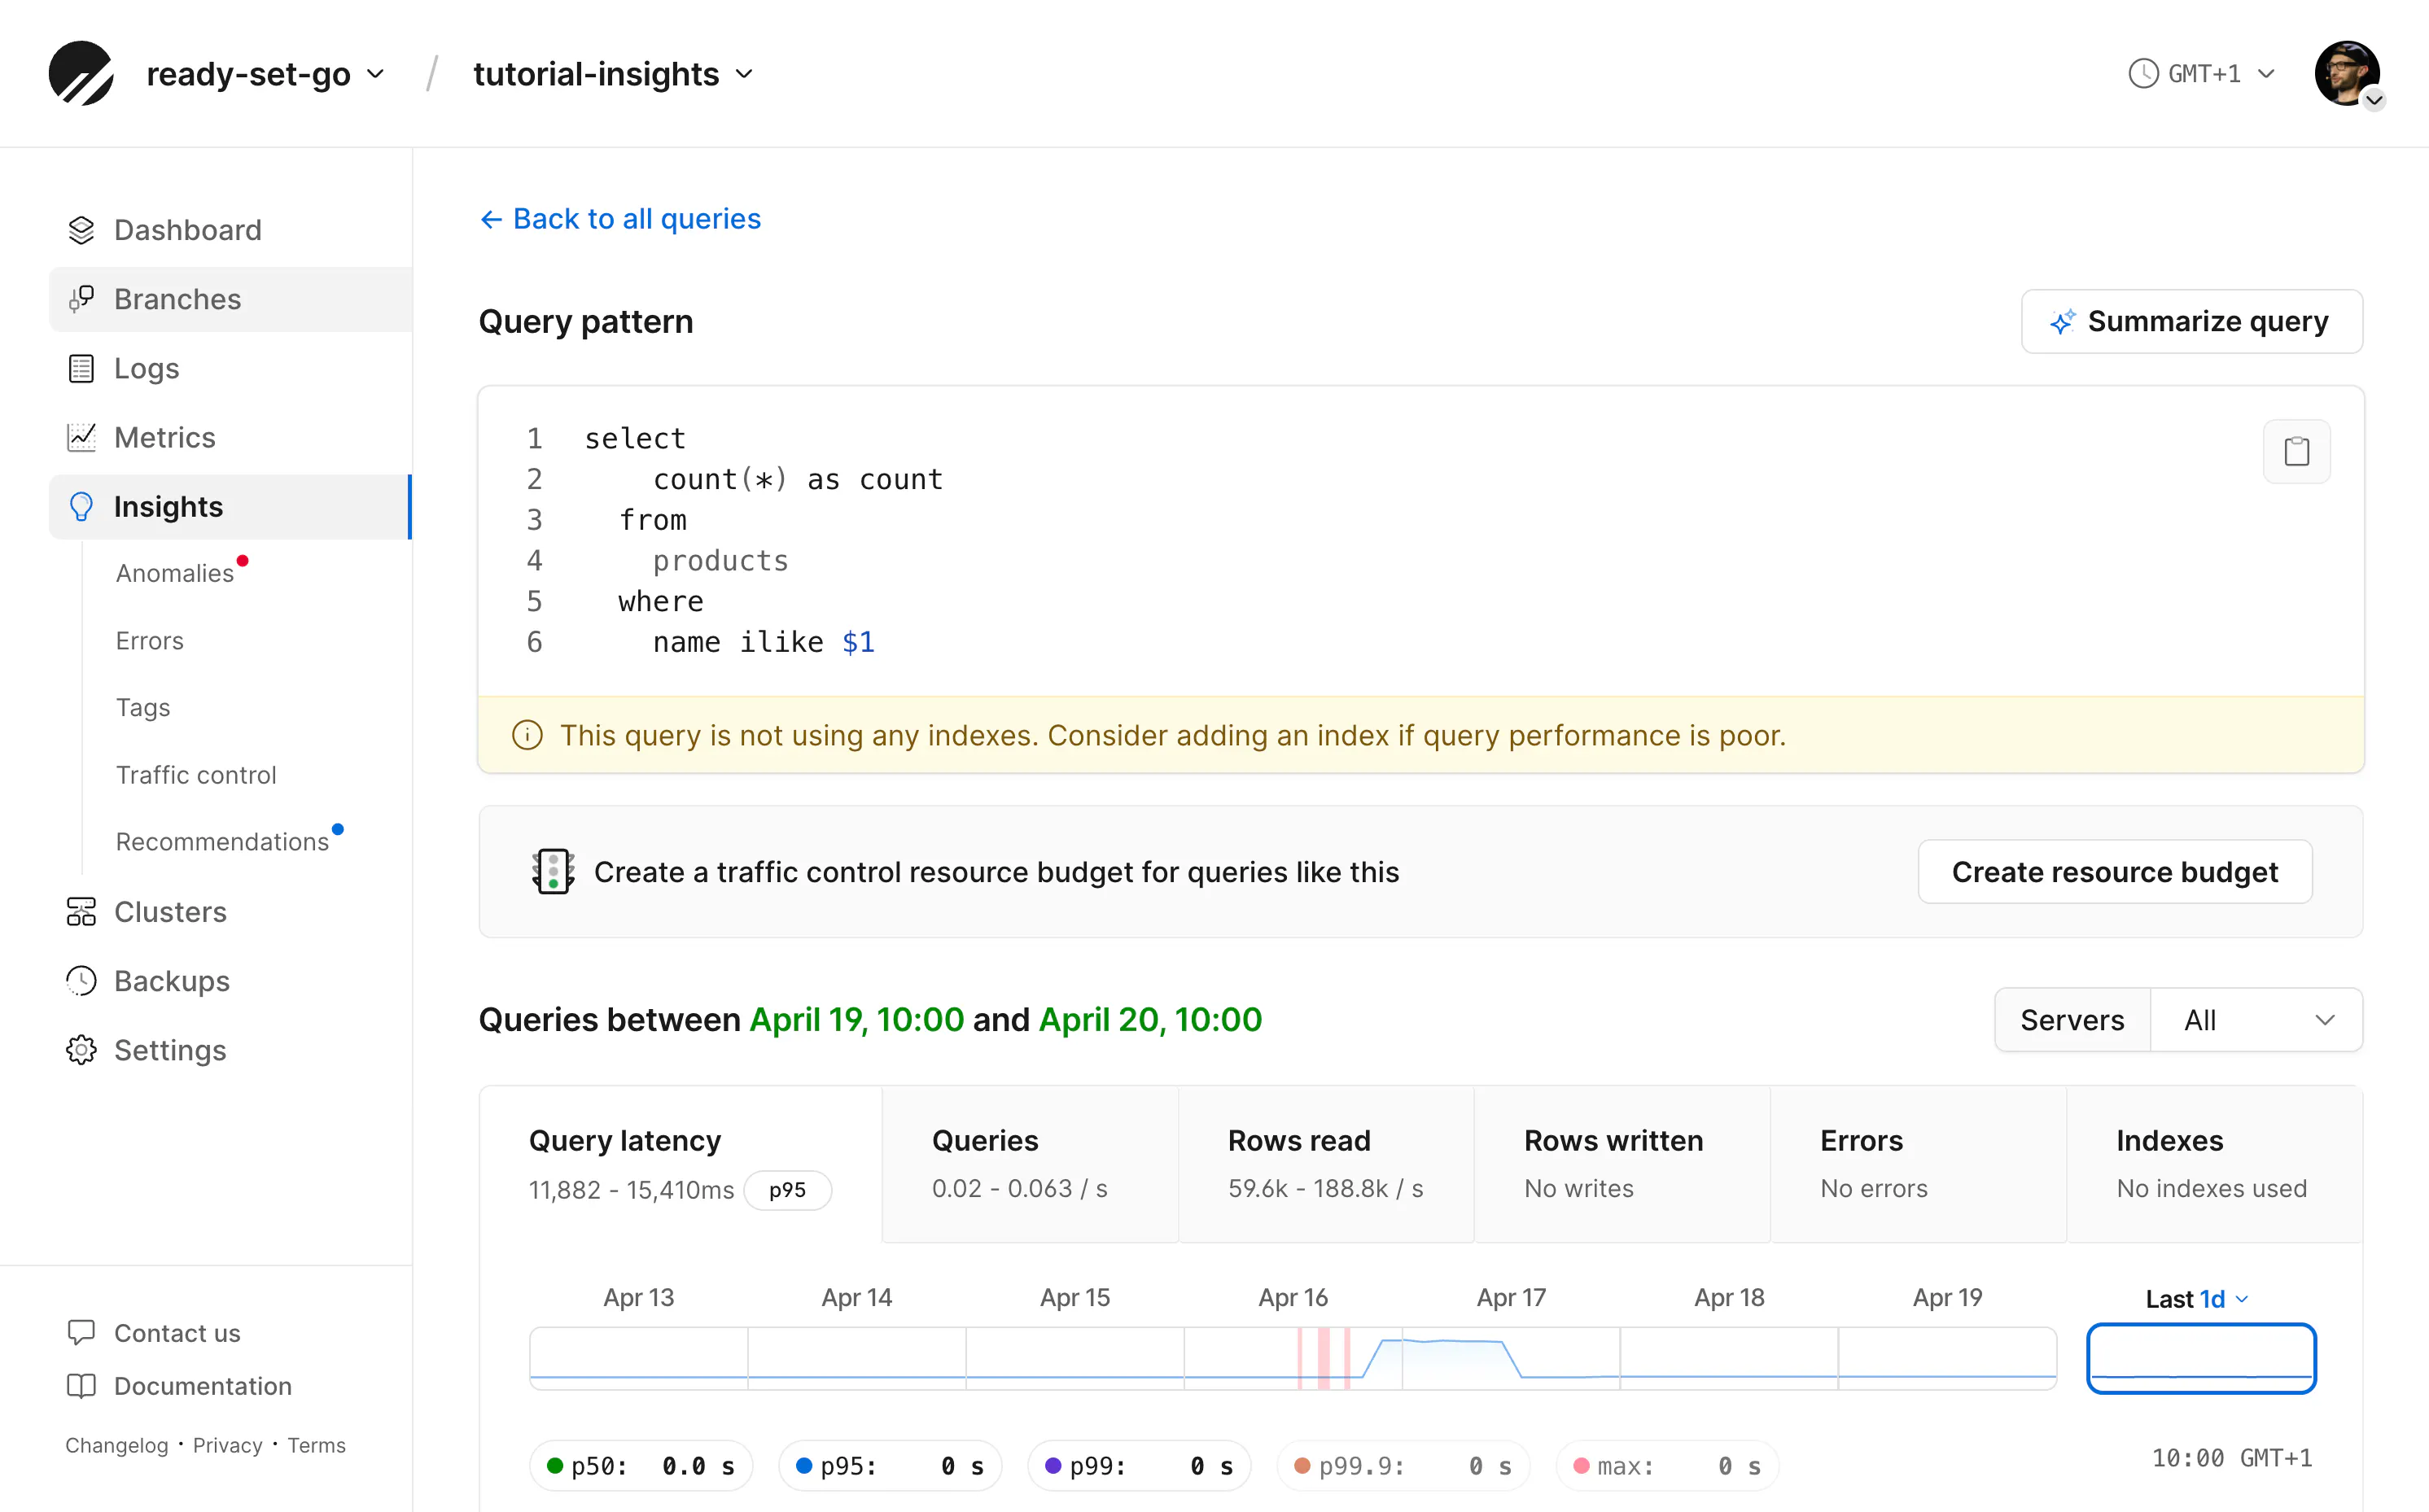
If you're using an ORM, your query could be incomprehensible at first glance. Fortunately, the "Summarize query" button runs the query pattern through an LLM to describe its purpose in plain English.
You may also notice the query has been anonymized. Because parameters in a query may contain sensitive information, they're replaced with placeholders when logged in to Insights. In this instance, the search term %turbo% is rendered as the parameter $1, but it is not visible in Insights.
The page of a query pattern also contains a table of notable queries, individual executions that took longer than 1 second, read more than 10,000 rows, or produced an error. This could help determine whether your query is not always slow and perhaps reveal a common time when it runs slower than normal.
Taking action on a query
On this page, you can see the same performance graphs as the query list page, but isolated to just this one query. In this screenshot, we see a recommendation from Insights to add an index if the performance is poor. A lot of the time, this is a great idea.
Unfortunately, because this query is using a wildcard search, a BTREE index won't help.
If the query were simpler, like below, an index on the name column would greatly improve performance.
select count(*) as count from products where name = 'turbo';
Instead, we may be better off with a GIN trigram index, as they are better designed for wildcard searches. Fortunately, pg_trgm is a supported extension in PlanetScale Postgres, so I was able to experiment with it. It improved query performance, but only slightly.
Often, an index can fix a slow query. Other times, slow queries reveal bad schema or application design. Both are important to resolve; the latter is just a little more complicated, as you may need to rip and replace the query in order to improve application performance.
The most common mistake of a smart engineer is to optimize a thing that should not exist
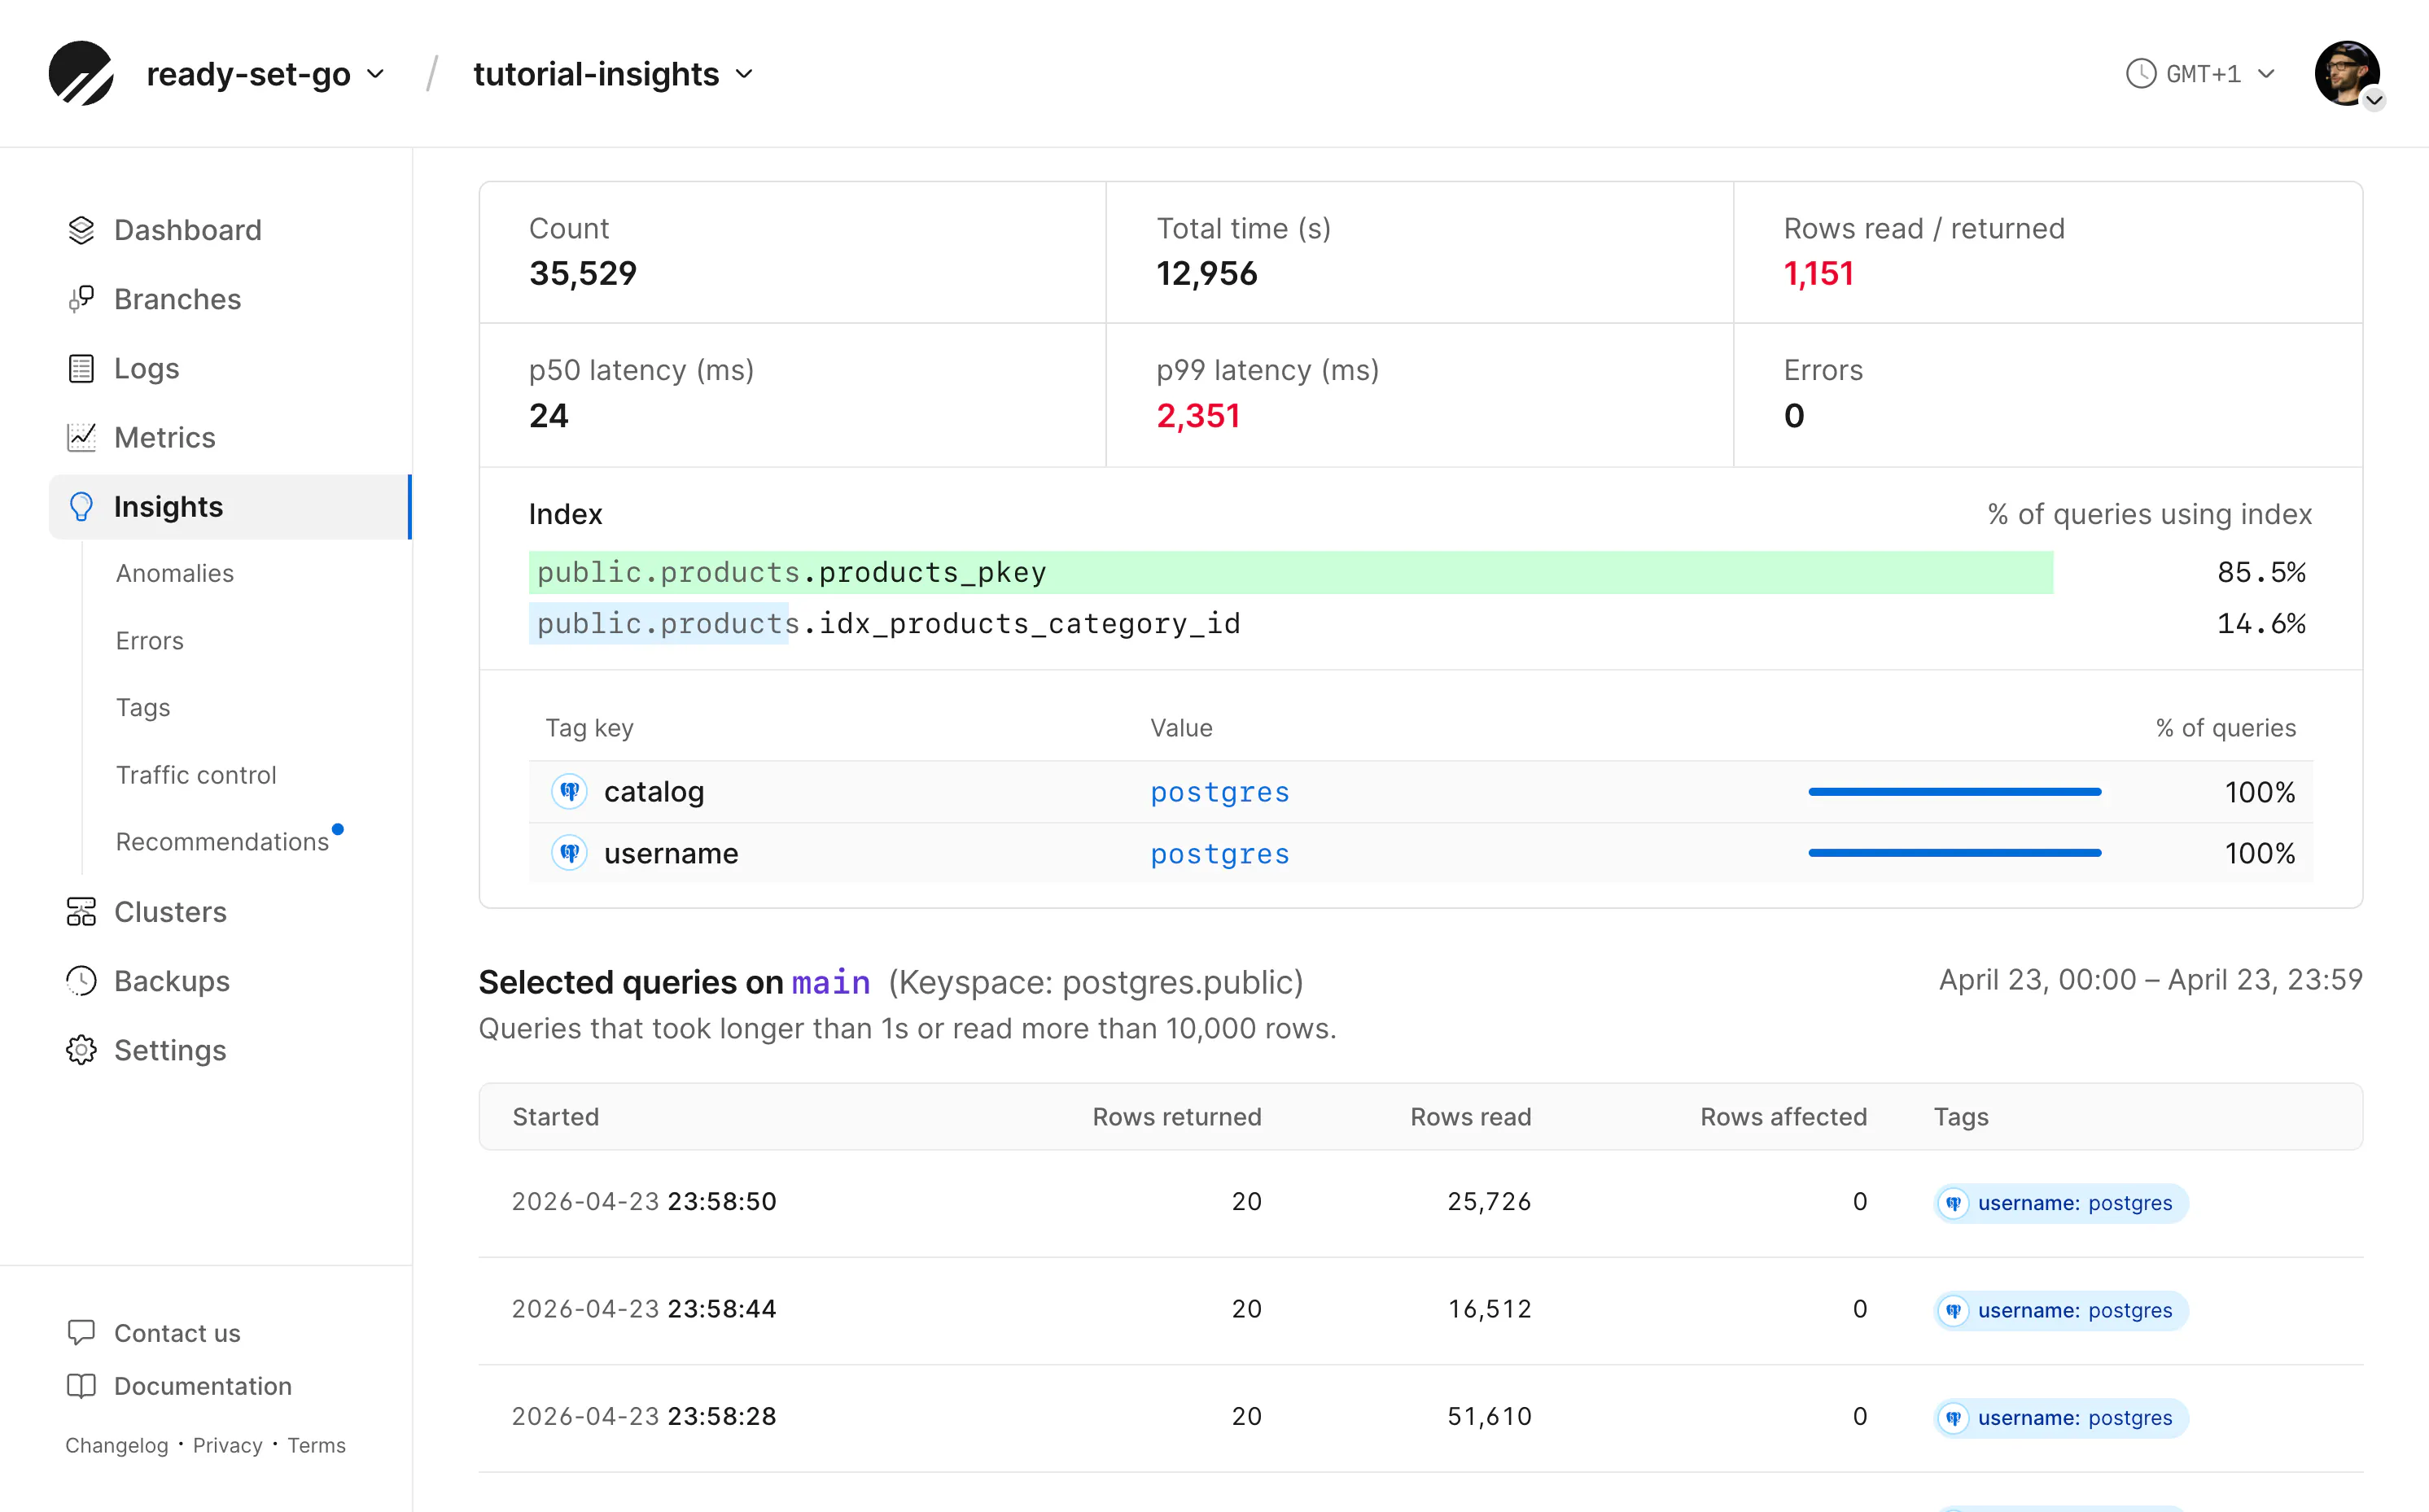
If the selected query is using indexes, statistics are shown below the latency graphs, along with tags attached to that query (more in the section below).
Insights MCP
Fortunately, there's never been a better time to fix complex problems.
The PlanetScale MCP server has access to the same data you're able to browse in the dashboard. This means you can task an agent with finding and suggesting fixes for slow queries within your codebase. With your application as its context and real-world production data available via tool calls to Insights, you no longer have excuses for slow database queries.
At PlanetScale, we have workflows configured to do this daily. See the video below for more details.
In the case of our slow query that can't be fixed with an index, this is a great job for an agent. It can not only read Insights data but also perform queries on its own. While experimenting with indexes on this database, I observed the agent reading the output of EXPLAIN ANALYZE to ensure the index was being used and to report the impact on results.
Consider a prompt something like:
I need you to help resolve a slow database query in this application. Make suggestions on whether we can resolve this by adding an index. If so, let's test the results before and after. Additionally, we may need to rethink the query and consider whether there are more efficient ways to obtain the same data to improve application performance.
To help keep your agent focused, include the details of the PlanetScale database in your application's AGENTS.md, for example:
## PlanetScale

- Organization: ready-set-go
- Database: tutorial-insights
- Branch: main
Note
MCP permissions are set when you authenticate the server. It is not advised to give an agent write access to your production database.
So far, we've looked at identifying queries by grouping together the slow ones. There are other reasons to group queries together, though, which can help with debugging as well as improve performance.
On the Tags page, we can see queries grouped by metadata related to them. There are built-in key-value pairs, such as the application name and remote address of the connection that ran the query.
Custom metadata can be included with queries as SQLCommenter comments. Not all ORMs support comments; check your documentation if you are not writing raw SQL.
select count(*) as count from products where name ilike '%turbo%'
/* application='store', action='search' */;
These comments are then logged as key-value pairs as queries are performed, allowing you to investigate the performance of a specific subset of queries based on their application, intention, and more.
So if you're not debugging "why is this query slow," but instead "why is this section of the application slow," you might benefit from grouping that section's queries with the same tag.
For more on tags, see Enhanced tagging in Postgres Query Insights.
Tags are also the backbone of Traffic Control, the killer app of PlanetScale Postgres.
Traffic Control
Some slow queries are unavoidable. We've already determined that our application has a slow query that can't be easily fixed with an index. One option is to remove it entirely in favor of something else. An alluring third option is to put controls on how many resources the query can actually use.
Traffic Control allows you to do just that. Where timeouts in Postgres can be used as a blunt instrument to stop queries running over a certain time, Traffic Control gives you fine-grained control over how many resources a query can consume, as well as controls over concurrency and more. Perhaps our slow search query actually only runs from an admin panel.
So it's less of a concern that a single query is slow, but more of a concern if multiple administrators run it concurrently and bring down the database's performance.
The same tags we applied to observe a category of query behavior can have "resource budgets" applied to them to limit the amount of resources they are permitted to consume.
Insights now identifies slow queries, recommends improvements, and controls whether they can run at all.
See more in the Traffic Control documentation.
Continual improvement
So far, we've covered manual performance investigation. You and your agent are digging through Insights for improvements. As your application runs, Insights also gathers its own data on anomalous behavior and preemptively suggests upgrades.
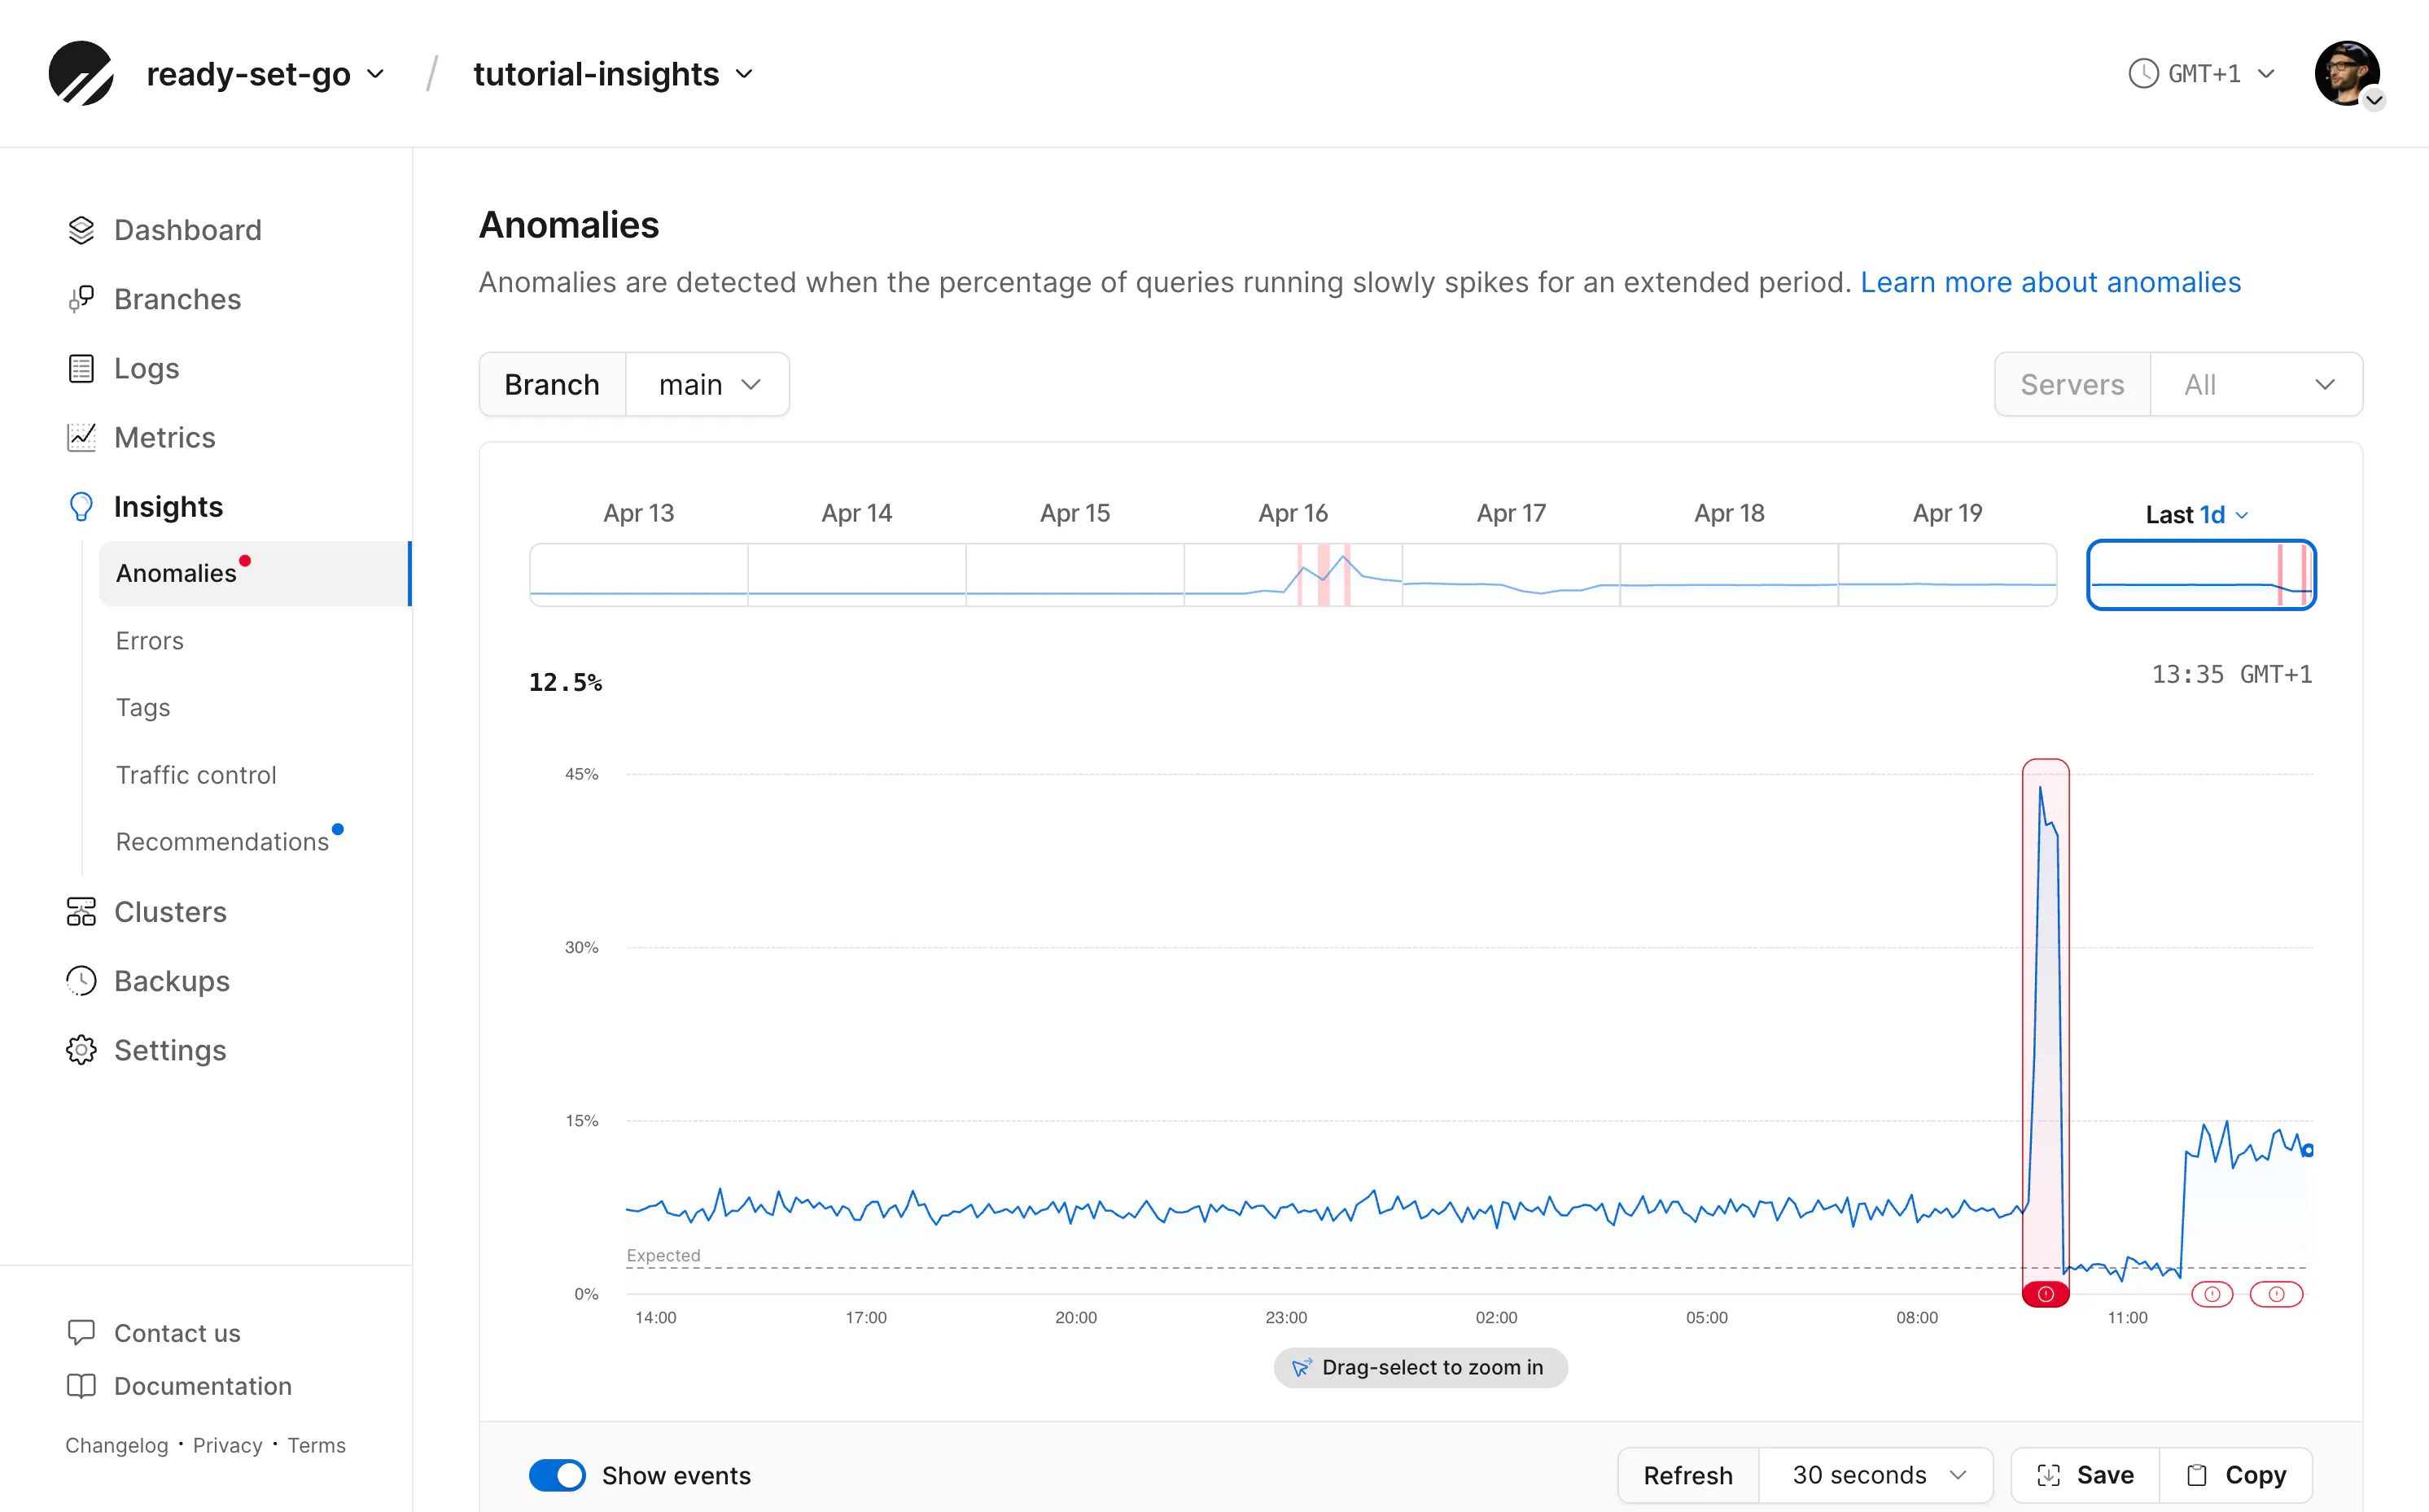
The Anomalies page highlights when database performance is well outside the expected range. This can reveal unexpected query patterns, traffic spikes, or other problems with your database.
If you have an anomaly in your Insights dashboard, you can click in to see more details about the time of the anomaly and which queries contributed to it. Match this timeframe against any other application logging platforms you have to identify the root cause. It could be an unexpected one-time outlier, or it could be the result of recently updated application code, and is likely to repeat.
Learn more in the Anomalies documentation.
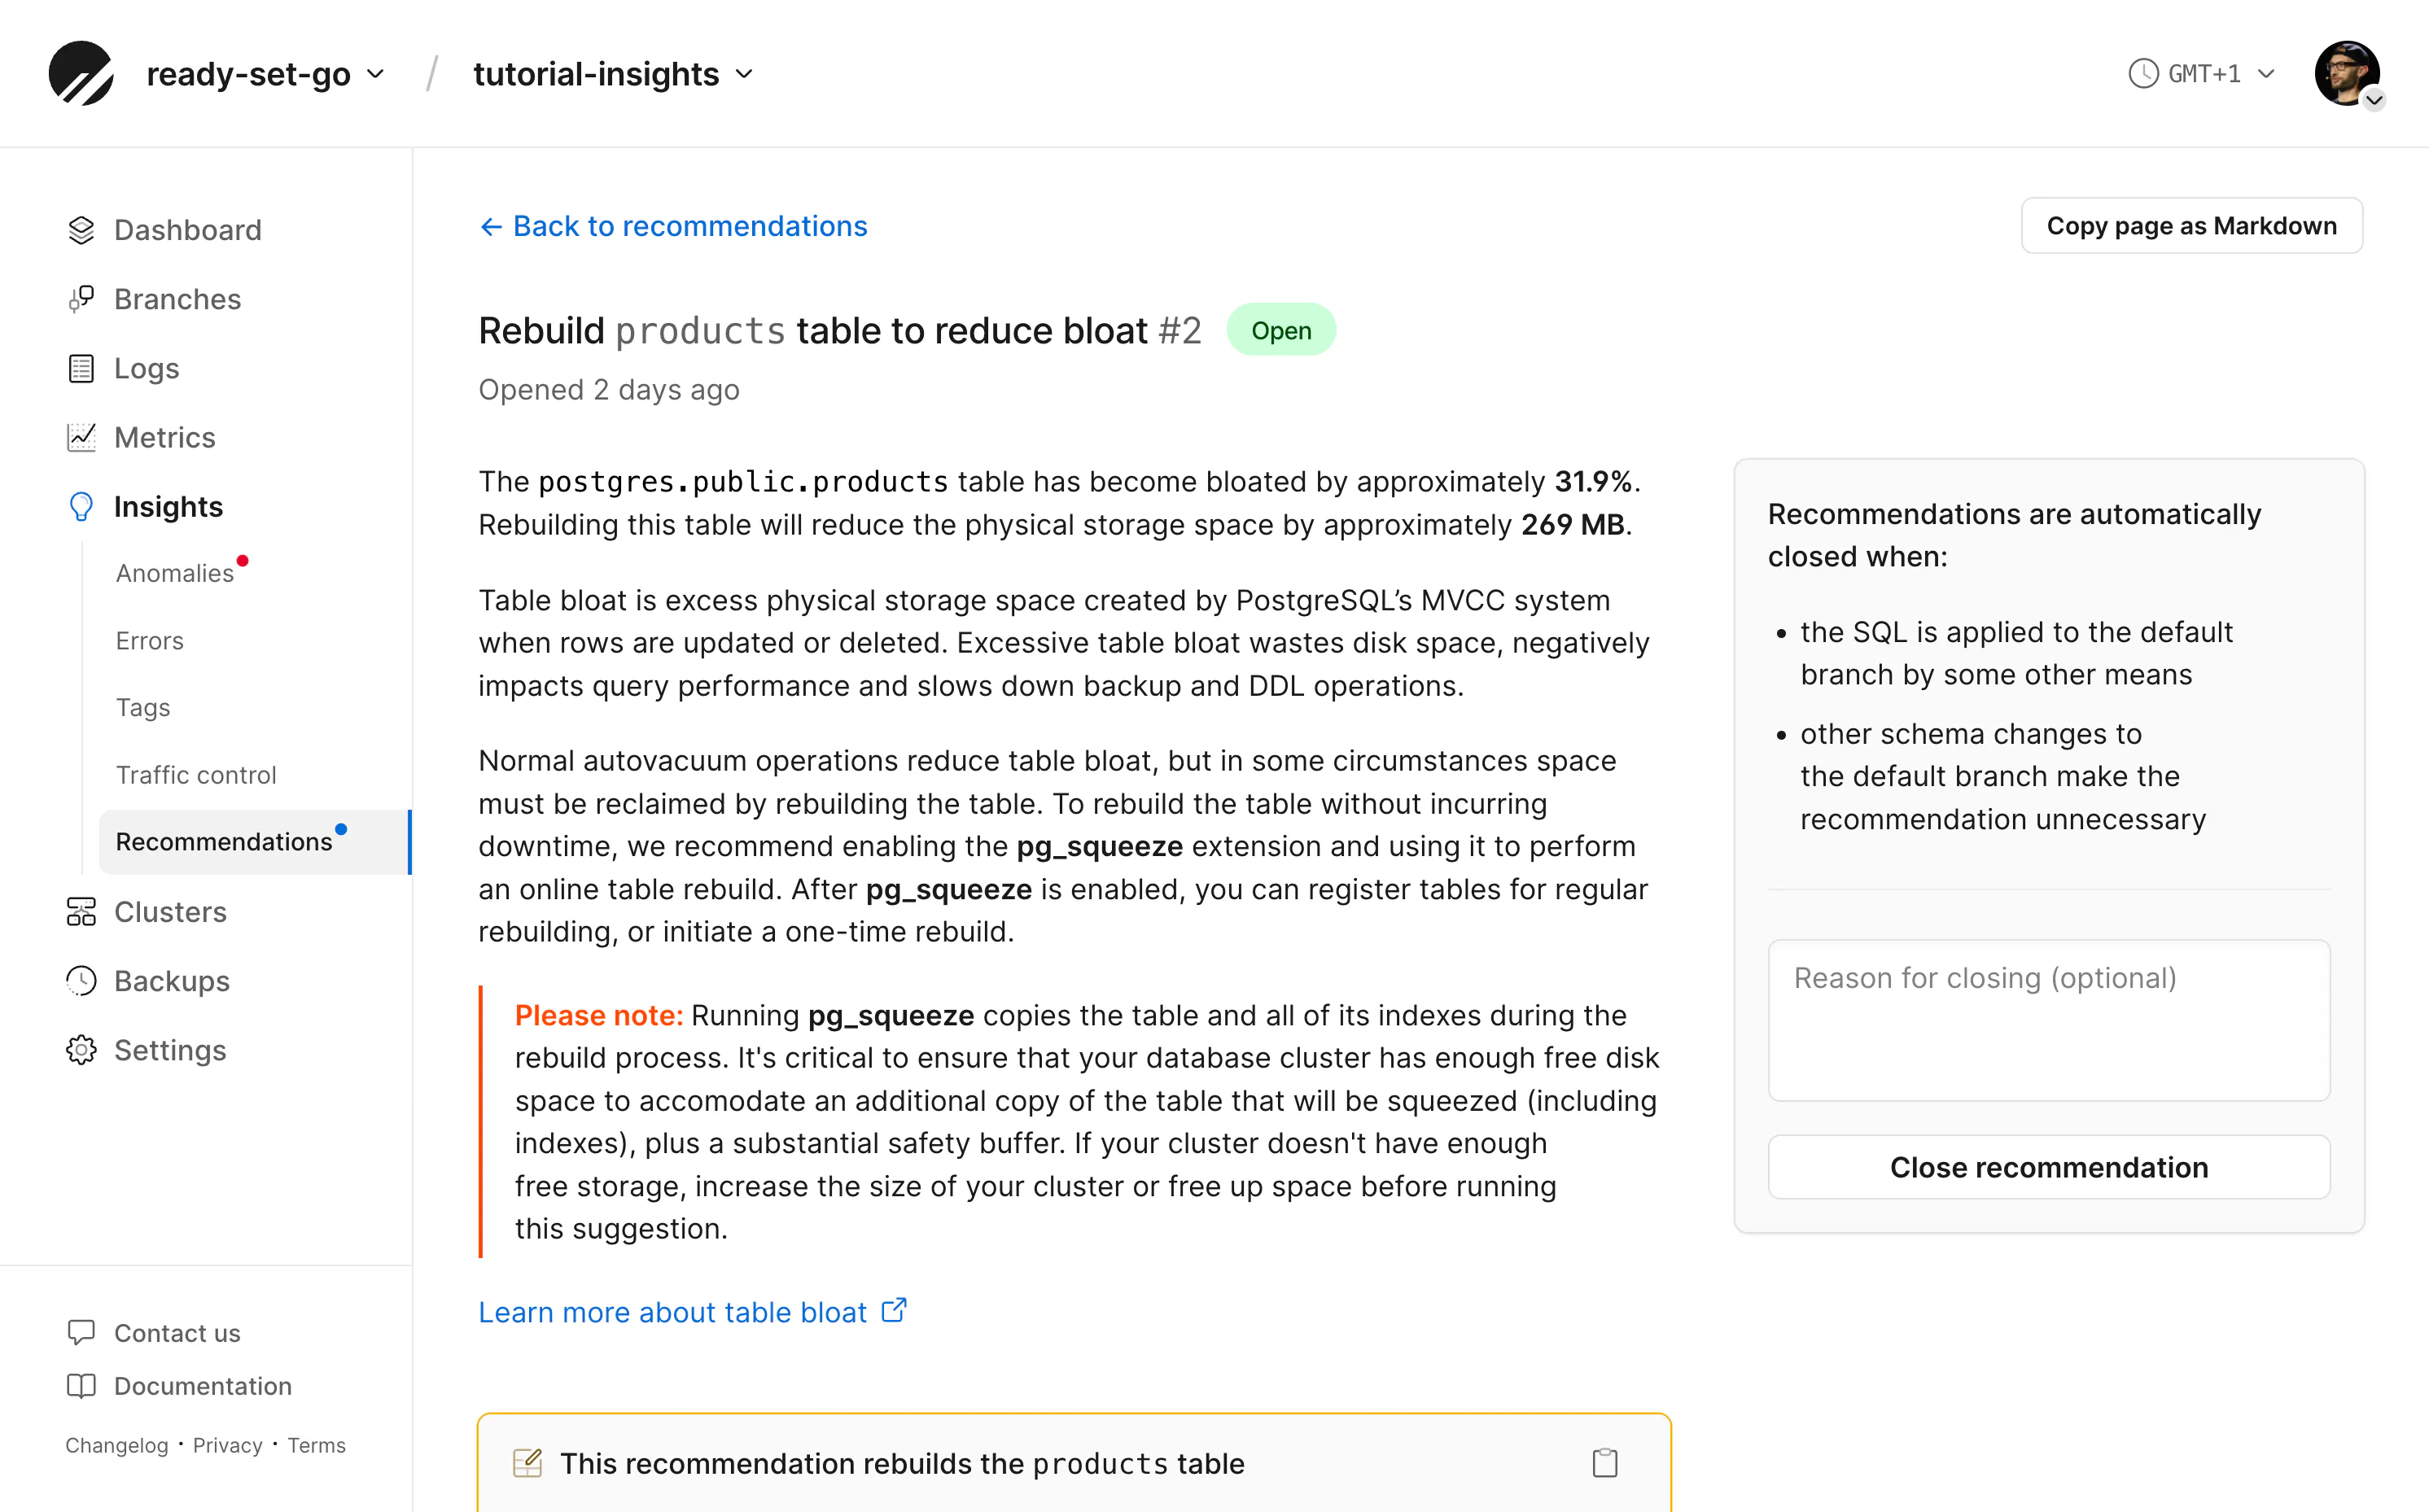
Insights also monitors traffic to regularly produce schema recommendations. These may include the index suggestion we saw earlier, or other helpful tips to potentially improve the health of your database.
Recommendations typically include SQL statements you can run in your database to take action.
Both the Anomalies and Recommendations data found within Insights are available from the PlanetScale MCP server if you would like an Agent to help you decide whether to take action on the database.
Error tracking
Slow queries aren't the only problem Insights can surface. The Errors page captures every database error from the past 24 hours and plots them on a timeline, letting you spot patterns you'd otherwise miss in application logs.
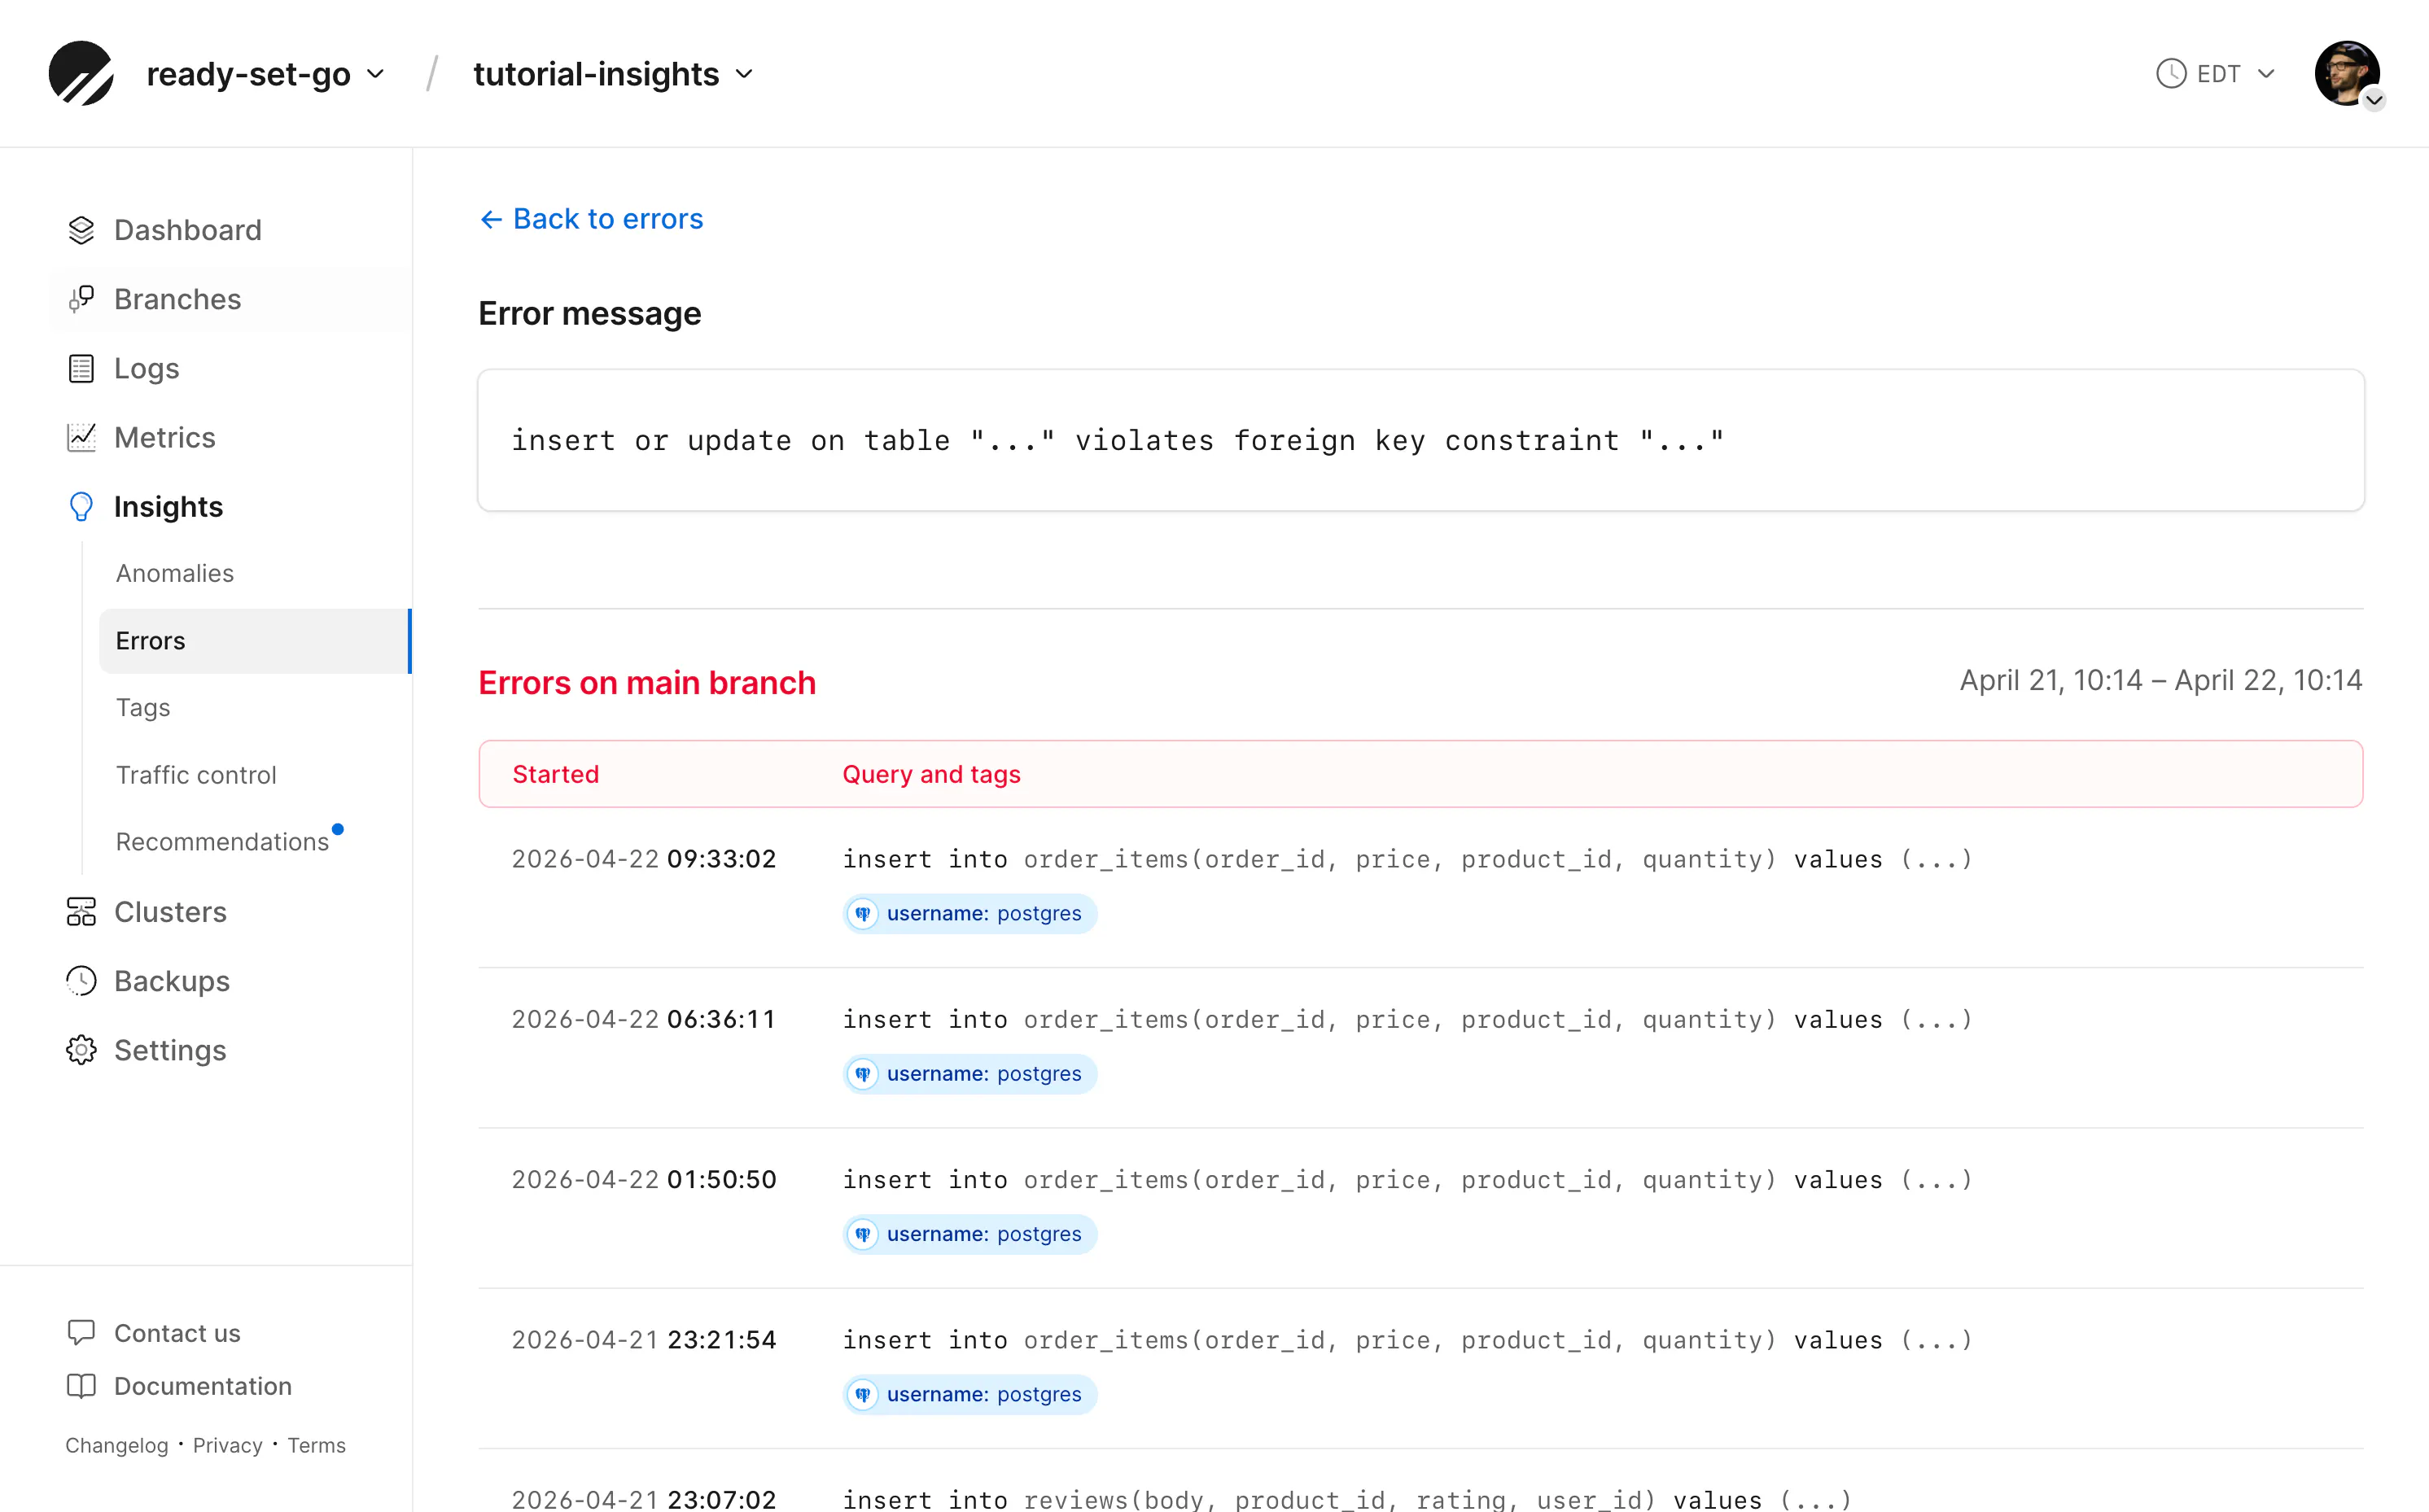
In my demo store, I simulated a retry storm during checkout — a flaky network that caused the same order to be submitted multiple times with the same idempotency key. The errors tab immediately surfaced the duplicate key value violates unique constraint message on the orders_idempotency_key_key index. Clicking into it revealed each occurrence: the exact query, when it ran, how long it took, and the tags I'd attached to identify the checkout action. From there, I could see the errors clustered in tight bursts, a telltale sign of retries hitting the same unique constraint rather than a systemic problem.
This is the kind of issue that often goes unnoticed. The application catches the exception, retries successfully, and the user never sees a failure — but the database is doing unnecessary work. The Errors page makes these invisible problems visible.
Conclusion
PlanetScale Insights is the best way to see how your database actually performs in production, providing you and your agents with the metrics that matter to improve your database schema, queries, or completely change access patterns.
In a future article, we'll look at how to inspect common database problems by viewing specific metrics in Insights. If there's an issue with your queries you can't yet get to the bottom of, let us know!