








前几天在部署一套环境的时候,涉及nginx这块,当时以为分分钟搞定,没相对还费了好些功夫,甚至以为是nginx的bug了。
我先上个图:
我们有个校企合作的项目,由于项目的参与方涉及学校学生,网络因此是单独划了一个区域,就相当于一个独立网段,里面有学生办公pc、linux服务器等等。我们这次组里开发了一个小的前后端分离项目,开发完了后,我就准备部署。
部署的话,我是通过类似于windows远程桌面的机制(实际是某厂商的VDI,相比于windows远程桌面,应该是多了更多文件进出的管控机制,比如没权限的话,远程主机里的文件默认是拷贝不出来的)。
通过远程桌面进入远程windows后,在里面再ssh连接linux服务器,在上面部署nginx、前端包,由于服务器有限,直接把后端spring boot包也是部署在了这一台机器上,架构如下。
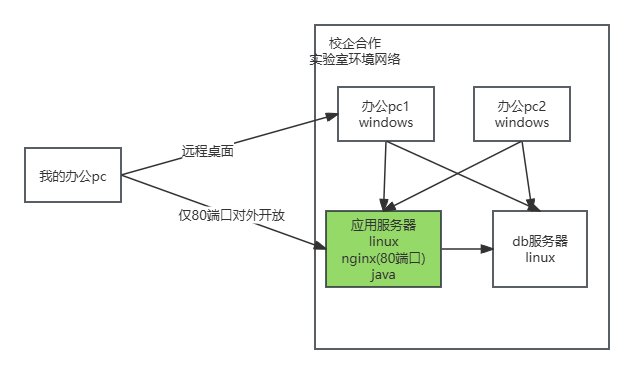
刚开始部署完成后,应用服务器上(假设ip为1.1.1.1)的nginx,监听80端口,那么,在远程windows上的浏览器,是可以访问:http://1.1.1.1:80来打开系统的,但是,在我的办公pc上不行。
由于这种一般是需要给领导演示的,那自然要把1.1.1.1:80端口暴露出来,让办公pc网络可以访问。为了安全起见,这种一般只开放必要的端口,如上面就只开放80端口。就像我们平时系统对互联网仅开放443端口一样。
由于版本刚开始不稳定,自然是会发现一些bug,发现bug就需要看日志,我们这边看日志还是比较原始的,也没搞什么elk这类。spring boot服务的日志,就在上述的1.1.1.1这台服务器的特定目录下,我就想着,通过80端口,nginx里面再配个location,把log暴露出来,方便组内同事看日志,应该更方便一些。
原始的nginx配置如下,就一个前后端分离的配置:
server {
    listen 80;
    server_name localhost;
    location / {
        root /usr/local/nginx/html/quantify-trade-platform-frontend/dist;
        index index.html  index.htm;
        try_files $uri $uri/ /index.html;
    }
    location ~ /quantify-trade-platform-admin {
        proxy_pass http://localhost:8093;
   }
}
我们java服务呢,日志是在:
/opt/quantify-trade-platform-admin/quantify-trade-platform-admin-0.1-SNAPSHOT/logs
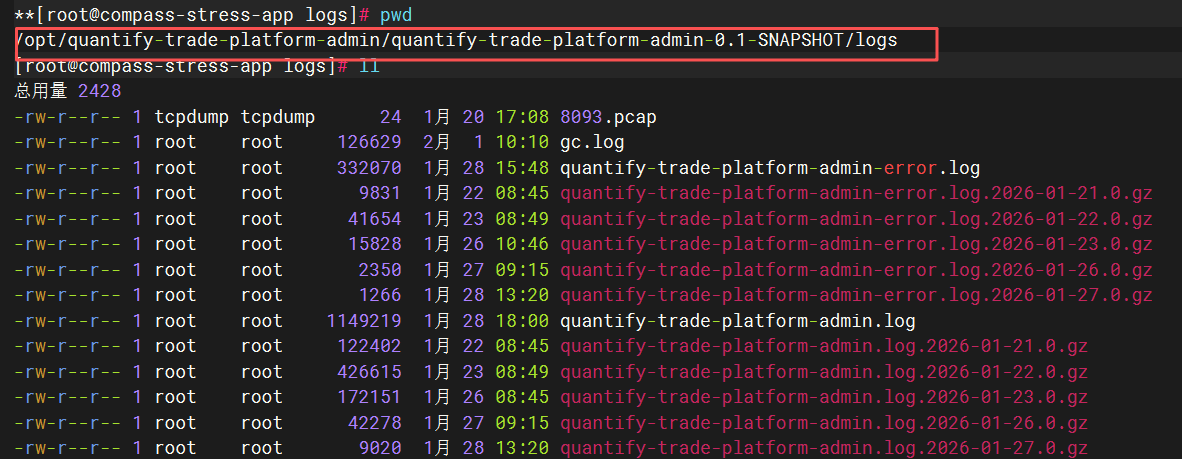
所以,我就加了一段配置:
    location /mylog/ {
      alias /opt/quantify-trade-platform-admin/quantify-trade-platform-admin-0.1-SNAPSHOT/logs/;
      autoindex on;
    }
完整如下:
    server {
        listen 80;
        server_name localhost;
        location / {
            root /usr/local/nginx/html/quantify-trade-platform-frontend/dist;
            index index.html  index.htm;
            try_files $uri $uri/ /index.html;
        }
        location ~ /quantify-trade-platform-admin {
            proxy_pass http://localhost:8093;
        }
		-- 新增如下:
	    location /mylog/ {
	      alias /opt/quantify-trade-platform-admin/quantify-trade-platform-admin-0.1-SNAPSHOT/logs/;
          autoindex on;
        }
   }
加好后,我试了下, http://1.1.1.1/mylog/ ,可以正常访问:(实际上,折腾这个autoindex这个location,也花了不少时间,要不要加/之类的)
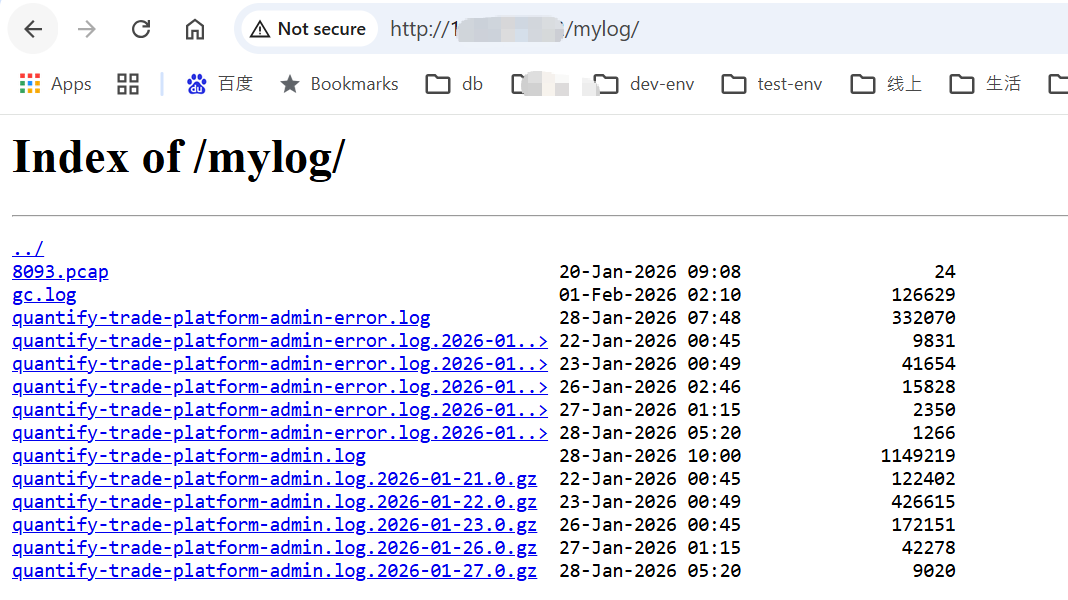
但是呢,我在点击里面的文件的时候,发现报404:
http://1.1.1.1/mylog/quantify-trade-platform-admin.log
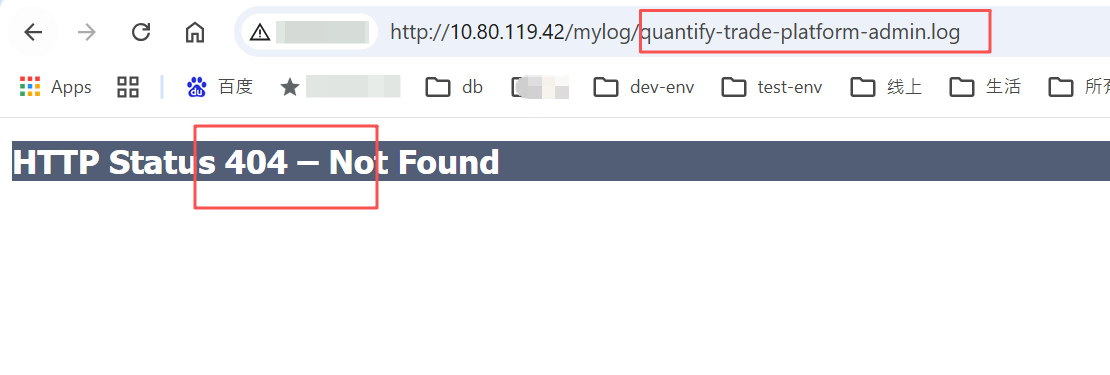
这个问题把我折腾的够呛,我一直以为是我autoindex这块,是不是哪里配置没对,就这个地方,反复折腾,反复折腾:
location /mylog/ {
  alias /opt/quantify-trade-platform-admin/quantify-trade-platform-admin-0.1-SNAPSHOT/logs/;
  autoindex on;
}
快下班的时候,我发现如果我把admin改成amin、adin,就拼错一两个字母,就能下载下来了。当时以为,是autoindex这种静态文件机制,会不会是为了安全考虑,文件名匹配到admin这个关键字啥的,就404.
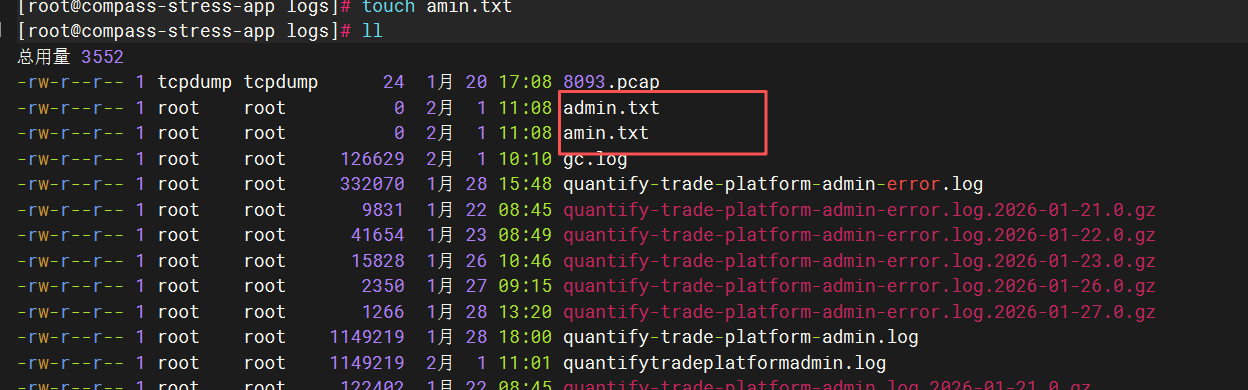
但后面,我把log拷贝一下,去掉中间的中划线,也可以下载下来:
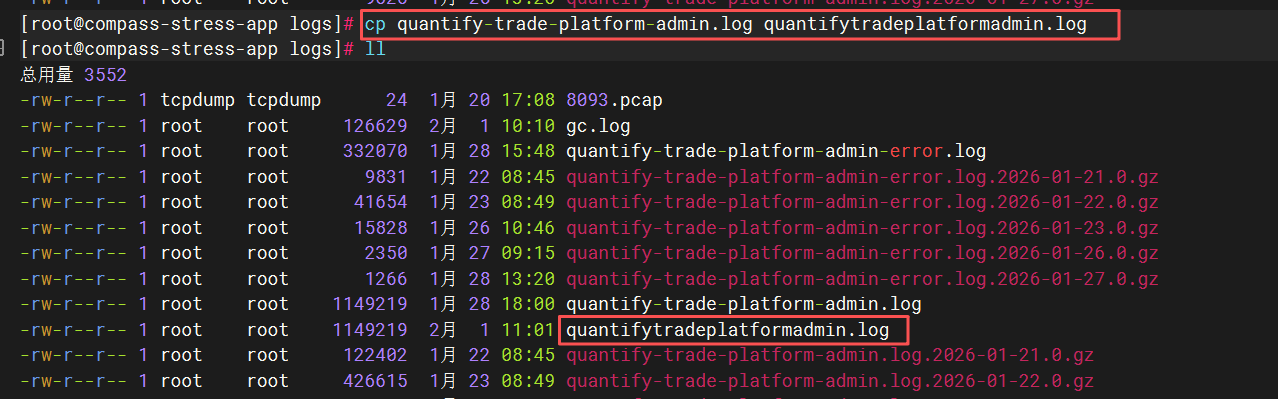
然后网上一顿乱搜,看看是不是中划线导致的问题啥的,或者是因为含有admin关键字导致的,结果都没查到有人遇到这种问题。
一顿搜索猛如虎,以为是nginx的什么小bug(当时感觉autoindex这种静态文件机制,可能用的人少,是不是有啥小bug正好被我撞见了)
第二天早上来了后,找了台服务器,新搭建,结果发现admin.txt可以正常下载,为啥在那台机器上就不行呢?
我想起来strace命令,那就看看有没有线索吧:
strace -p 121920 -s 1000 -t -e trace=network,file,desc,process
结果请求http://1.1.1.1/mylog/quantify-trade-platform-admin.log 时,发现信息显示出:发起了socket操作,请求了springboot服务的端口。
当时很奇怪,第一次还没放到心上,然后复测了一遍,发现还是这样。然后就哟tcpdump抓了个包,咦,这个日志文件的请求怎么被发到后端服务去了。
然后再一看location:
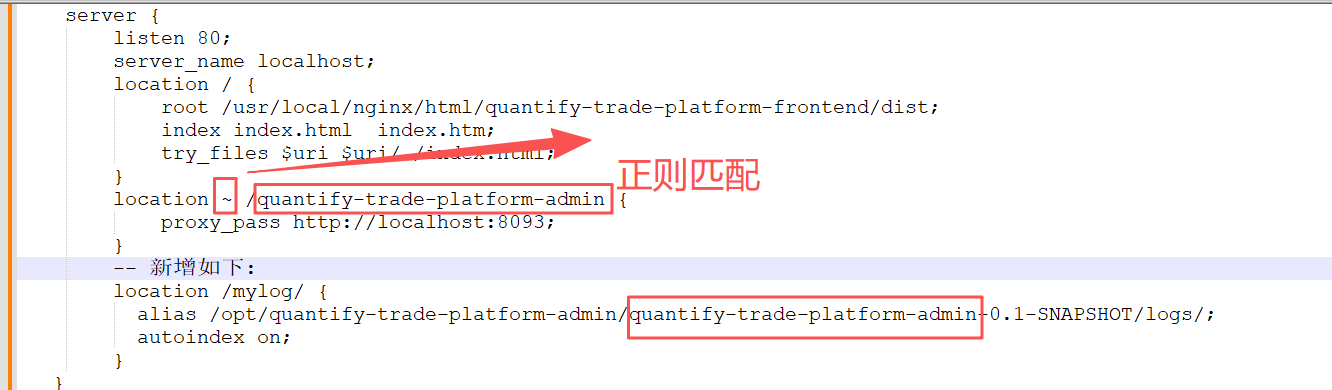
行吧,一看肯定是location中的那个的问题了,由于日志文件名和我们后端接口的前缀是一样的,所以匹配到了上图的那个location,然后又是正则匹配(这块这几个符号一直记不清楚,这下把自己坑了)
写这篇文章时,网上搜索了下,发现有这么一个技巧:
https://stackoverflow.com/questions/12703702/nginx-test-which-location-used-to-process-request#:~:text=If you just want to ,3%20Comments
https://stackoverflow.com/questions/12703702/nginx-test-which-location-used-to-process-request
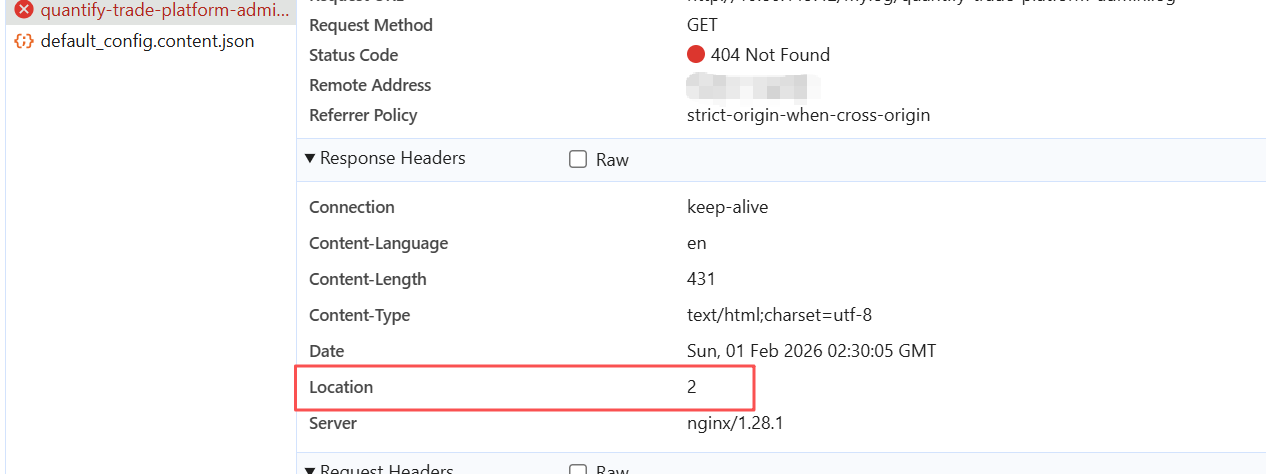
就是在每个location中加一个语句,在返回的http header中加一个:
add_header location 1 always;
注意,这里要加always,不然像我这种404情况下,不加always是不会有这个header的。
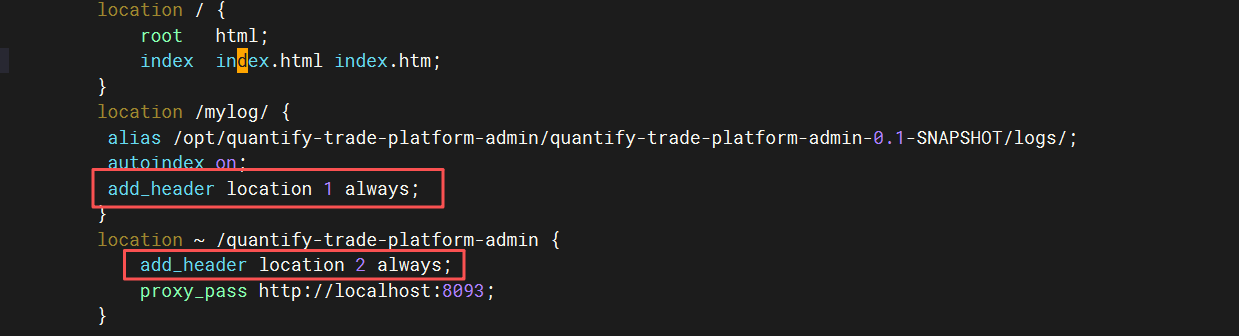
加了always,才会像下面这样:
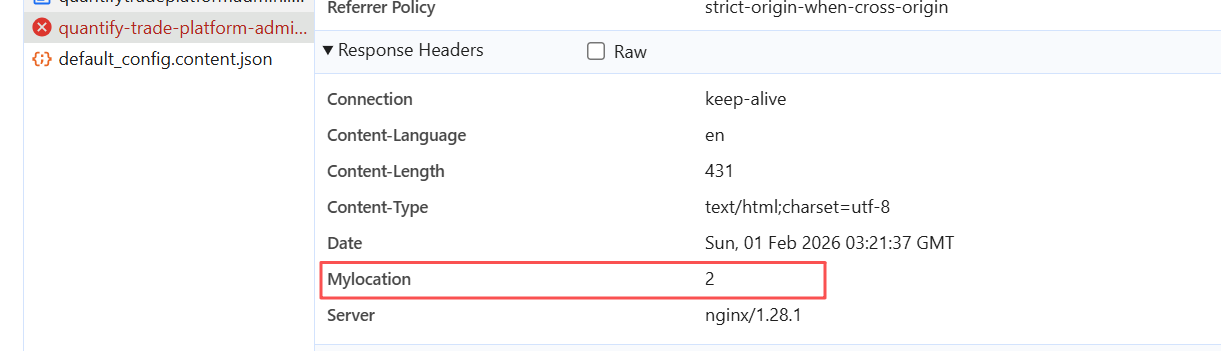
另外,由于location是一个http规范中预定义的header,和403重定向配合使用,我们可以换个名字:
add_header mylocation 2 always;
另外一个方式,就是把日志多打一点,我试过两种:
error_log logs/my_error.log info;
https://nginx.org/en/docs/ngx_core_module.html#error_log
vim /usr/local/nginx/logs/my_error.log
但发现没啥用,还是没有详细日志。
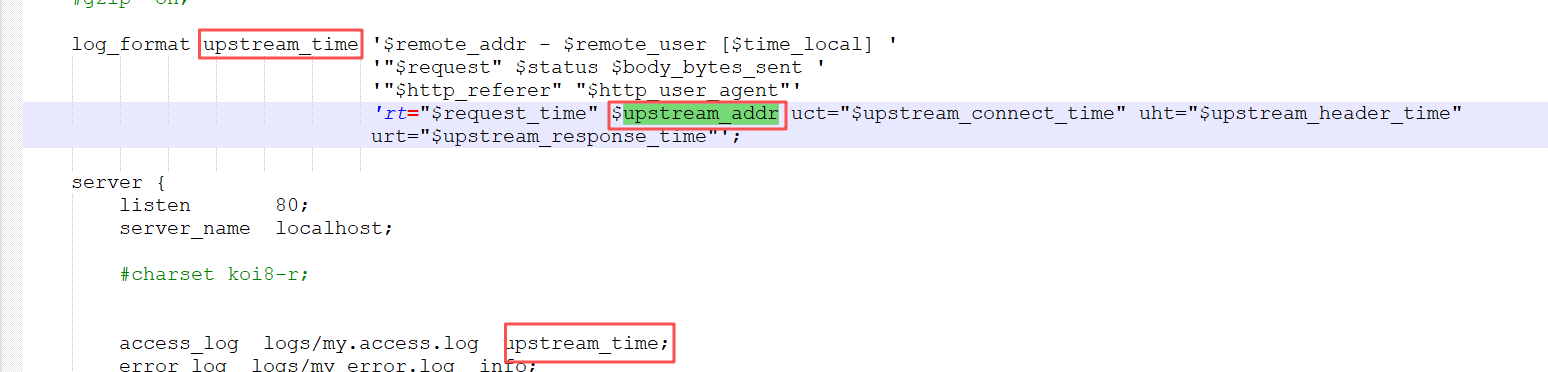
    log_format upstream_time '$remote_addr - $remote_user [$time_local] '
                             '"$request" $status $body_bytes_sent '
                             '"$http_referer" "$http_user_agent"'
                             'rt="$request_time" $upstream_addr uct="$upstream_connect_time" uht="$upstream_header_time" urt="$upstream_response_time"';

    server {
        listen       80;
        server_name  localhost;


        access_log  logs/my.access.log  upstream_time;
通过上面这类日志,也能帮我们看到,到底走到了哪个location,反向代理到了哪台后端服务器。
https://nginx.org/en/docs/debugging_log.html
这个要在编译时打开:
./configure --with-debug ...
这个我就没试了,后续有空再说。
此内容由惯性聚合(RSS阅读器)自动聚合整理,仅供阅读参考。 原文来自 — 版权归原作者所有。