







在 Windows 操作系统下,内存转储(dump)文件有多种类型,每种类型都有其特定的用途和特点
internal class Program
{
    private static void Main(string[] args)
    {
        Console.WriteLine("Hello, World!");

        Memory();
        CPU();

        Console.ReadKey();
    }

    private static readonly List<byte[]> _list =  new List<byte[]>();

    /// <summary>
    /// Memories this instance
    /// </summary>
    private static void Memory()
    {
        for (var i = 0; i < 10; i++)
        {
            _list.Add(new byte[1024 * 1024 * 10]);
        }
    }

    /// <summary>
    /// Cpus this instance
    /// </summary>
    private static void CPU()
    {
        System.Threading.Tasks.Task.Factory.StartNew(() =>
        {
            while (true)
            {
                Console.WriteLine(_list.Count);
            }
        });
    }
}
@echo off
echo 正在启用Dump...
reg add "HKEY_LOCAL_MACHINE\SOFTWARE\Microsoft\Windows\Windows Error Reporting\LocalDumps"
reg add "HKEY_LOCAL_MACHINE\SOFTWARE\Microsoft\Windows\Windows Error Reporting\LocalDumps" /v DumpFolder /t REG_EXPAND_SZ /d "D:\CrashDump" /f
reg add "HKEY_LOCAL_MACHINE\SOFTWARE\Microsoft\Windows\Windows Error Reporting\LocalDumps" /v DumpType /t REG_DWORD /d 2 /f
reg add "HKEY_LOCAL_MACHINE\SOFTWARE\Microsoft\Windows\Windows Error Reporting\LocalDumps" /v DumpCount /t REG_DWORD /d 10 /f
echo Dump已经启用
exit
将上述内存保存为 *.bat就开始了自动抓dmp文件的功能。只要有程序崩溃,就会在指定的目录下生成。
DebugDiag 注册表键值说明
| 名称 | 类型 | 说明 | 默认值 |
|---|---|---|---|
| DumpCount | REG_DWORD | 最大保留Dump个数 | 10 |
| DumpType | REG_DWORD | Dump类型 (1 - Mini dump, 2 - Full dump) | 1 |
| DumpFolder | REG_EXPAND_SZ | Dump文件保存的位置 |
如果程序崩溃没有产生 dump 文件则可能是没有权限,将目录修改为有权限的目录即可。
DebugDiag(Debug Diagnostic Tool)是 Microsoft 提供的一款强大的故障排除工具,主要用于捕获和分析应用程序的内存转储文件。它可以用于诊断应用程序崩溃、挂起和内存泄漏等问题。以下是如何使用 DebugDiag 创建和分析内存转储文件的步骤。
下载 DebugDiag:
安装 DebugDiag:
打开 DebugDiag:
启动 DebugDiag Collection:
创建新的规则:
配置规则:
启动规则:
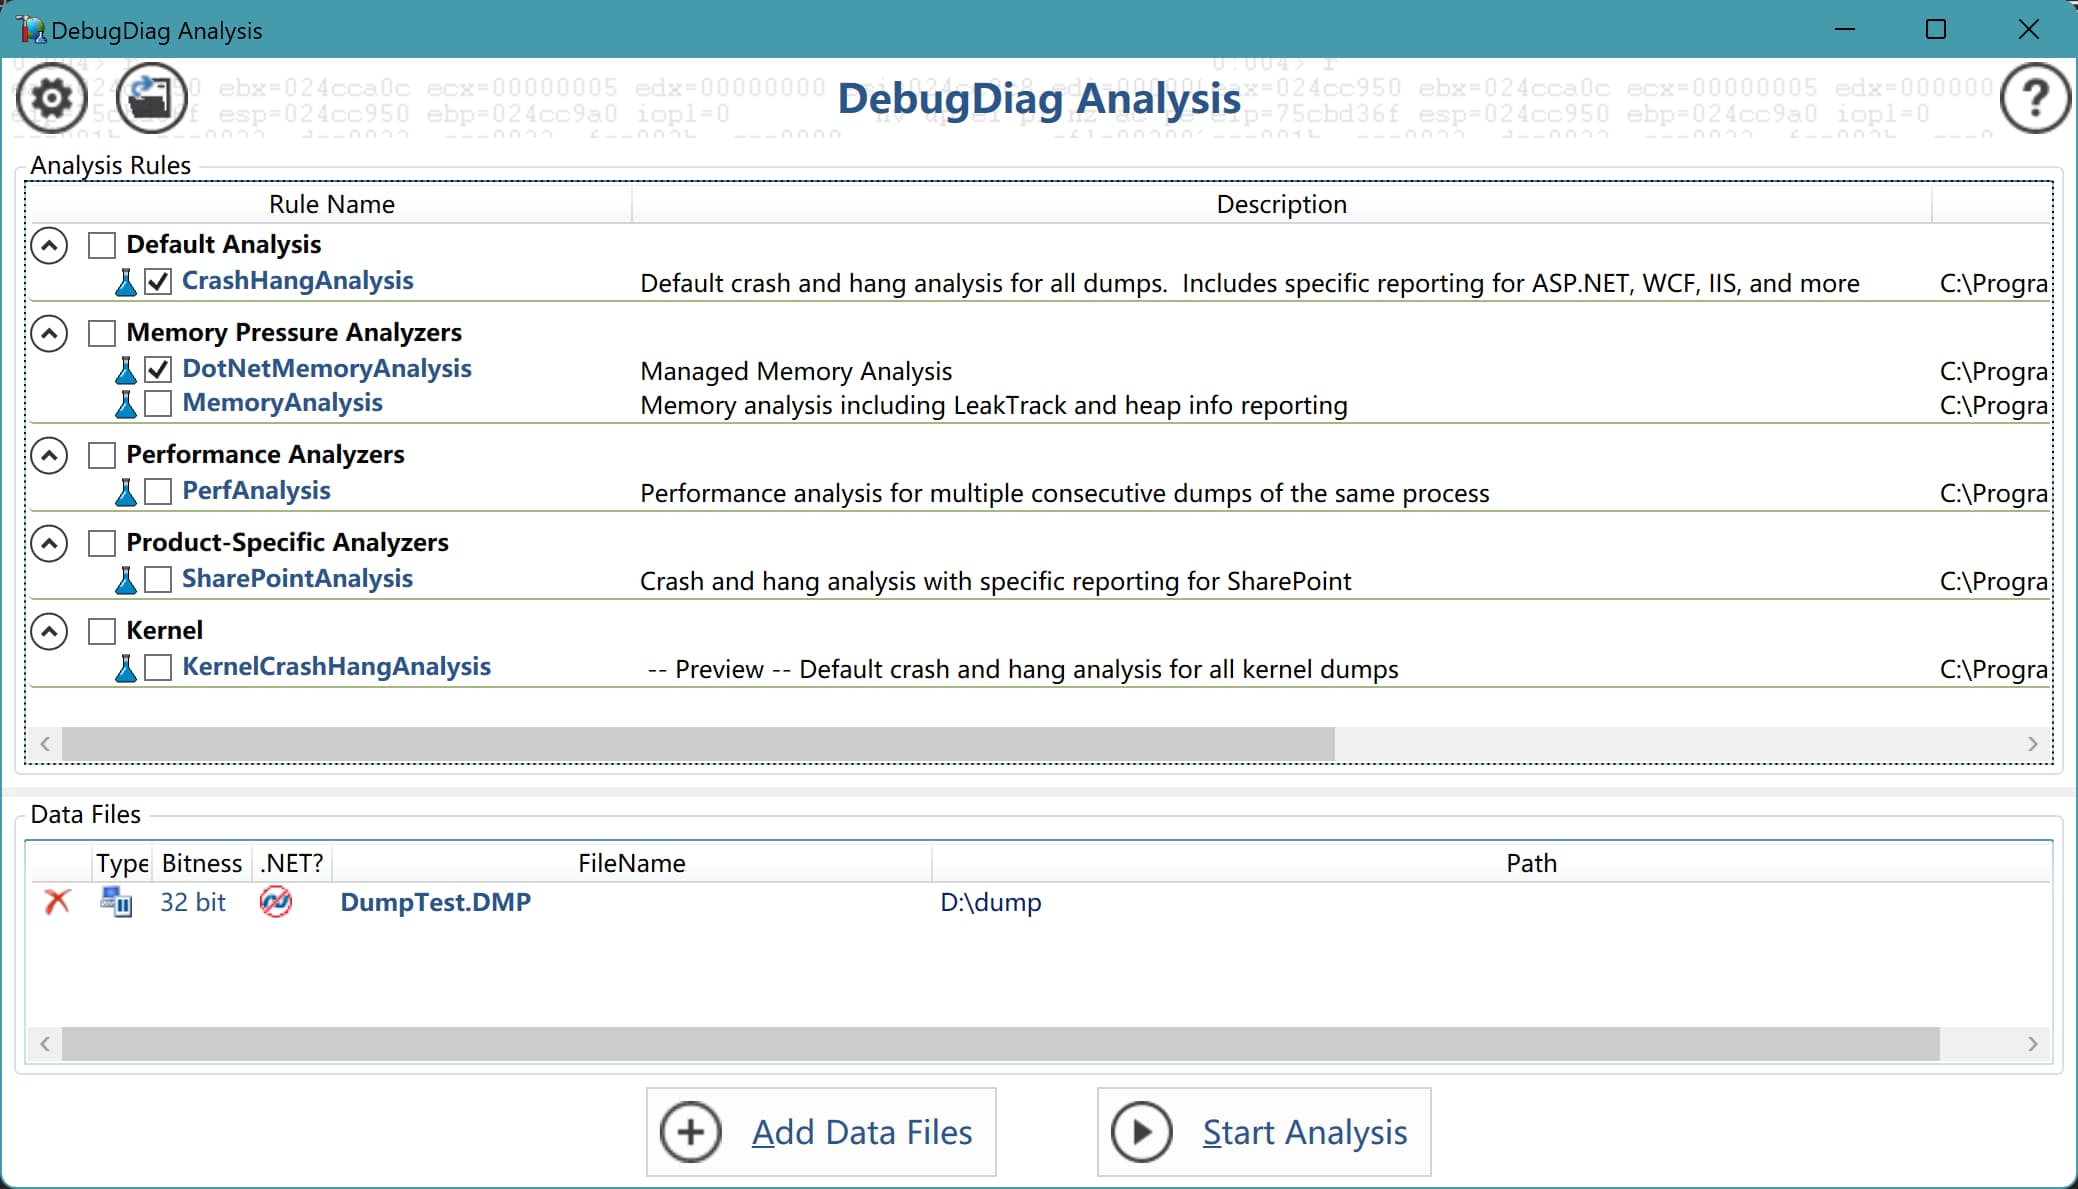
打开 DebugDiag Analysis:
加载转储文件:
分析转储文件:

注意事项
希望这些步骤和工具能帮助你有效地创建和分析内存转储文件。如果有更多问题或需要进一步的帮助,请随时提问。

可以看到还是很傻瓜化的,快照中说明已经很明显了
WinDbg 是一个强大的调试工具,用于分析 Windows 操作系统和应用程序的崩溃转储文件
下载并安装 WinDbg下载
加载符号文件,在 WinDbg 中,设置符号文件路径。可以使用 Microsoft 的符号服务器.sympath srvC:\Symbolshttps://msdl.microsoft.com/download/symbols
其中 C:\Symbols 是本地符号缓存目录
在 WinDbg 中,选择 File -> Open Crash Dump,然后选择要分析的转储文件(通常是 .dmp 文件)
************* Preparing the environment for Debugger Extensions Gallery repositories **************
   ExtensionRepository : Implicit
   UseExperimentalFeatureForNugetShare : false
   AllowNugetExeUpdate : false
   NonInteractiveNuget : true
   AllowNugetMSCredentialProviderInstall : false
   AllowParallelInitializationOfLocalRepositories : true

   EnableRedirectToV8JsProvider : false

   -- Configuring repositories
      ----> Repository : LocalInstalled, Enabled: true
      ----> Repository : UserExtensions, Enabled: true

>>>>>>>>>>>>> Preparing the environment for Debugger Extensions Gallery repositories completed, duration 0.000 seconds

************* Waiting for Debugger Extensions Gallery to Initialize **************

>>>>>>>>>>>>> Waiting for Debugger Extensions Gallery to Initialize completed, duration 0.062 seconds
   ----> Repository : UserExtensions, Enabled: true, Packages count: 0
   ----> Repository : LocalInstalled, Enabled: true, Packages count: 41

Microsoft (R) Windows Debugger Version 10.0.27553.1004 AMD64
Copyright (c) Microsoft Corporation. All rights reserved.


Loading Dump File [D:\dump\DumpTest.DMP]
User Mini Dump File with Full Memory: Only application data is available

WARNING: Path element is empty

************* Path validation summary **************
Response                         Time (ms)     Location
Deferred                                       SRV*C:\symbolscache*http://msdl.microsoft.com/download/symbols
Deferred                                       srv*
WARNING: Path element is empty
Symbol search path is: SRV*C:\symbolscache*http://msdl.microsoft.com/download/symbols;;srv*
Executable search path is:
Windows 10 Version 22631 MP (20 procs) Free x64
Product: WinNt, suite: SingleUserTS Personal
Edition build lab: 22621.1.amd64fre.ni_release.220506-1250
Debug session time: Fri Nov 22 15:13:03.000 2024 (UTC + 8:00)
System Uptime: 0 days 5:03:15.026
Process Uptime: 0 days 0:00:32.000
................................................

+------------------------------------------------------------------------+
| This target supports Hardware-enforced Stack Protection. A HW based    |
| "Shadow Stack" may be available to assist in debugging and analysis.   |
| See aka.ms/userhsp for more info.                                      |
|                                                                        |
| dps @ssp                                                               |
|                                                                        |
+------------------------------------------------------------------------+

For analysis of this file, run !analyze -v
wow64cpu!CpupSyscallStub+0x13:
00000000`003a1cf3 c3              ret
可以看到 WinDbg 已经加载了转储文件,并准备好进行分析
SOS.dll扩展命令模块.load C:\Windows\Microsoft.NET\Framework64\v4.0.30319\sos.dll
!analyze -v 是一个用于分析崩溃转储文件的命令,它提供了详细的崩溃信息,包括异常类型、堆栈跟踪、寄存器值等。
0:000> !analyze -v
*******************************************************************************
*                                                                             *
*                        Exception Analysis                                   *
*                                                                             *
*******************************************************************************


KEY_VALUES_STRING: 1

    Key  : Analysis.Elapsed.mSec
    Value: 89839

    Key  : Analysis.IO.Other.Mb
    Value: 11

    Key  : Analysis.IO.Read.Mb
    Value: 0

    Key  : Analysis.IO.Write.Mb
    Value: 77

    Key  : Analysis.Init.Elapsed.mSec
    Value: 102744

    Key  : Analysis.Memory.CommitPeak.Mb
    Value: 170

    Key  : CLR.BuiltBy
    Value: NET481REL1LAST_C

    Key  : CLR.Engine
    Value: CLR

    Key  : CLR.Version
    Value: 4.8.9282.0

    Key  : Failure.Bucket
    Value: BREAKPOINT_80000003_wow64cpu.dll!CpupSyscallStub

    Key  : Failure.Hash
    Value: {289a12fb-10fd-bb5b-3edc-4567046643a5}

    Key  : Timeline.OS.Boot.DeltaSec
    Value: 18195

    Key  : Timeline.Process.Start.DeltaSec
    Value: 32

    Key  : WER.OS.Branch
    Value: ni_release

    Key  : WER.OS.Version
    Value: 10.0.22621.1

    Key  : WER.Process.Version
    Value: 1.0.0.0


FILE_IN_CAB:  DumpTest.DMP

NTGLOBALFLAG:  0

APPLICATION_VERIFIER_FLAGS:  0

EXCEPTION_RECORD:  (.exr -1)
ExceptionAddress: 0000000000000000
   ExceptionCode: 80000003 (Break instruction exception)
  ExceptionFlags: 00000000
NumberParameters: 0

FAULTING_THREAD:  000134fc

PROCESS_NAME:  DumpTest.exe

ERROR_CODE: (NTSTATUS) 0x80000003 - {    }

EXCEPTION_CODE_STR:  80000003

STACK_TEXT:
00000000`0063e808 00000000`003a192c     : 00000023`77006bcc 00007ffa`e4c70023 00000000`00000000 00000000`00000000 : wow64cpu!CpupSyscallStub+0x13
00000000`0063e810 00000000`003a1d75     : 00000000`0073f850 00007ffa`e4c7cb78 00000000`00392008 00007ffa`e4c7ec97 : wow64cpu!DeviceIoctlFileFault+0x31
00000000`0063e8c0 00007ffa`e4c7ea8d     : 00000000`005a0000 00000000`0063f300 00000000`00000000 00000000`0063f300 : wow64cpu!BTCpuSimulate+0xbb5
00000000`0063e900 00007ffa`e4c7e18d     : 00000000`00000000 00000000`00958360 00000000`00000000 00000000`00000000 : wow64!RunCpuSimulation+0xd
00000000`0063e930 00007ffa`e65ee7db     : 00000000`00390080 00007ffa`e664b760 00000000`0059f000 00007ffa`e6647b28 : wow64!Wow64LdrpInitialize+0x12d
00000000`0063ebe0 00007ffa`e65daad6     : 00000000`00000000 00000000`00000000 00000000`00000000 00000000`00000001 : ntdll!LdrpInitializeProcess+0x174b
00000000`0063efb0 00007ffa`e65844e3     : 00000000`0063f300 00007ffa`e6510000 00000000`0059f050 00000000`005a27ee : ntdll!_LdrpInitialize+0x565ba
00000000`0063f030 00007ffa`e658440e     : 00000000`0063f300 00000000`00000000 00000000`0063f300 00000000`00000000 : ntdll!LdrpInitializeInternal+0x6b
00000000`0063f2b0 00000000`00000000     : 00000000`00000000 00000000`00000000 00000000`00000000 00000000`00000000 : ntdll!LdrInitializeThunk+0xe


SYMBOL_NAME:  wow64cpu!CpupSyscallStub+13

MODULE_NAME: wow64cpu

IMAGE_NAME:  wow64cpu.dll

STACK_COMMAND:  dt ntdll!LdrpLastDllInitializer BaseDllName ; dt ntdll!LdrpFailureData ; ~0s; .ecxr ; kb

FAILURE_BUCKET_ID:  BREAKPOINT_80000003_wow64cpu.dll!CpupSyscallStub

OS_VERSION:  10.0.22621.1

BUILDLAB_STR:  ni_release

OSPLATFORM_TYPE:  x64

OSNAME:  Windows 10

IMAGE_VERSION:  10.0.22621.2506

FAILURE_ID_HASH:  {289a12fb-10fd-bb5b-3edc-4567046643a5}

Followup:     MachineOwner
---------
0:000> !threadpool
*** ERROR: Symbol file could not be found.  Defaulted to export symbols for clr.dll -
PDB symbol for clr.dll not loaded
CPU utilization: 0%
Worker Thread: Total: 0 Running: 0 Idle: 0 MaxLimit: 0 MinLimit: 0
Work Request in Queue: 0
--------------------------------------
Number of Timers: 0
--------------------------------------
Completion Port Thread:Total: 0 Free: 0 MaxFree: 0 CurrentLimit: 0 MaxLimit: 1000 MinLimit: 0
CPU utilization 0%说明不是 ThreadPool 的问题
0:000> !runaway
 User Mode Time
  Thread       Time
   4:714       0 days 0:00:00.358
   3:38c       0 days 0:00:00.000
   2:b94       0 days 0:00:00.000
   1:8bc       0 days 0:00:00.000
   0:8ec       0 days 0:00:00.000
执行时间最长的是线程 4,执行了 0 days 0:00:00.358
0:004> ~4 s
ntdll!ZwRequestWaitReplyPort+0xa:
00000000`776400da c3              ret
0:004> !clrstack
OS Thread Id: 0xa68 (4)
Child SP         IP               Call Site
000000001c4feb68 00000000776400da [NDirectMethodFrameStandalone: 000000001c4feb68] System.IO.__ConsoleStream.WriteFile(Microsoft.Win32.SafeHandles.SafeFileHandle, Byte*, Int32, Int32 ByRef, IntPtr)
000000001c4feb10 000007fef12c34a1 DomainNeutralILStubClass.IL_STUB_PInvoke(Microsoft.Win32.SafeHandles.SafeFileHandle, Byte*, Int32, Int32 ByRef, IntPtr)*** WARNING: Unable to verify checksum for mscorlib.ni.dll
*** ERROR: Module load completed but symbols could not be loaded for mscorlib.ni.dll

000000001c4fec30 000007fef127cf9f System.IO.__ConsoleStream.WriteFileNative(Microsoft.Win32.SafeHandles.SafeFileHandle, Byte[], Int32, Int32, Int32, Int32 ByRef)
000000001c4fec90 000007fef127cefa System.IO.__ConsoleStream.Write(Byte[], Int32, Int32)
000000001c4fecf0 000007fef1253a09 System.IO.StreamWriter.Flush(Boolean, Boolean)
000000001c4fed50 000007fef1a77b3d System.IO.TextWriter+SyncTextWriter.WriteLine(Int32)
000000001c4feda0 000007ff0016030d ConsoleApplication1.Program.<Cpu>b__0()*** WARNING: Unable to verify checksum for ConsoleApplication1.exe
 [f:\Documents\Visual Studio 2012\Projects\2012test\ConsoleApplication1\Program.cs @ 23]
000000001c4fede0 000007fef121181c System.Threading.ExecutionContext.Run(System.Threading.ExecutionContext, System.Threading.ContextCallback, System.Object, Boolean)
000000001c4fee40 000007fef121172b System.Threading.ExecutionContext.Run(System.Threading.ExecutionContext, System.Threading.ContextCallback, System.Object)
000000001c4fee90 000007fef12a6f2d System.Threading.ThreadHelper.ThreadStart()
000000001c4ff2e8 000007fef33a10b4 [GCFrame: 000000001c4ff2e8]
000000001c4ff6d0 000007fef33a10b4 [DebuggerU2MCatchHandlerFrame: 000000001c4ff6d0]
0:004> !eeheap -gc
Number of GC Heaps: 1
generation 0 starts at 0x0000000002a26220
generation 1 starts at 0x0000000002a21cf0
generation 2 starts at 0x0000000002a11000
ephemeral segment allocation context: none
         segment             begin         allocated  size
0000000002a10000  0000000002a11000  0000000002af2238  0xe1238(922168)
Large object heap starts at 0x0000000012a11000
         segment             begin         allocated  size
0000000012a10000  0000000012a11000  0000000018e171e0  0x64061e0(104882656)
Total Size:              Size: 0x64e7418 (105804824) bytes.
------------------------------
GC Heap Size:    Size: 0x64e7418 (105804824) bytes.
0:004> !dumpheap -min 200 -stat
total 0 objects
Statistics:
              MT    Count    TotalSize Class Name
000007fef1369750        1          216 System.AppDomain
000007fef13745d0        2          432 System.Globalization.NumberFormatInfo
000007fef1373148        1          432 System.Collections.Generic.Dictionary`2+Entry[[System.Type, mscorlib],[System.Security.Policy.EvidenceTypeDescriptor, mscorlib]][]
000007fef136b7b0        2         1056 System.Globalization.CultureData
000007fef136c7e8        2         1128 System.Int32[]
000007fef136b328        3         3256 System.Char[]
000007fef136d110        1         4752 System.Collections.Generic.Dictionary`2+Entry[[System.String, mscorlib],[System.String, mscorlib]][]
0000000000664be0       22        31784      Free
000007fef136ae78        5        34072 System.Object[]
000007fef1370bc0       11    104858384 System.Byte[]
Total 50 objects
byte[] 占用了 104858384 字节,大约 100MB
0:004> !dumpheap -type Byte[] -min 200
         Address               MT     Size
0000000002a25290 000007fef1370bc0      544
0000000012a17048 000007fef1370bc0 10485784
0000000013417060 000007fef1370bc0 10485784
0000000013e17078 000007fef1370bc0 10485784
00000000148170a8 000007fef1370bc0 10485784
00000000152170d8 000007fef1370bc0 10485784
0000000015c17108 000007fef1370bc0 10485784
0000000016617138 000007fef1370bc0 10485784
0000000017017168 000007fef1370bc0 10485784
0000000017a17198 000007fef1370bc0 10485784
00000000184171c8 000007fef1370bc0 10485784
total 0 objects
Statistics:
              MT    Count    TotalSize Class Name
000007fef1370bc0       11    104858384 System.Byte[]
Total 11 objects
选取一个地址0000000012a17048
0:004> !gcroot 0000000012a17048
Note: Roots found on stacks may be false positives. Run "!help gcroot" for
more info.
Scan Thread 0 OSTHread a54
RSP:54e958:Root:  0000000002a21e60(System.Threading.ThreadStart)->
  0000000002a21cb0(ConsoleApplication1.Program)->
  0000000002a21cc8(System.Collections.Generic.List`1[[System.Byte[], mscorlib]])->
  0000000002a21dc0(System.Byte[][])->
  0000000012a17048(System.Byte[])
定位到 List 对象
0:004> !do 0000000002a21cb0
Name:        ConsoleApplication1.Program
MethodTable: 000007ff00044140
EEClass:     000007ff00152350
Size:        24(0x18) bytes
File:        C:\Users\Administrator\Desktop\ConsoleApplication1\ConsoleApplication1.exe
Fields:
              MT    Field   Offset                 Type VT     Attr            Value Name
000007ff00032600  4000001        8 ...yte[], mscorlib]]  0 instance 0000000002a21cc8 _list
此内容由惯性聚合(RSS阅读器)自动聚合整理,仅供阅读参考。 原文来自 — 版权归原作者所有。