The mobile app media landscape felt the repercussions of the economic downturn in 2023, with nearly all major media sources witnessing declines. In the third quarter of 2023, app install ad spend budgets were slashed by 20% when compared to the same period in 2022. That’s according to the latest Performance Index by data analytics firm AppsFlyer.
The objective of the Index is to aid marketers in making informed choices when selecting partners for app advertising, with outcomes differing significantly depending on the platform in question.
“Only four of the top 20 media source players saw budget increases this year, costs of media continue to fluctuate and channels like CTV are leading ecosystem players to quickly adapt and think outside of the box to reach consumers,” aid Shani Rosenfelder, Director of Content and Market Insights at AppsFlyer. “For marketers, selecting the best media partners is particularly important on iOS because of its high quality audience. However, privacy-driven fragmentation in measurement has only created more uncertainty, increasing the need for accurate performance rankings for the platform.”
- Advertisement -
Is your privacy opt-in rate costing you $525,000 a year?
The gap between a 65% and 90%+ privacy opt-in rate can mean $525,000 in lost revenue annually for a 100K DAU app — and most teams have no idea where they stand.
This guide breaks down the true cost of consent debt, why the average app sits at just 80% opt-in, and the exact tactics top performers use to consistently hit 90%+: prompt timing, banner design, vendor list optimization, and more.
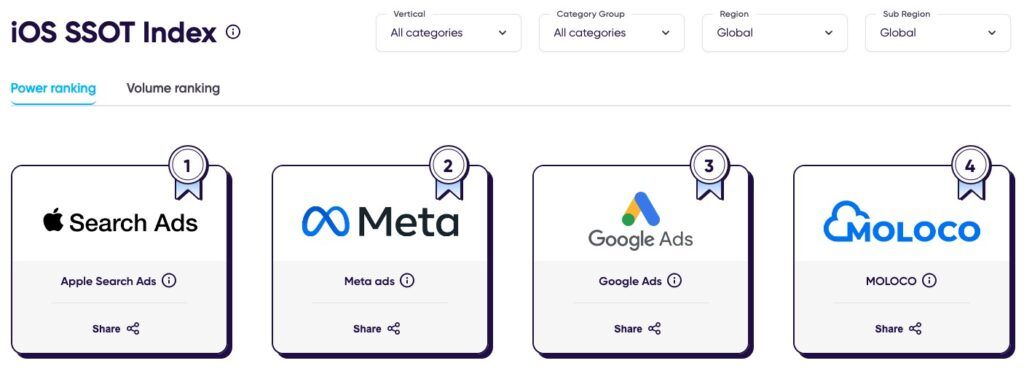
AppsFlyer’s new SSOT iOS index reveals that Apple Search Ads (ASA) is the top iOS media source for both gaming and non-gaming apps. ASA dominates in most rankings across regions and categories.
Meta ads, though not as dominant as before iOS 14.5, holds the second spot, excelling in non-gaming apps.
iOS Power ranking
Source: AppsFlyer
In third place in the rankings is Google Ads, primarily due to its widespread adoption among non-gaming apps. It’s worth noting that iOS serves as a secondary focus for Google compared to its primary emphasis on the Android platform and web-based services.
AppLovin and Unity Ads shine in gaming, while in non-gaming, Meta ads, Google Ads, Snapchat, and Moloco stand out for their quality.
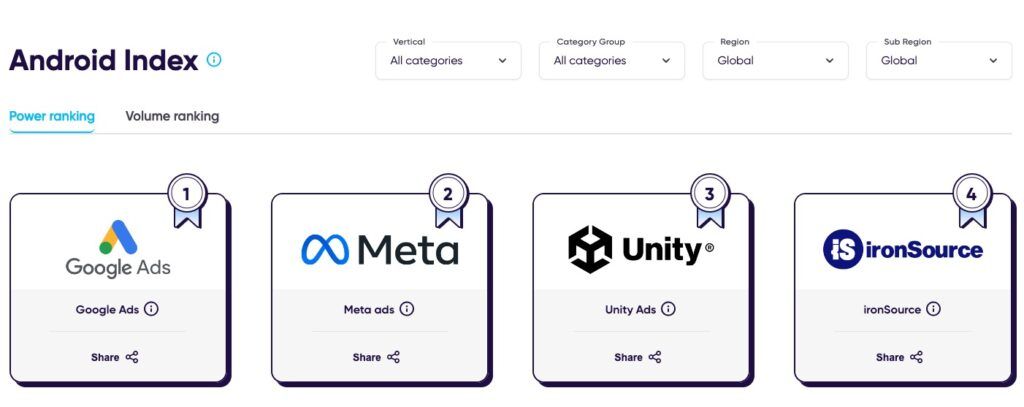
Google Ads continues to dominate both Android gaming and non-gaming categories, widening its lead over second-place Unity. In fact, it secures the top spot in power and volume rankings across every category in Android gaming, except for hypercasual, where it comes in second.
Unity Ads maintains its second-place global power ranking but slips one spot in the volume ranking to fifth. Its success is primarily seen in Match genre games, where it ranks second, and in Puzzle, Shooting, and Tabletop game apps, where it secures a third-place global ranking.
Android Power ranking
Source: AppsFlyer
IronSource experiences significant growth in the global rankings, surging to third place in both power and volume rankings, a notable jump of three positions compared to the previous Index edition.
Meta ads climbs to the fourth spot in the global power ranking, up one position from 2022. This success is attributed to its top ranking in the casino category and second-place positions in midcore games (RPG, Shooting, Strategy genres), as well as in puzzle, and sports & racing games.
It’s important to highlight that the differences in power rankings between Unity, ironSource, and Meta are relatively minor.
此内容由惯性聚合(RSS阅读器)自动聚合整理,仅供阅读参考。 原文来自 — 版权归原作者所有。