


想实现如下数字可视化大屏吗?本文教你不用一行代码,快速搭建一套数字可视化大屏系统。
只需要使用grafana+prometheus+node_exporter.分分钟就可以搭建起来。
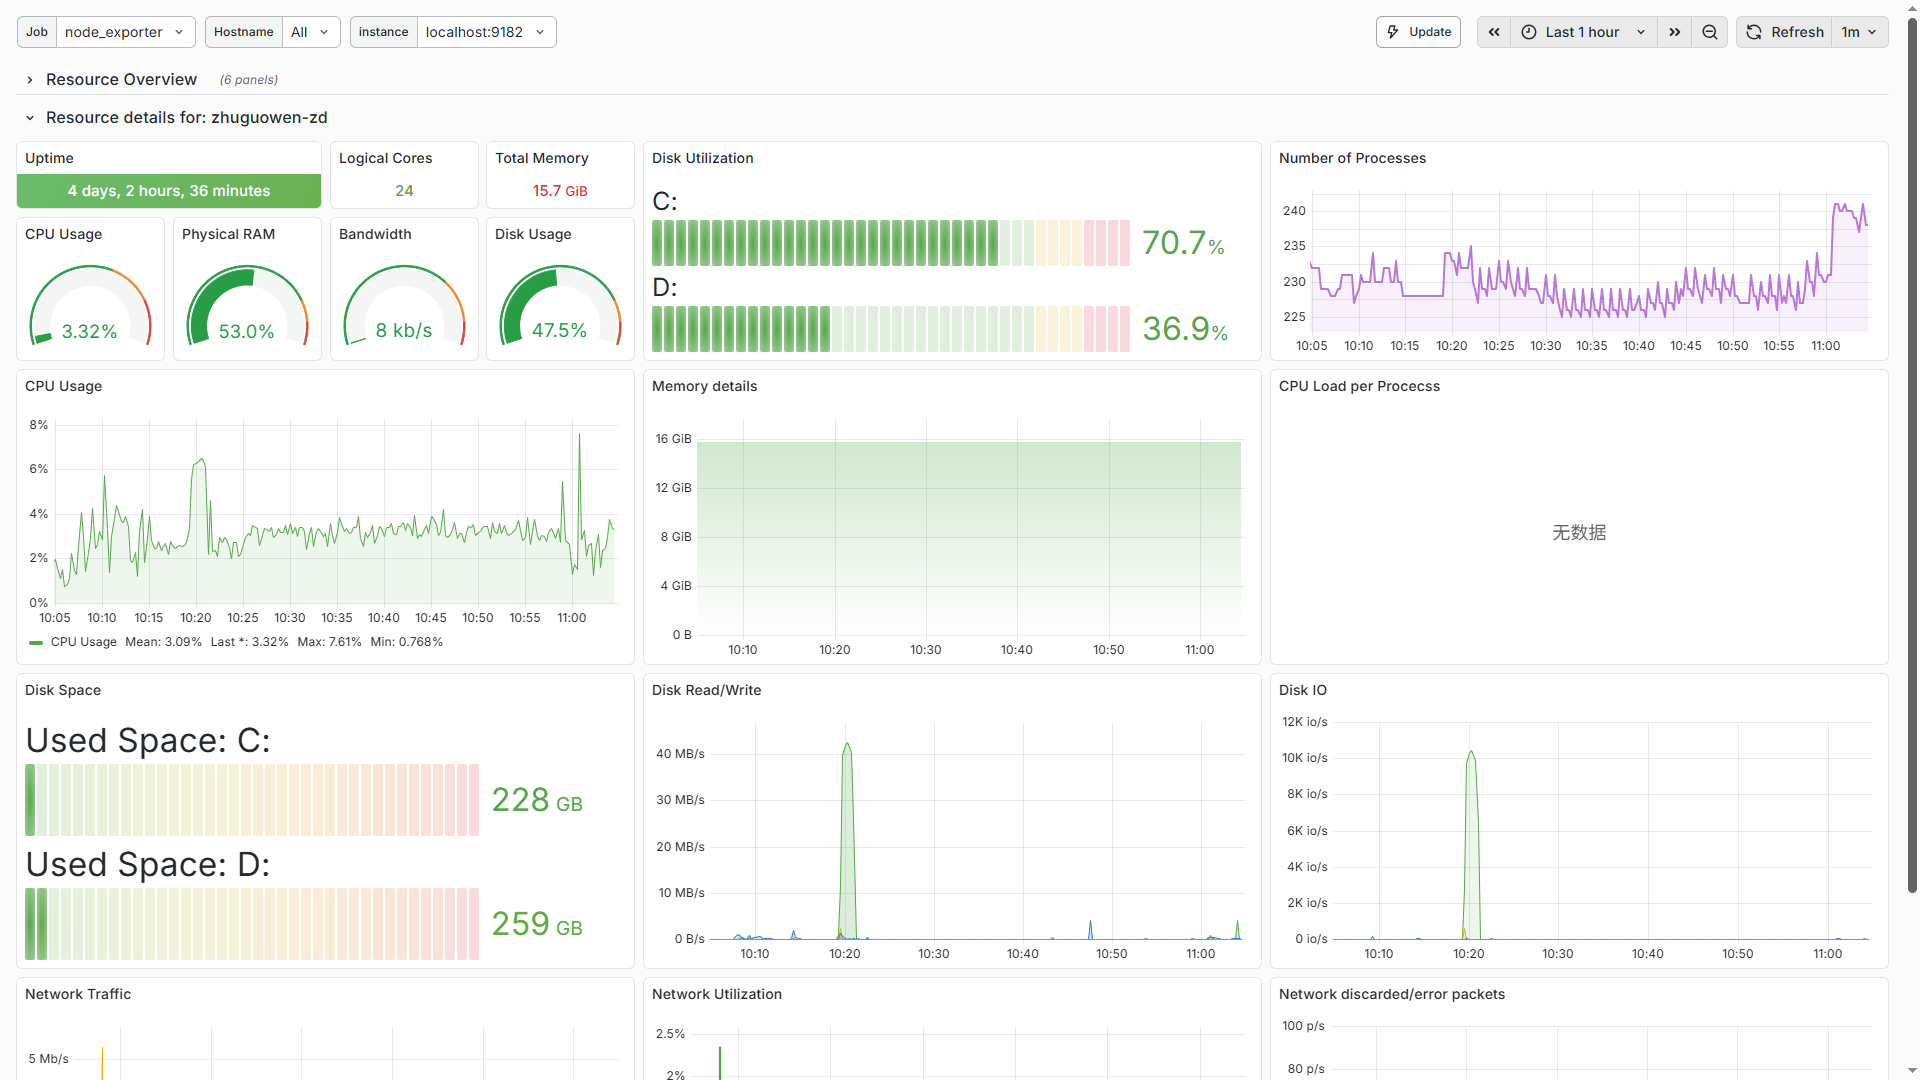
Grafana官网:https://grafana.com/
grafana是一款开源的数据可视化看板工具,可连接几乎你能想到的所有数据源,并将其用可视化图表等方式展示出来。
prometheus普罗米修斯下载地址:https://prometheus.io/download/
一款开源的监控系统,是一个系统和服务的监控系统。周期性采集metrics指标,匹配规则和展示结果,以及触发某些条件的告警发送。
node_exporter下载地址:https://prometheus.io/download/
服务器(主要是linux)数据监控组件,用于prometheus
windows_exporter下载地址:https://github.com/prometheus-community/windows_exporter
windows下的node_exporter版本
步骤:
1.下载并安装grafana
参考:https://www.cnblogs.com/almco/p/18692589
2.下载并安装prometheus
这个比较简单,从https://prometheus.io/download/下载页面直接下载你需要的版本,
比如windows版本下prometheus-3.8.1.windows-amd64.zip,解压后双击根目录下的prometheus.exe文件即可启动prometheus
在本地浏览器访问http://localhost:9090/,能正常打开就代表成功。
3.下载安装windows_exporter插件。
从以下地址https://github.com/prometheus-community/windows_exporter直接下载release版本,
解压后就一个exe文件,双击即可启动。在浏览器访问http://localhost:9182/metrics 有数据返回则成功。
4.将winows_exporter插件配置到prometheus中
打开prometheus目录下的prometheus.yml配置文件,增加
在scrape_configs:下增加
- job_name: 'node_exporter'
    static_configs:
      - targets: ['localhost:9182']
完整scrape_configs节点内容如下:
scrape_configs:
  # The job name is added as a label `job=<job_name>` to any timeseries scraped from this config.
  - job_name: "prometheus"

    # metrics_path defaults to '/metrics'
    # scheme defaults to 'http'.

    static_configs:
      - targets: ["localhost:9090"]
       # The label name is added as a label `label_name=<label_value>` to any timeseries scraped from this config.
        labels:
          app: "prometheus"

  - job_name: 'node_exporter'
    static_configs:
      - targets: ['localhost:9182']
5.从grafana官网下载模板
模板地址:https://grafana.com/grafana/dashboards/
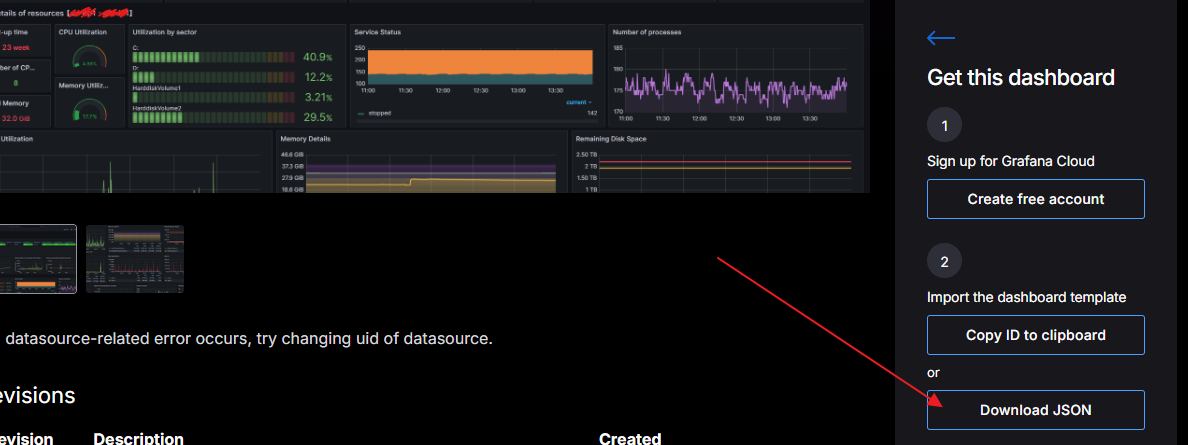
官方模板有几千个。搜索关键词 windows exporter 找出我们已安装的这个数据采集插件的模板,找一个数据源是prometheus的模板点击下载Json
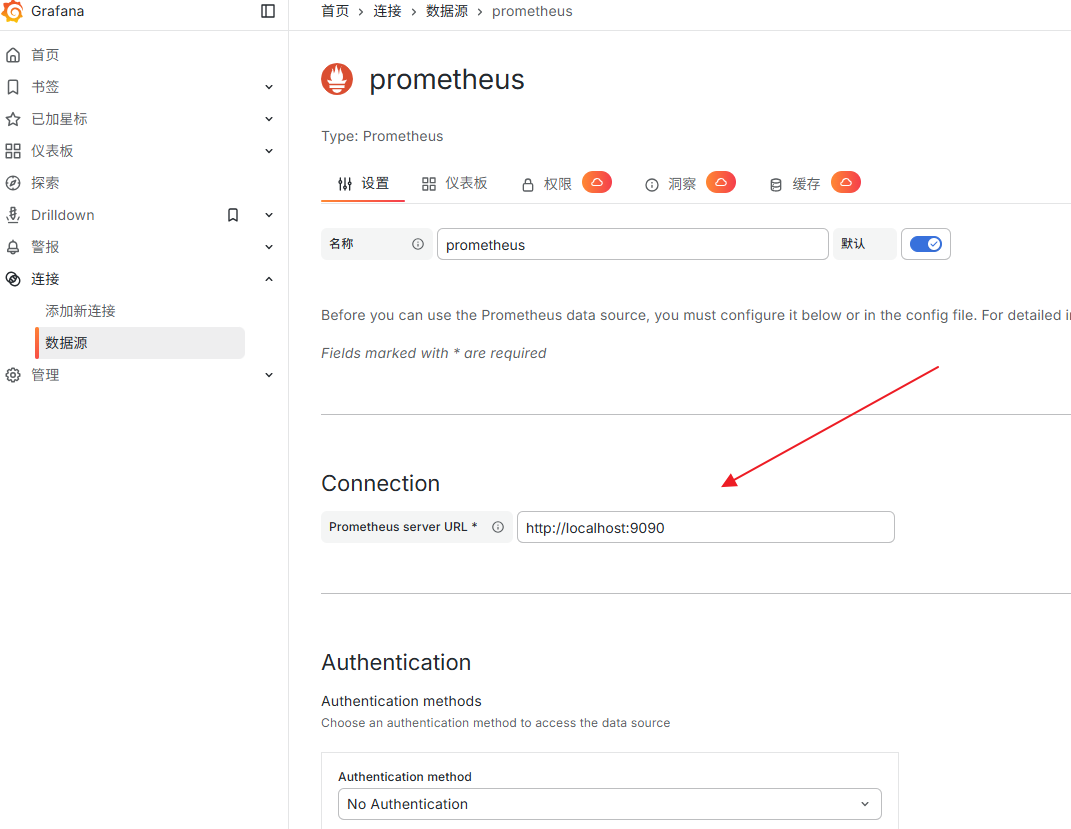
6.在grafana中添加prometheus数据源
7.在grafana中导入下载的json模板,并关联prometheus数据源
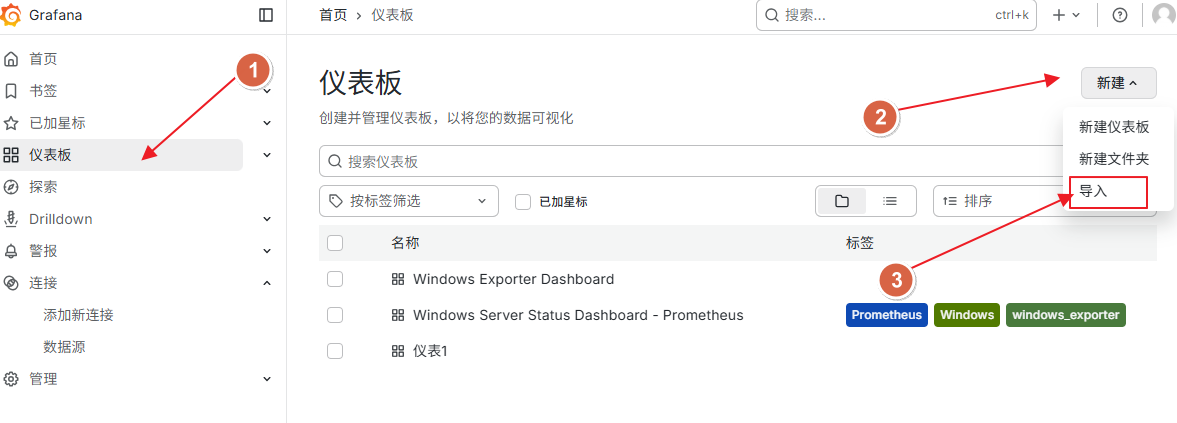
在导入界面中,选择刚我们从官网下载的模板,数据源选prometheus即可。
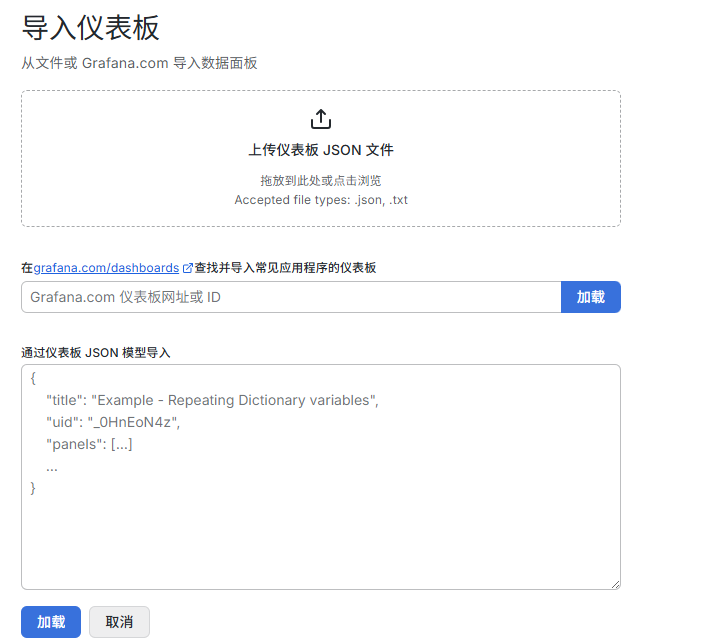
导入完成后点保存并测试,即可看到实时数据。
选择自己喜欢的样式,将数据源改成自己的其他采集数据,即可得到超多好看的数据展示大屏。
此内容由惯性聚合(RSS阅读器)自动聚合整理,仅供阅读参考。 原文来自 — 版权归原作者所有。