






Alex Cristi /iStock via Getty Images
As of 3-31-2026, the Polen U.S. Small Cap Growth strategy has been renamed to Polen 5Perspectives Small Growth. Performance shown represents results achieved at prior firms. The Polen 5Perspectives Small Growth strategy ((the "Strategy")) began in November 2000 and was managed by Cupps Capital until October 2016 at which time it was transitioned to Advisory Research Investment Management. In March 2024, it transitioned to Bosun Asset Management, and subsequently in June 2025, it transitioned to Polen Capital. Andrew Cupps has served as the portfolio manager of the Strategy since inception. Mr. Cupps has been supported in his role as portfolio manager by various individuals, including Kevin Leitner and Chris Bush. Mr. Leitner has worked on the Strategy since inception. Mr. Bush began working on the Strategy in 2007. At all times during his tenure as portfolio manager, Mr. Cupps has had ultimate decision-making authority with respect to the Strategy. Mr. Cupps, Mr. Leitner and Mr. Bush joined Polen Capital on June 30, 2025. Performance results presented in materials prior to June 30, 2025 were achieved by a team that is no longer with Polen Capital. Returns are presented gross and net of management fees and include the reinvestment of all income. Historical net of fee performance was calculated using either actual management fees or highest fees. During certain periods of the track record, net of fee performance was calculated using actual management fees, while the highest fee was used during others. Beginning, October 31, 2016, net of fee performance is being calculated using highest fee. Prior period net of fee performance was calculated using actual management fees plus fund expenses ((where applicable)). After July 1, 2025, net of fee performance was calculated using either actual management fees or highest fees for fund structures. Current performance may be lower or higher. Periods over one-year are annualized. Past performance does not guarantee future results. Please reference the GIPS Report which accompanies this commentary. The commentary is not intended as a guarantee of profitable outcomes. Any forward-looking statements are based on certain expectations and assumptions that are susceptible to changes in circumstances. Opinions and views expressed constitute the judgment of Polen Capital as of the date herein, may involve a number of assumptions and estimates which are not guaranteed, and are subject to change.
For the first few weeks of the year, small caps were on fire. Through January 22ⁿd, the Russell 2000 Growth Index ((the "Index")) was up nearly 10%, outperforming its large cap counterpart by 11% over that same timeframe. Then bit by bit, the wall of worry started to grow—first it was AI-related disruption fears in software, then private credit redemptions prompted bigger questions over the potential for broader systemic risks, and in March the concerns centered mostly on rising geopolitical risk and what that could mean for rates and inflation. From that late January high through the end of the quarter, the Index entered correction territory, down nearly -15%. In the initial stages of that drawdown from late January to early February, it was broad weakness across software as the defining narrative as the business model threat came into focus with the emergence of Agentic AI. The industry effectively de-rated as investors called into question whether software—with its quality traits—remains an attractive business model in the face of credible disruption risk. Amidst this, a flight to safety and even more than that—the so called "HALO" trade—took shape ¹. These software fears precipitated the growing concerns in private credit and private equity given more software acquisitions in recent years, and many of those publicly traded investment managers have seen their stocks sell off approximately 30-40% vs earlier this year. While there's not much direct exposure to this in the small cap growth asset class, we have observed consumer-facing financials falling out of favor in recent months. Finally, with the onset of the Iran war at the beginning of March, there was yet another rotation back into Energy and Technology and away from some of the HALO beneficiaries earlier in the year like Materials, Consumer Staples, and Real Estate. Taking all of this together, we were pleased to have been able to deliver a positive absolute return during a stretch of negative performance in the Index. One thing that's clear is that volatility has picked up and with it, sector and stock dispersion. If ever having a dynamic process to a constantly changing opportunity set was important, this year has put that on full display.
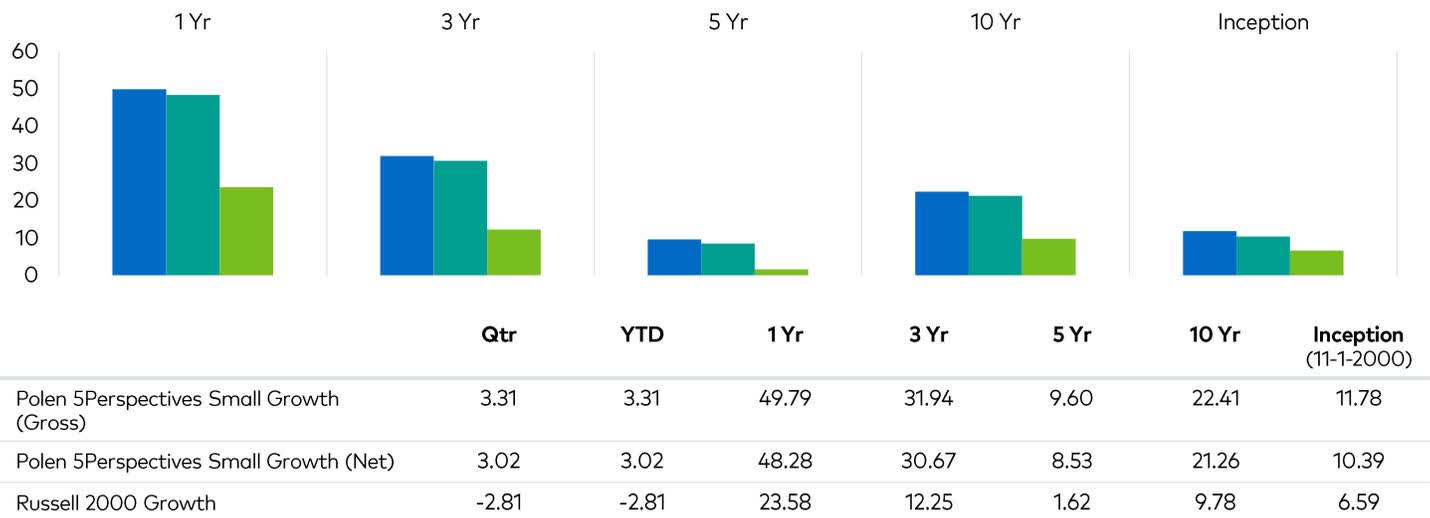
During the first quarter of 2026, the Polen 5Perspectives Small Growth Composite Portfolio ((the "Portfolio")) returned 3.3% gross and 3.0% net of fees, respectively, compared to the -2.8% return of the Index.
The top contributors to the Portfolio's relative performance in the quarter were Powell Industries, Argan, and Bloom Energy.
Powell Industries manufactures highly engineered electrical systems that distribute and manage power in mission-critical environments such as utilities, energy, and increasingly data centers. As electricity demand rises, particularly from AI-driven workloads, Powell's equipment plays a key role in enabling safe, reliable power delivery across complex infrastructure. During the quarter, shares outperformed following continued strength in orders and backlog, reflecting robust demand across end markets. The company reported significant year-over-year order growth and a book-to-bill well above 1.0x, driven by both traditional energy projects and accelerating investment in data center and grid infrastructure.
Argan is a construction company that, among other things, constructs gas-fired power plants. In recent years the company has benefited from a growing backlog of projects to construct power plants that supply electricity to data centers running AI workloads. Specific to the period, Argan surged 38% on the back of very strong earnings results that came in well ahead of consensus as the backlog grew to nearly $3B and the company signaled continued demand for large scale power projects. Stepping back, Argan appears to be very well positioned to capitalize on a multi-year investment cycle to build out power infrastructure as companies race to bring data centers online.
Bloom Energy is a provider of solid oxide fuel cells that play a critical role in delivering clean, reliable, "always on" power at scale. AI data centers require an enormous amount of power and one of the key challenges to date has been the inability of power grids to supply the necessary electricity to meet the constant and growing demands from AI workloads. Bloom's "Energy Server" fuel cells help address this issue, generating cost-efficient, reliable power onsite, converting fuels like natural gas, biogas and hydrogen into electricity without combustion. With the high demand for always-on, decentralized power solutions, Bloom stands to potentially benefit from both capacity expansions and new project wins tied to hyperscaler and industrial customers.
The most significant detractors from the Portfolio's relative performance in the quarter were GeneDx, Figure Technology, and Alphatec Holdings.
GeneDx is a provider of genomic testing and diagnostics, using advanced sequencing technology to help clinicians diagnose rare diseases and inform treatment decisions. After more than doubling in the back half of 2025, shares underperformed during the quarter as investors digested gains and near-term expectations reset. While the company continues to report solid revenue growth and improving profitability, some variability in testing volumes and reimbursement dynamics created modest uncertainty. Additionally, broader volatility across high-growth healthcare names weighed on sentiment despite continued progress in execution.
Figure Technology is a fintech company leveraging blockchain infrastructure to originate, service, and finance consumer loans, with a primary focus on home equity products. Its platform aims to improve efficiency, lower costs, and expand access to credit through digitization and securitization. Shares lagged in the period as investor sentiment toward fintech and credit-sensitive businesses softened amid interest rate volatility and macro uncertainty. Concerns around funding conditions, loan demand, and credit performance weighed on the group more broadly. While we think Figure continues to execute on loan growth and platform expansion, the environment has led to more cautious investor expectations.
Alphatec Holdings is a medical technology company focused on spine surgery. The company has been gaining share through innovation, surgeon adoption, and a comprehensive procedural approach. During the quarter, shares declined as investors reacted to a combination of company-specific and broader healthcare factors. While revenue growth remains strong, profitability continues to lag expectations as the company invests heavily in salesforce expansion and new product launches. In addition, some concerns around procedure volumes and capital equipment demand contributed to weaker sentiment across the spine and orthopedic sector.
Consistent with the past few quarters, the Portfolio continues to have its largest absolute and relative exposure to the Industrials sector which is representative of the conviction we retain in the Electrification and Aerospace themes, as well as the more nascent theme in Military 2.0. Some of the more notable shifts in sector exposure have come over the past month in the form of adding to our exposures in Technology and reducing our exposure to Health Care. More specifically, we have found opportunities to increase exposure to Agentic AI as well as in Semis and Networking Equipment within Technology. In Health Care, our process has led us to scale back some exposures among some larger Genomics-related positions like GeneDx and Adaptive Biotechnologies (ADPT) as well as spine surgery specialist Alphatec Holdings.
We believe the small cap universe in the US is home to some of the most innovative, dynamic companies and entrepreneurs in the world. More than anything, we have found that our performance is fueled by the accelerating pace of change. Unlike rate cuts or a turn in the economic cycle, orienting around this accelerating pace of change has reliably provided us with opportunities largely irrespective of the market environment. Related, this past quarter laid bare the need for investment managers to have a means by which to deal with disruption risk. While disruption risk is not new by any means, AI has accelerated the pace by which disruption takes effect, and the software industry is contending with this right now. We came into the year with very minimal exposure to software because our process incorporates thematic and technical elements that cued us to pulling capital away in the early to middle part of 2025. But the benefit of these disciplines is not confined to aiming to protect against disruption risk—they also help identify where disruption is likely to take root, and be ready to allocate accordingly when our process calls for it. We have always sought to build a process that harnesses change and disruption to our advantage. Amidst this paradigm shift we've experienced with AI in recent years, this has only become more important for us and we expect that to continue into the future.
Thank you for your continued interest in Polen Capital and the 5Perspectives Small Growth Portfolio. Please do not hesitate to reach out with any questions.
Important Disclosures & Definitions No statement herein should be interpreted as an offer to sell or the solicitation of an offer to buy any security (including, but not limited to, any investment vehicle or separate account managed by Polen Capital). Recipients acknowledge and agree that the information contained in this commentary is not a recommendation to invest in any particular investment, and Polen Capital is not hereby undertaking to provide any investment advice to any person. This commentary is not intended for distribution to, or use by, any person or entity in any jurisdiction or country where such distribution or use would be contrary to local law or regulation. Unless otherwise stated in this commentary, the statements herein are made as of the date of this commentary and the delivery of this commentary at any time thereafter will not create any implication that the statements are made as of any subsequent date. Certain information contained herein is derived from third parties beyond Polen Capital's control or verification and involves significant elements of subjective judgment and analysis. While efforts have been made to ensure the quality and reliability of the information herein, there may be limitations, inaccuracies, or new developments that could impact the accuracy of such information. Therefore, this commentary is not guaranteed to be accurate or timely and does not claim to be complete. Polen Capital reserves the right to supplement or amend these slides at any time, but has no obligation to provide the recipient with any supplemental, amended, replacement or additional information. Any statements made by Polen Capital regarding future events or expectations are forward-looking statements and are based on current assumptions and expectations. Such statements involve inherent risks and uncertainties and are not a reliable indicator of future performance. Actual results may differ materially from those expressed or implied. It is impossible to invest directly in an index. Past performance is not indicative of future results. Source: All data is sourced from Bloomberg unless otherwise noted. All company-specific information has been sourced from company financials as of the relevant period discussed. The Global Industry Classification Standard ("GICS") was developed by and is the exclusive property and a service mark of MSCI Inc. (MSCI) ("MSCI") and Standard & Poor's (SPGI), a division of The McGraw-Hill Companies, Inc. ("S&P") and is licensed for use by Polen Capital Management, LLC. Neither MSCI, S&P nor any third party involved in making or compiling the GICS or any GICS classifications makes any express or implied warranties or representations with respect to such standard or classification (or the results to be obtained by the use thereof), and all such parties hereby expressly disclaim all warranties of originality, accuracy, completeness, merchantability and fitness for a particular purpose with respect to any of such standard or classification. Without limiting any of the foregoing, in no event shall MSCI, S&P, any of their affiliates or any third party involved in making or compiling the GICS or any GICS classifications have any liability for any direct, indirect, special, punitive, consequential or any other damages (including lost profits) even if notified of the possibility of such damages. Definitions: Contribution to relative return: a measure of a security's contribution to the relative return of a portfolio versus its benchmark index. The calculation can be approximated by the below formula, taking into account purchases and sales of the security over the measurement period. Please note this calculation does not take into account transactional costs and dividends of the benchmark, as it does for the portfolio. Contribution to relative return of Stock A = (Stock A portfolio weight (%) - Stock A benchmark weight (%)) x (Stock A return (%) - Aggregate benchmark return (%)). All company-specific information has been sourced from company financials as of the relevant period discussed. GIPS Report Polen Capital Management5Perspectives Small Growth Composite—GIPS Composite Report Performance % as of 12-31-2025: (Annualized returns are presented for periods greater than one year) ¹ N/A - There are five or fewer accounts in the composite the entire year. Polen Capital Management, LLC acquired the composite in June 2025; however, firm assets presented reflect those of Polen Capital Management, LLC for all periods. Total assets and UMA assets are supplemental information to the GIPS Composite Report. While pitch books are updated quarterly to include composite performance through the most recent quarter, we use the GIPS Report that includes annual returns only. To minimize the risk of error we update the GIPS Report annually. This is typically updated by the end of the first quarter. GIPS Report The Polen 5Perspectives Small Growth Composite created on July 1, 2025 with inception date November 1, 2000 contains fully discretionary small cap equity accounts that are not managed within a wrap fee structure and for comparison purposes is measured against Russell 2000 Growth Index. Performance shown represents results achieved at prior firms. The Polen 5Perspectives Small Growth strategy ((the "Strategy")) began in November 2000 and was managed by Cupps Capital until October 2016 at which time it was transitioned to Advisory Research Investment Management. In March 2024, it transitioned to Bosun Asset Management, and subsequently in June 2025, it transitioned to Polen Capital. Andrew Cupps has served as the portfolio manager of the Strategy since inception. Mr. Cupps has been supported in his role as portfolio manager by various individuals, including Kevin Leitner and Chris Bush. Mr. Leitner has worked on the Strategy since inception. Mr. Bush began working on the Strategy in 2007. At all times during his tenure as portfolio manager, Mr. Cupps has had ultimate decision-making authority with respect to the Strategy. Mr. Cupps, Mr. Leitner and Mr. Bush joined Polen Capital on June 30, 2025. Polen Capital Management, LLC claims compliance with the Global Investment Performance Standards ((GIPS®)) and has prepared and presented this report in compliance with the GIPS standards. Polen Capital Management, LLC has been independently verified for the periods April 1, 1992 through December 31, 2024. The verification reports are available upon request. A firm that claims compliance with the GIPS standards must establish policies and procedures for complying with all the applicable requirements of the GIPS standards. Verification provides assurance on whether the firm's policies and procedures related to composite and pooled fund maintenance, as well as the calculation, presentation, and distribution of performance, have been designed in compliance with the GIPS standards and have been implemented on a firm-wide basis. Verification does not provide assurance on the accuracy of any specific performance report. Polen Capital Management is an independent registered investment adviser. Polen Capital Management maintains related entities which together invest exclusively in equity portfolios consisting of high-quality companies. A list of all composite and pooled fund investment strategies offered by the firm, with a description of each strategy, is available upon request. In July 2007, the firm was reorganized from an S-corporation into an LLC and changed names from Polen Capital Management, Inc. to Polen Capital Management, LLC. Results are based on fully discretionary accounts under management, including those accounts no longer with the firm. Effective July 1, 2025 composite policy requires the temporary removal of any portfolio incurring a client initiated significant net cash inflow or outflow of 10% or greater of portfolio assets, provided, however, if invoking this policy would result in all accounts being removed for a month, this policy shall not apply for that month. The U.S. Dollar is the currency used to express performance. Effective December 2025 the composite's name was changed from Polen U.S. Small Cap Growth Composite. Returns are presented gross and net of fees and include the reinvestment of all income. During certain periods of the track record, net of fee performance was calculated using actual management fees, while the highest fee was used during others. Beginning, October 31, 2016, net of fee performance is being calculated using highest fee. Prior period net of fee performance was calculated using actual management fees plus fund expenses ((where applicable)). After July 1, 2025, net of fee performance was calculated using either actual management fees or highest fees for fund structures. The annual composite dispersion presented is an asset-weighted standard deviation using returns presented gross of management fees calculated for the accounts in the composite the entire year. Policies for valuing portfolios, calculating investments, and preparing GIPS Reports are available upon request. The separate account management fee schedule is as follows: Institutional: Per annum fees for managing accounts are 100 basis points ((1.00%)) on the first $10 Million; 90 basis points ((0.90%)) on the next $40m of assets and 80 basis points ((0.80%)) on the balance of assets under management. Past performance does not guarantee future results and future accuracy and profitable results cannot be guaranteed. Performance figures are presented gross and net of fees and have been calculated after the deduction of all transaction costs and commissions. Portfolio returns are net of all foreign non-reclaimable withholding taxes. Reclaimable withholding taxes are reflected as income if and when received. Polen Capital is an SEC registered investment advisor and its investment advisory fees are described in its Form ADV Part 2A. The advisory fees will reduce clients' returns. The chart below depicts the effect of a 1% management fee on growth of one dollar over a 10 year period at 10% (9% after fees) and 20% (19% after fees) assumed rates of return. The Russell 2000® Growth Index is a market capitalization weighted index that measures the performance of the small-cap growth segment of the U.S. equity universe. It includes Russell 2000® Index companies with higher price to book ratios and higher forecasted growth values. The index is maintained by the FTSE Russell, a subsidiary of the London Stock Exchange Group. It is impossible to invest directly in an index. The performance of an index does not reflect any transaction costs, management fees, or taxes. The information provided in this document should not be construed as a recommendation to purchase or sell any particular security. There is no assurance that any securities discussed herein will remain in the composite or that the securities sold will not be repurchased. The securities discussed do not represent the composite's entire portfolio. Actual holdings will vary depending on the size of the account, cash flows, and restrictions. It should not be assumed that any of the securities transactions or holdings discussed will prove to be profitable, or that the investment recommendations or decisions we make in the future will be profitable or will equal the investment performance of the securities discussed herein. A complete list of our past specific recommendations for last year is available upon request. GIPS® is a registered trademark of CFA Institute. CFA Institute does not endorse or promote this organization, nor does it warrant the accuracy or quality of the content contained herein.
This commentary is very limited in scope and is not meant to provide comprehensive descriptions or discussions of the topics mentioned herein. Moreover, this commentary has been prepared without taking into account individual objectives, financial situations or needs. As such, this commentary is for informational discussion purposes only and is not to be relied on as legal, tax, business, investment, accounting or any other advice. Recipients of this commentary should seek their own independent financial advice. Investing involves inherent risks, and any particular investment is not suitable for all investors; there is always a risk of losing part or all of your invested capital.
The Russell 2000® Growth Index is a market capitalization weighted index that measures the performance of the small-cap growth segment of the U.S. equity universe. It includes Russell 2000® Index companies with higher price/book ratios and higher forecasted growth values. The index is maintained by the FTSE Russell, a subsidiary of the London Stock Exchange Group. The performance of an index does not reflect any transaction costs, management fees, or taxes.
Year End Total($Millions) UMA Firm Composite Assets Annual Performance Results 3 Year Standard Deviation Assets($Millions) Assets($Millions) U.S. Dollars($Millions) Number ofAccounts CompositeGross (%) CompositeNet (%) Russell2000Growth(%) CompositeDispersion ¹(%) CompositeGross (%) Russell2000Growth(%) 2024 52,943 21,135 31,808 48 5 60.17 58.69 15.15 N/A 28.31 23.99 2023 58,910 22,269 36,641 89 4 19.73 18.60 18.66 N/A 26.88 21.79 2022 48,143 18,053 30,090 87 4 -38.31 -38.93 -26.36 N/A 31.66 26.20 2021 82,683 28,884 53,799 106 4 19.06 17.94 2.83 N/A 27.35 23.07 2020 59,079 20,662 38,417 103 4 88.58 86.86 34.63 N/A 30.00 25.10 2019 34,723 12,681 22,042 103 4 37.85 36.56 28.48 N/A 21.61 16.37 2018 20,577 7,867 12,710 114 7 11.59 10.53 -9.31 0.3 21.12 16.46 2017 14,534 4,084 10,450 167 8 32.29 31.06 22.17 0.2 15.19 14.59 2016 6,554 0 6,554 215 9 -6.44 -7.15 11.32 0.1 19.83 16.67 2015 6,265 0 6,265 535 7 -8.91 -9.57 -1.38 0.0 19.31 14.95
1 Yr 5 Yr 10 Yr Inception Polen 5Perspectives Small Growth (Gross) 26.34 12.22 20.37 11.76 Polen 5Perspectives Small Growth (NET) 25.10 11.14 19.26 10.37 Russell 2000 Growth 13.01 3.18 9.57 6.78
Return 1 Year 2 Years 3 Years 4 Years 5 Years 6 Years 7 Years 8 Years 9 Years 10 Years 10% 1.10 1.21 1.33 1.46 1.61 1.77 1.95 2.14 2.36 2.59 9% 1.09 1.19 1.30 1.41 1.54 1.68 1.83 1.99 2.17 2.37 20% 1.20 1.44 1.73 2.07 2.49 2.99 3.58 4.30 5.16 6.19 19% 1.19 1.42 1.69 2.01 2.39 2.84 3.38 4.02 4.79 5.69
Editor's Note: The summary bullets for this article were chosen by Seeking Alpha editors.
Editor's Note: This article covers one or more microcap stocks. Please be aware of the risks associated with these stocks.
65 Followers
此内容由惯性聚合(RSS阅读器)自动聚合整理,仅供阅读参考。 原文来自 — 版权归原作者所有。