








MicroStockHub/iStock via Getty Images
The Madison Small Cap Fund (class I) was virtually flat, up 0.10% in the first quarter versus the Russell 2000 Index (up 0.89%) and Russell 2500 Index (up 2.04%). While we slightly underperformed our benchmark, we saw encouraging signs for the Fund, with solid performance from our core positions and IT investments outperforming in a weak tech tape. New positions also contributed to relative performance in the quarter.
Stylistically, value outperformed growth within small caps, with the Russell 2000 Value Index up ~4.5% and the Russell 2000 Growth Index down almost 3% in the first quarter. The growth index pullback was mostly driven by weakness in speculative names. This is encouraging for our style as we prefer quality, profitable franchises over speculative stocks. However, volatility continues to define market, with AI disruption fears and the ripple effects from the Iran war impacting energy markets, interest rates, and sentiment daily. We don't believe either of these concerns are likely to recede promptly. We further believe market volatility will provide opportunities for patient investors.
From an attribution perspective, our Technology investments were the strongest outperformers in the quarter, driven by solid performance in our semiconductor names, despite poor performance from our software investments, mostly due to AI disruption speculation. Viavi was our strongest stock, driven by the recent acquisition of Spirent and accelerating demand from semiconductor and memory companies. We view Viavi as a key player in the AI data center ecosystem, especially since NVIDIA (NVDA) specifically calls for Viavi Test gear in its AI reference architecture. We think the company's long-term opportunity is expanding. Entegris (ENTG), FormFactor (FORM), and Power Integrations (POWI) also had strong absolute returns in Q1.
How hated was software in Q1? The iShares expanded software ETF (ticker: IGV) was down 25% in the quarter. The S&P Software Industry Index was down about 24%. Valuations contracted sharply to around 3x enterprise value-to-sales ((EV/Sales)) versus an historical averages of 7x. Vertical software solutions and seat-based models were particularly under pressure, as some investors contemplate shrinking terminal value for these models.
We continue to see opportunities in software and made several new investments as the massive selloff led to attractive valuations. We are focused on strong franchises in critical applications that we believe are much less likely to be disrupted by AI native competition. Investments like Workiva (WK) [WK], which provides compliance and regulatory software for enterprises, are much more resilient businesses than the market fears. Our conversations with WK customers give us confidence that they do not intend on ripping and replacing such a deeply integrated and important system of record any time soon, if ever.
Our investments in energy, materials, and defense had solid absolute performance in the quarter. We'd like to highlight Leonardo DRS (DRS), an investment we made in 2023. This smid-cap defense prime contractor has delivered better than expected results, driven by its electronic propulsion drive on the Columbia submarine platform, and has further opportunity in the Golden Dome initiative. The Golden Dome is a missile defense program championed by the Trump Administration to protect America's airspace using a mix of space assets to track and target incoming attacks. DRS will be a provider for missile warning satellites, the tracking portion of this program. This is a well-managed company that is benefiting from the diversification of the Department of War's procurement away from larger prime contractors with multiple opportunities to drive revenues in growing areas of US and allied defense spending.
Our worst performing sector in the first quarter was Healthcare. Our investments in drug development companies like Charles River Labs (CRL) and Medpace Holdings (MEDP) pulled back, driven by AI disruption fears. Our work suggests disruption fears are overexaggerated. Although we agree that drug development will benefit greatly from the implementation of AI tools, we disagree that this will lead to a lessening of drug development spending. We believe this efficiency will lead to more viable drug candidates and an increase in demand for clinical research services. We also believe that contract research organizations' (CROs) implementation of these tools can improve program design times, shorten trial timelines and improve clinical submissions. Larger CROs, such as Medpace and Charles River Labs, have ample resources to capture this value for both them and their clients. Despite the pullbacks, we remain enthusiastic about these investments and have selectively added to our positions.
Other notable detractors to performance in the quarter include our weakest stock, Gitlab, Inc. (GTLB) and Commvault Systems (CVLT).
Portfolio activity remained robust for the first quarter, as it was last quarter. In Q1, we bought four new stocks (ICUI, MTDR, PCOR, and SITE) and sold CHRD and GMED.
ICU Medical is a medical device company that specializes in infusion therapy, vascular access, and vital care applications. The company's main business is intravenous delivery devices, and it provides both systems and consumables associated with these pumps. The business is headquartered in San Clemente, California, and has been around for over 40 years.
ICUI's model is a sticky consumables stream that follows its equipment sale and installation. The industry is consolidated among three players, with ICUI being the smallest. ICUI has gained market share in the pumps business due to quality issues at Becton Dickinson (BDX) and underinvestment at Baxter (BAX) [BAX]. Additionally, the company's new high-volume pump has more connected features, which we believe will drive retention rates and incremental revenue. This is a boring company with a good market position and excellent cash flow that we view as well-positioned in this volatile market.
We value this opportunity at 12x earnings before interest, taxes, depreciation, and amortization (EBITDA), which blends our intrinsic value estimate to ~$200/share.
Matador Resources Company is a Delaware Basin Exploration and Production (E&P) company founded in 2003. The midstream asset is a joint venture that moves oil, gas, and water in and out of the Permian Basin. Production has grown 28% per annum since its Initial Public Offering (IPO). Matador has an entrepreneurial culture and a high level of employee ownership, with its CEO and founder, Joe Foran, personally owning ~4% of the shares. The company is an innovator in drilling design and has excellent well-based economics. The company also has Delaware-focused midstream assets, which have growing value as gas and water cuts increase in the basin.
MTDR trades at 3.3x enterprise value to earnings before interest, taxes, depreciation, and amortization ((EV/EBITDA)), and sub-3x if we consider the midstream assets, a discount to its peers and our comp group. MTDR also trades at 9.8x earnings versus 15x for the group. We view this as compelling given the hidden midstream asset and the premium nature of MTDR's acreage. Our intrinsic value estimate of $95 is based on 5x EV/EBITDA, supported by increasing free cash flow yield.
We initiated a new position in the construction management software company Procore Technologies (~$9B market cap). Procore is a "system of record" for the construction industry, connecting owners, general contractors, and specialty contractors on a single digital platform. It generates recurring revenue via a tiered subscription based on the customer's total annual construction volume (ACV). This pricing model is a powerful lever: as customers build more, Procore's revenue grows without additional sales effort. The business is characterized by high gross margins (~80%) and strong customer stickiness (95% retention rate). Procore's formidable moat stems from classic "network effects"—project collaborators are often introduced to the software by the general contractor, creating a low-cost customer-acquisition funnel. The construction industry is large and underpenetrated by digital automation, providing a long runway for compounding growth at high returns. Our intrinsic value estimate for PCOR is $95.
We initiated a new investment position in specialty distributor SiteOne Landscape Supply, the largest and only scaled consolidator in the landscape supply industry. SiteOne controls 18% of this $26 billion industry and has been growing revenue at a low double-digit compound annual growth rate (CAGR) over the past several years. SITE has the highest gross margins of any distributor following years of pricing initiatives (600 basis points of improvement since 2014), reflecting its defensive competitive moat and limited competition. After years of investment in sales and marketing, the company has a significant opportunity to expand its operating margin, which should help it overcome potential cyclical headwinds and drive earnings growth. Management has gained credibility in delivering on this thesis, with several quarters of margin expansion in a somewhat depressed end-market environment. The company has formidable network-effect-style moats, including a highly fragmented customer and supplier base. No single customer accounts for over 2% of sales, and the top ten customers account for less than 5% of total sales. No other competitor has the reach SiteOne has built, making it the most important intermediary for suppliers and buyers alike. SITE's breadth of offerings and purchasing power makes them an invaluable resource for local landscapers and suppliers. Management has a solid track record in mergers and acquisitions (M&A). Their network-effect moat is amplified through M&A, as scale begets scale. SiteOne is 3x the size of its nearest competitor and larger than numbers 2-10 combined. We conservatively estimate the intrinsic value to be $160.
We sold our position in CHRD to focus on MTDR. We have high regard for CHRD and its management team and believe the company remains very attractively valued, but we view the swap into MTDR as more compelling given its more premium acreage, deeper inventory position, and higher gas/midstream exposure. The company remains at a significant discount to our intrinsic value estimate.
We liquidated our position in Globus Medical after a multi-year period. The company has successfully integrated its Nuvasive acquisition and continues to show successful adoption of its industry-leading robotics platform. The success has driven GMED's market cap to $12B, thus we elected to sell and focus on smaller alternatives. Our most recent intrinsic value estimate was $85 versus the current price of $90/share.
Investors have shown an increase in appetite for hard assets and some of the air has been taken out of the speculative market that was so difficult for us in 2025. We think this is in our favor. We've taken advantage of the pullback in software and invested in several out-of-favor names, and we are looking at more. We also continue to see value in housing-related businesses, even though the weakness in housing demand continues. We believe that we will eventually see some improvement in this area of the economy after the past four years of contraction. Our investments here are in durable businesses, which have done an admirable job of controlling expenses and driving efficiencies. We see further opportunities in materials and perhaps energy, although we are always cautious in these more cyclical industries.
All in all, we expect more volatility in 2026. It's difficult for us to see how the United States easily extricates itself from the Iran war. Both President Trump and the American people's appetite for this conflict appear lean, but any pullback is unlikely to resolve the disrupted energy infrastructure of the region and could worsen it. Thus, we expect energy will remain a pain point for companies and a headwind to interest rates. We haven't yet seen a softening in the labor market, but given the AI disruption and the higher input costs, the summer could be challenging for the consumer. We are keeping an eye on the private credit woes ripping through institutional asset managers, as well. And finally, we have a midterm election in the fourth quarter, which always drives volatility.
We said in our fourth quarter letter that all speculative markets eventually run out of steam, and we believe we are seeing some signs of that. We think this is an environment where we can add value by being thoughtful and opportunistic.
Respectfully,
Faraz Farzam | Aaron Garcia
Performance data shown represents past performance. Investment returns and principal value will fluctuate, so that fund shares, when redeemed, may be worth more or less than the original cost. Past performance does not guarantee future results and current performance may be lower or higher than the performance data shown. Visit Madison Funds or call 800.877.6089 to obtain performance data current to the most recent month-end. Tickers Portfolio Management Faraz Farzam, CFAPortfolio Manager, AnalystIndustry since 1999 Aaron Garcia, CFAPortfolio Manager, AnalystIndustry since 2002 Software vs. S&P 500 Index Although the information in this report has been obtained from sources that the firm believes to be reliable, we do not guarantee its accuracy, and any such information may be incomplete or condensed. All opinions included in the report constitute the authors' judgment as of the date of this report and are subject to change without notice. This report is for informational purposes only and is not intended as an offer or solicitation with respect to the purchase or sale of any security and is not investment advice. Madison Asset Management, LLC does not provide investment advice directly to shareholders of the Madison Funds. Opinions stated are informational only and should not be taken as investment recommendation or advice of any kind whatsoever (whether impartial or otherwise). Why Madison Small Cap Fund? High-quality portfolio of quality, durable, and growing small companies Concentrated portfolio with a flexible mandate ($100M to $15B market cap) Proprietary Risk Portal and valuation discipline framework help manage downside risk Performance data shown represents past performance. Investment returns and principal value will fluctuate, so that fund shares, when redeemed, may be worth more or less than the original cost. Past performance does not guarantee future results and current performance may be lower or higher than the performance data shown. Visit Madison Funds or call 800.877.6089 to obtain performance data current to the most recent month-end. Sector Allocation (%) 5-Year Risk Metrics (%) - Class Y 5-Year Risk Metrics (%) - Class Y Investment Objective The Madison Small Cap Fund seeks long-term capital appreciation. Expense ratios are based on the fund's most recent prospectus. Fund Characteristics Portfolio Management Faraz Farzam, CFAPortfolio Manager, AnalystIndustry since 1999 Aaron Garcia, CFAPortfolio Manager, AnalystIndustry since 2002 Top 10 Holdings (%) Shareholder Services Madison FundsP.O. Box 219083Kansas City, MO 64121-9083800.877.6089 Consultant andAdvisor Services 550 Science DriveMadison, WI 53711888.971.7135 This material is authorized for use only when preceded or accompanied by the current prospectus. Before investing, please fully consider the investment objectives, risks, charges and expenses of the fund. This and other important information is contained in the current prospectus, which you should carefully read before investing or sending money. For more complete information about Madison Funds® obtain a prospectus from your financial adviser, by calling 800.877.6089 or by visiting Madison Funds to view or download a copy. Performance results prior to August 30, 2019 for the Class Y shares are based on the performance of the Predecessor Fund, which was reorganized into the Class Y shares of the Fund on August 30, 2019. Performance for Class A shares was deemed to be new effective August 31, 2019 as a result of the reorganization. Madison waived 0.04% of the Fund's annual services fee from August 31, 2019 through February 27, 2021. Investment returns reflect this fee waiver, without which returns would have been lower. Madison lists the performance of the Predecessor Fund and accounting survivor of the Reorganization for the following reasons: Continuity of Fund portfolio managers through the Reorganization; Substantially the same investment objective and investment strategies between the Fund and the Predecessor Fund; Substantially similar investment policies between the Fund and the Predecessor Fund; A similar expense ratio (excluding acquired fund fees and expenses). Madison Asset Management, LLC does not provide investment advice directly to shareholders of the Madison Funds. Madison Funds are distributed by MFD Distributor, LLC, member of FINRA. Portfolio data is as of the date of this piece unless otherwise noted and holdings are subject to change. "Madison" and/or "Madison Investments" is the unifying tradename of Madison Investment Holdings, Inc., Madison Asset Management, LLC ("MAM"), and Madison Investment Advisors, LLC ("MIA"). MAM and MIA are registered as investment advisers with the U.S. Securities and Exchange Commission. Madison Funds are distributed by MFD Distributor, LLC. MFD Distributor, LLC is registered with the U.S. Securities and Exchange Commission as a broker-dealer and is a member firm of the Financial Industry Regulatory Authority. The home office for each firm listed above is 550 Science Drive, Madison, WI 53711. Madison's toll-free number is 800-767-0300. Any performance data shown represents past performance. Past performance is no guarantee of future results. This report is for informational purposes only and is not intended as an offer or solicitation with respect to the purchase or sale of any security and is not investment advice. Non-deposit investment products are not federally insured, involve investment risk, may lose value and are not obligations of, or guaranteed by, any financial institution. Investment returns and principal value will fluctuate. An investment in the Fund is subject to risk and there can be no assurance the Fund will achieve its investment objective. The risks associated with an investment in the Fund can increase during times of significant market volatility. The principal risks of investing in the Fund include mid cap risk, equity risk, growth and value risks, capital gains realization risks to taxpaying shareholders, foreign security and emerging market risk, depository receipt risk, and market risk. Investing in small, mid-size or emerging companies involves greater risks not associated with investing in more established companies, such as business risk, significant stock price fluctuations and illiquidity. More detailed information regarding these risks can be found in the Fund's prospectus. Upon request, Madison may furnish to the client or institution a list of all security recommendations made within the past year. Indices are unmanaged. An investor cannot invest directly in an index. They are shown for illustrative purposes only, and do not represent the performance of any specific investment. Index returns do not include any expenses, fees or sales charges, which would lower performance. Russell 2000 Index: small cap market index that measures the performance of the smallest 2,000 companies in the Russell 3000® Index. Russell 2500 Index: broad index, featuring 2,500 stocks that cover the small and mid-cap market capitalizations of the U.S. equity universe. Russell Investment Group is the source and owner of the trademarks, service marks and copyrights related to the Russell Indexes. Russell® is a trademark of Russell Investment Group. EPS Growth (Trailing 3-yr): the annual rate at which a company's earnings have grown over the past three years. Price-to-Earnings Ratio: measures how expensive a stock is. It is calculated by the weighted average of a stock's current price divided by the company's earnings per share of stock in a portfolio. Portfolio Turnover: a measure of the trading activity in an investment portfolio—how often securities are bought and sold by a portfolio. Active Share: the percentage of a portfolio that differs from its benchmark index. It can range from 0% for an index fund that perfectly mirrors its benchmark to 100% for a portfolio with no overlap with an index. Wtd Avg. Market Cap: the size of the companies in which the fund invests. Market capitalization is calculated by the number of a company's shares outstanding times its price per share. Standard Deviation: a statistical measurement of dispersion about an average, which, for a portfolio, depicts how widely the returns varied over a certain period of time. Investors may use the standard deviation of historical performance to understand the range of returns for a portfolio. When a portfolio has a higher standard deviation than its benchmark, it implies higher relative volatility. Standard deviation has been calculated using the trailing monthly total returns for the appropriate time period. The standard deviation values are annualized. Upside Capture Ratio: a fund's performance in up markets relative to its benchmark. The security's upside capture return is divided by the benchmark's upside capture return over the time period. Downside Capture Ratio: a fund's performance in down markets relative to its benchmark. The security's downside capture return is divided by the benchmark's downside capture return over the time period. Beta: a measure of the fund's sensitivity to market movements. A portfolio with a beta greater than 1 is more volatile than the market, and a portfolio with a beta less than 1 is less volatile than the market.
Class R6: (MSCRX) Class I: (MSCIX) Class Y: (BVAOX) Class A: (MASMX) 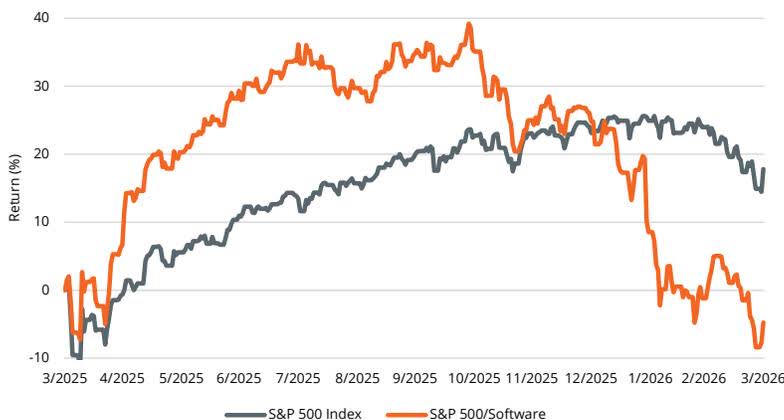
Average Annual Total Returns ¹,² (%) 3-Months YTD 1-Year 3-Year 5-Year 10-Year Since Inception Class R6 0.10 0.10 2.38 7.75 -- -- 2.08 Class I 0.10 0.10 2.29 7.67 1.19 -- 1.74 Class Y 0.10 0.10 2.19 7.58 1.07 7.68 11.93 Class A without sales charge 0.00 0.00 1.94 7.31 0.83 -- 7.55 Class A with sales charge -5.76 -5.76 -3.88 5.20 -0.36 -- 6.59 Russell 2000 0.89 0.89 25.72 13.05 3.77 9.88 -- Russell 2500 2.04 2.04 23.45 13.25 5.48 10.58 --
Calendar Year Returns ¹,² (%) 2016 2017 2018 2019 2020 2021 2022 2023 2024 2025 Class Y 18.04 8.90 -12.09 24.67 23.09 20.52 -24.36 16.05 21.94 -7.12 Russell 2000 21.31 14.65 -11.01 25.52 19.96 14.82 -20.44 16.93 11.54 12.81 Russell 2500 17.59 16.81 -10.00 27.77 19.99 18.18 -18.37 17.42 12.00 11.91 
Madison R2000 Standard Deviation 17.17 19.98 Up Capture 77.47 100.00 Down Capture 85.10 100.00 Beta 0.80 1.00
Madison R2500 Standard Deviation 17.17 18.67 Up Capture 79.37 100.00 Down Capture 93.18 100.00 Beta 0.88 1.00
Class Ticker Inception Exp. Ratio R6 MSCRX 02/28/22 0.92% I MSCIX 02/26/21 1.00% Y BVAOX 12/16/96 1.10% A MASMX 08/31/19 1.35%
Number of Holdings 49 EPS Growth Rate (Trailing 3-Year, %) 8.14 Price/Earnings Ratio (Trailing 1-Year) 25.20 Price/Earnings Ratio (Forward 1-Year) 17.16 Annual Portfolio Turnover (%) 35.00 Active Share vs. R2000 (%) 97.40 Active Share vs. R2500 (%) 96.83 Wtd. Avg. Market Cap ($ billions) 5.88 Net Assets ($ millions) 146.53 Distribution Frequency Annual
ENCOMPASS HEALTH CORP (EHC) 4.14 POWER INTEGRATIONS INC 3.10 SCOTTS MIRACLE GRO CO (SMG) 3.74 SHAKE SHACK INC CLASS A (SHAK) 3.00 CORE + MAIN INC CLASS A (CNM) 3.35 HEALTHEQUITY INC (HQY) 2.98 HAYWARD HOLDINGS INC (HAYW) 3.31 CARLISLE COS INC (CSL) 2.65 KNOWLES CORP (KN) 3.12 OPTION CARE HEALTH INC (OPCH) 2.57
Editor's Note: The summary bullets for this article were chosen by Seeking Alpha editors.
Editor's Note: This article covers one or more microcap stocks. Please be aware of the risks associated with these stocks.
此内容由惯性聚合(RSS阅读器)自动聚合整理,仅供阅读参考。 原文来自 — 版权归原作者所有。