






Pavel Kot/iStock via Getty Images
State Street SPDR Portfolio S&P Sector Neutral Dividend ETF (SPDG) was launched on 9/11/2023 and tracks the S&P Sector-Neutral High Yield Dividend Aristocrats Index. SPDG has a portfolio of 278 stocks, a 30-day SEC yield of 2.86% at the time of writing, and an expense ratio of 0.05%. Dividends are paid quarterly. Currently, it is a very small and thinly traded ETF, with $12 million of AUM (assets under management) and an average daily dollar volume of $53 thousand. The sponsor State Street Corp. (STT) is a major financial services and bank holding company. Its asset management division, Global Advisors, has over $5 trillion in assets under management.
As described by S&P Global, the methodology starts from the S&P Composite 1500 Index. Eligible stocks must have at least:
The median IAD yield of eligible stocks is calculated for each GICS sector. Stocks with an IAD yield superior to the sector median are included in the index. The index is reconstituted annually and rebalanced quarterly.
The portfolio turnover rate was 32% in the most recent fiscal year. This article will use as a benchmark the parent index S&P 1500, represented by State Street SPDR Portfolio S&P 1500 Composite Stock Market ETF (SPTM).
The portfolio is almost exclusively invested in U.S. companies (98% of asset value), mostly large caps (69%), and with a focus on technology (33%). Other sectors are below 13%. The sector breakdown is very close to that of the parent index, in accordance with the "sector neutral" methodology.
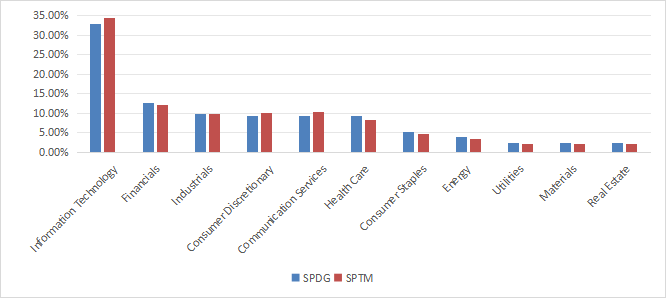
SPDG sector breakdown (Chart: author; data: State Street)
The fund is quite concentrated, but company-specific risk is contained. The top 10 holdings, listed in the next table, represent 38.6% of assets, and the largest position weighs 6.3%.
Name Ticker %Weight Cisco Systems, Inc. 6.29 Verizon Communications Inc. 6.03 Texas Instruments Incorporated 4.30 QUALCOMM Incorporated 4.10 International Business Machines Corporation 4.06 Analog Devices, Inc. 3.38 The Home Depot, Inc. 3.25 Comcast Corporation 2.60 Corning Incorporated 2.34 Accenture plc 2.26
The fund is classified by Morningstar in the Large Value category, which is confirmed by the metrics reported in the next table. SPDG is significantly cheaper than SPTM based on valuation ratios and has lower growth rates. Current metrics are as follows for illustration purposes against SPTM (of course, these will change over time).
SPDG SPTM P/E TTM 18.89x 26.36x Price/Book 2.93x 4.77x Price/Sales 2.14x 3.19x Price/Cash Flow 12.31x 18.71x Earnings growth 3.11% 18.01% Sales growth % 4.01% 6.76% Cash flow growth % 4.98% 10.36%
Data: Fidelity.
Portfolio composition and metrics are given as an example from 5/8/2026. They may have changed by the time you read this.
SPDG has underperformed SPTM by 2.6% annualized from 9/18/2023 to 5/8/2026, with a shallower maximum drawdown and lower volatility. The gap in Sharpe ratio (a measure of risk-adjusted performance) is insignificant.
Total Return Annual.Return Drawdown Sharpe ratio Volatility SPDG 60.44% 19.57% -15.67% 1.31 12.09% SPTM 69.97% 22.21% -18.87% 1.33 13.06%
Data: Portfolio123.
The fund is 5.6% behind the benchmark over the 12 months prior to 5/8/2026, once again with lower risk metrics.
12 months Total Return Annual.Return Drawdown Sharpe ratio Volatility SPDG 12.94% 12.95% -14.92% 1.08 8.57% SPTM 16.50% 16.51% -18.69% 1.25 11.43%
Most value and dividend funds have underperformed their benchmarks for over a decade. It is not a deal breaker: the value investing style is likely to shine again at some point in the market cycle.
Quarterly distributions have been stable since June 2025, after increasing from March 2024.
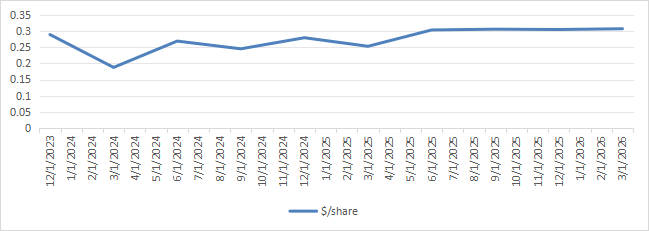
Distribution history (Chart: author; data: State Street)
The next table compares characteristics of SPDG and five of the largest dividend growth ETFs:
This list is not intended to be exhaustive.
SPDG VIG SCHD DGRO DGRW NOBL Inception 09/11/2023 04/21/2006 10/19/2011 06/10/2014 05/22/2013 10/08/2013 Expense Ratio 0.05% 0.04% 0.06% 0.08% 0.28% 0.35% AUM $12.07 million $105.78. billion $90.51 billion $39.35 billion $16.60 billion $11.13 billion Avg Daily Volume $53.11 thousand $296.39 million $736.52 million $167.72 million $102.13 million $81.29 million Holdings 281 335 102 395 200 70 Top 10 38.61% 32.08% 42.18% 26.47% 38.84% 17.52% Turnover 32.00% 8.00% 30.00% 25.00% 35.00% 20.00% Yield TTM 2.74% 1.51% 3.34% 2.01% 1.31% 2.12% Total Return* 60.44% 48.28% 42.77% 50.62% 50.34% 22.66% Annual.Return* 19.57% 16.06% 14.41% 16.75% 16.67% 8.03% Drawdown* -15.67% -14.95% -16.13% -14.03% -16.21% -15.36% Sharpe ratio* 1.31 1.2 0.88 1.29 1.15 0.48 Volatility* 12.09% 10.64% 13.45% 10.56% 11.16% 12.68%
*Calculated with Portfolio123 from 9/18/2023.
SPDG has one of the lowest expense ratios and is the best performer since September 2023. Outperformance is partly due to the sector-neutral methodology, which results in SPDG significantly overweighting technology versus peers (except DGRW, which has 30% of assets in this sector).
State Street SPDR Portfolio S&P Sector Neutral Dividend ETF (SPDG) has a portfolio of 278 stocks with a history of growing dividends. The sector-neutral methodology keeps sector allocation close to its parent index, the S&P 1500. SPDG has lagged the benchmark but outperformed key competitors since its inception in 2023. Based on its good start compared to peers, SPDG would be a compelling alternative to the popular ETFs VIG and SCHD in the dividend growth style. However, its very low AUM and liquidity raise the question of its utility and long-term potential.
This article answers these three main questions about SPDG:
此内容由惯性聚合(RSS阅读器)自动聚合整理,仅供阅读参考。 原文来自 — 版权归原作者所有。