








Lemon_tm/iStock via Getty Images
Our key belief is that competitively advantaged businesses that can invest at high rates of Return on Invested Capital (ROIC), run by capable management teams and are attractively valued have the ability to generate attractive shareholder returns over our investment horizon.
Global equity markets continued to experience ongoing volatility and uncertainty in the first quarter of 2026, driven by a sell-off in sectors perceived to be impacted by AI, geopolitical tensions including the Iran war that recently started in February, as well as continuing trade policy shifts. Amidst all this, investors exhibited heightened sensitivity to short-term market signals. We invest using a bottom-up approach, focusing on a company's long-term fundamentals such as competitive position and operating metrics as well as resilience as defined by the ability to hold up well in many different environments.
We believe we have little ability to time and position for unexpected macro shocks but have re-underwritten our investments across perceived “AI losers” during the quarter and see exceptional value in a number of heavily beaten-up investments. We have approximately 20% exposure to these perceived “AI losers.” These include travel IT-related businesses like Amadeus IT (AMADY) and Booking (BKNG), credit bureau Experian (EXPGY), media distribution in UMG (UNVGY), global software leadership with SAP (SAP), information and decision-making software provider Wolters Kluwer (WTKWY) and financial market infrastructure company London Stock Exchange Group (LNSTY). We also have exposure to two strong and clearly recognized AI beneficiaries, TSMC (TSM) and ASML (ASML), at approximately 8% of NAV as of March 31, 2026. Strong positive contribution further came from our exposure to exchanges Deutsche Boerse (DBOEY) and B3, both benefiting from increased risk aversion in markets as the start of the third Gulf War increased demand for risk management tools at Deutsche Boerse, and drove up cash equity, derivatives, and interest rate trading at B3.
Besides the ongoing weakness in companies perceived to be facing AI disruption, not owning energy, as well as exposure to companies sensitive to global travel disruptions, were secondary drivers of underperformance. The energy sector delivered a performance of 28.5% during the quarter (GICS sector level, benchmark performance). Our lack of exposure to energy arises from not having found investments in this sector to date that fulfill our investment criteria,
particularly due to our inability to underwrite high and durable returns on capital over our investment horizon. This approach reflects our commitment to focusing on businesses with clear competitive advantages and predictable long-term growth potential. We saw knock-on impacts of the military conflict on investments in Safran (SAFRY), Airbus (EADSY), LVMH (LVMUY), and Richemont (CFRUY). We believe the near- and medium-term impacts for our aerospace-exposed investment in Safran to be manageable. In the near term, we would expect fewer miles flown, with a moderate impact on aftermarket spares demand. However, since spare part demand remains supply-constrained, the impact should be less significant. In the medium term, the risk of early retirement for less fuel-efficient aircraft from the CFM56 fleet increases. At this point, we do not expect the level to be above management's guidance, given the already anticipated higher level compared to what have been historical lows in retirements. While higher retirement rates could have a positive impact on demand for more fuel-efficient aircrafts, the airframers are already producing at maximum rates and remain constrained by the supply chain. For manufacturers such as Airbus, medium-term risks stem from backlog margin pressures, should the conflict continue and inflation drive costs above contractually agreed inflation escalators.
Luxury goods producers LVMH and Richemont's share prices have started to reflect concerns of a macroeconomic slowdown. As a reminder, Middle Eastern exposure is less than 10% of group sales for our luxury goods investments and despite the near term 1-2 p.p. headwind to group sales, we view the impact of the Iran war as minimal over our five to ten year plus time horizon. We are of the view that the structural moats of heritage and scale at our luxury investments, combined with excellent capital allocation and the willingness to invest for the long-term even through downcycles suggests a low risk of capital impairment. We have written about LVMH's resilience through downturns in our 2025 investment letter: Here. We would also expect a headwind for energy-importing EM countries and have exposure to the EM banking sector.
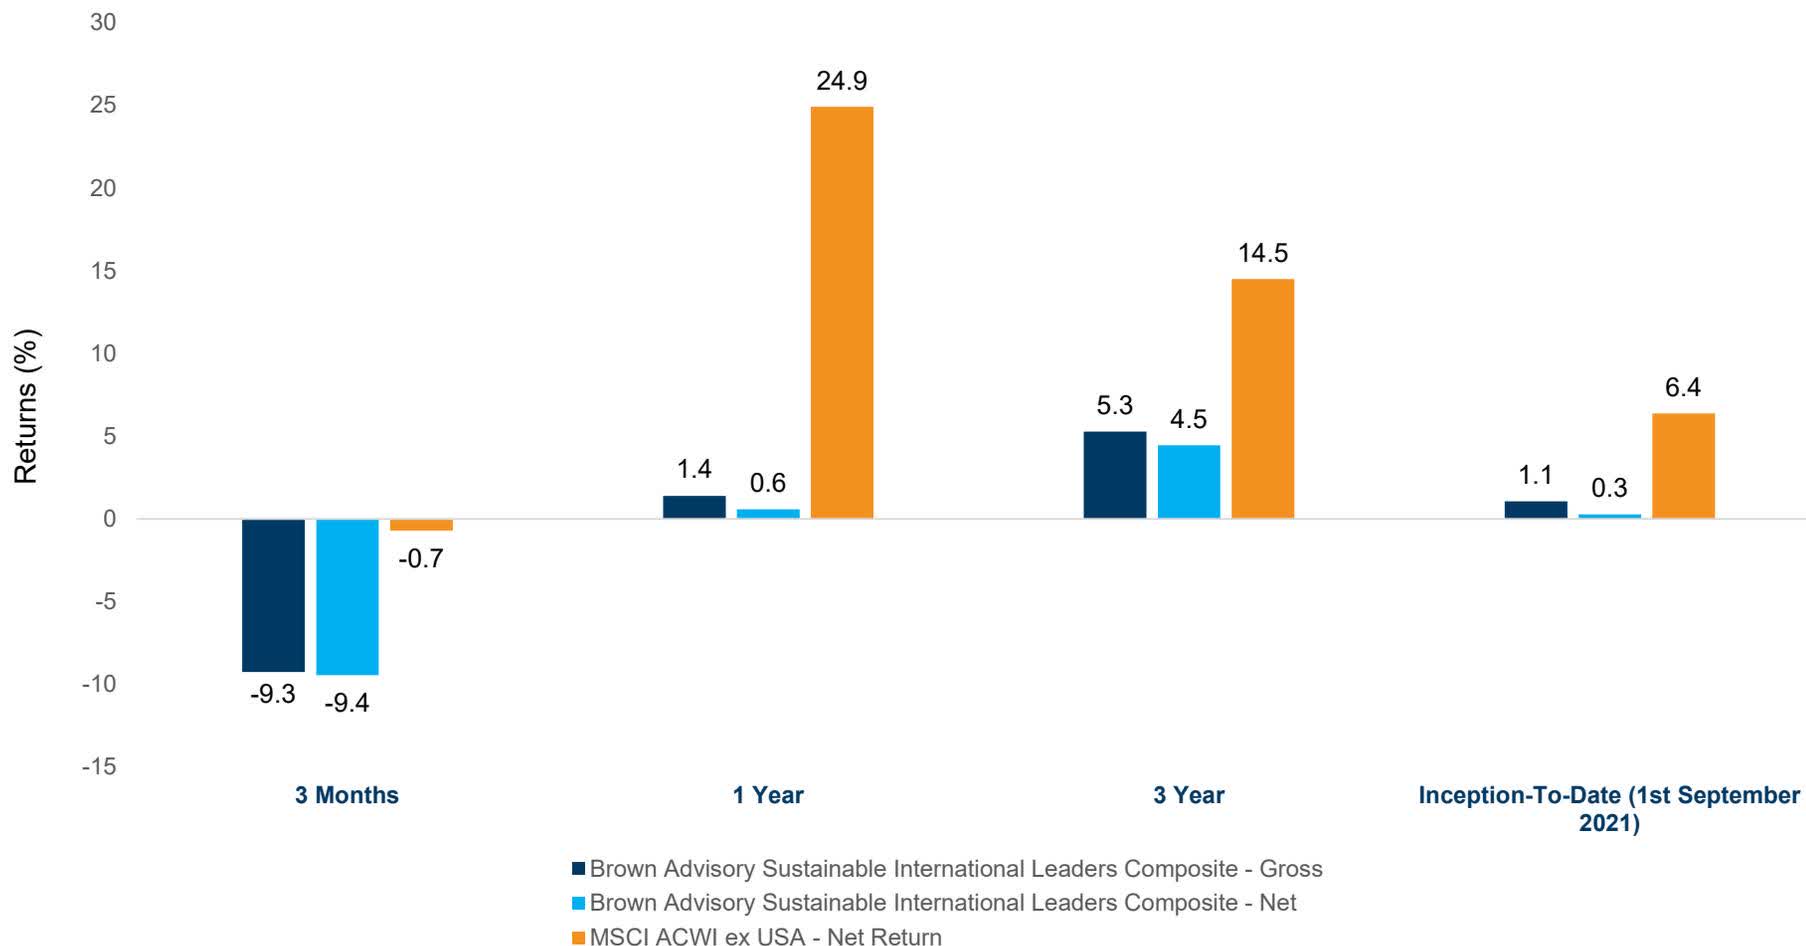
During the first quarter of 2026 the strategy corrected by 9.4%, underperforming its benchmark the MSCI ACWI ex USA Net Return Index.
The strategy made two new investments during the quarter, in fantasy miniatures producer Games Workshop (GMWXY), the creator and owner of the popular Warhammer franchise, and Nintendo (NTDOY) with its integrated hardware and software ecosystem and iconic IP such as Mario, Zelda and Pokémon.
Games Workshop is a highly profitable niche company within specialty retail, solely focused on producing fantasy miniatures and associated intellectual property (IP). We believe the company owns IP that is virtually impossible to replicate and has exposure to a highly loyal customer base, which afford them consistent volume and price growth. The company's consistent pricing power and vertically integrated model allows them to earn gross margins of ~70% and incremental margins north of 40% off a largely fixed cost base. Very little incremental capital is required in the business leading to return on capital that has averaged well north of 50% in the last decade. The recent weakness in shares provided an attractive entry point into the shares in our view. We also initiated a position in Nintendo in March. Nintendo owns a portfolio of globally iconic, multi-generational IP such as Mario, Zelda, and Pokémon (jointly owned with exclusive rights to console games). We expect backward compatibility across Switch generations, growth in digital distribution, and increasing engagement through Nintendo Switch Online to structurally improve revenue visibility, margins, and customer lifetime value over the next 3 to 5 years. Nintendo's IP remains under-monetized, in our view, with meaningful upside from expansion into films, digital content, and broader ecosystem engagement, alongside optionality from increased third-party support. This is complemented by an engaged installed base, an improving digital mix, and strong first-party software pipeline. While near-term profitability may face modest pressure from hardware economics and external factors such as higher memory costs and tariffs, the long-term margin profile should benefit from the company's transition toward a more durable, platform-centric ecosystem.
The strategy exited its investment in Japanese bike component maker Shimano (SMNEY).
Looking ahead, we are working through a full pipeline of research ideas, but most importantly, we believe that there is significant, unappreciated value in many of our portfolio holdings today. This is the result of the impact the "AI loser" narrative has had on selected investments in the portfolio as well as the risk-off sentiment driven by geopolitical events in the Middle East, offering opportunities for long-term investors. We believe the portfolio is exhibiting attractive characteristics, including a return on invested capital (ROIC) of 18.6%, three-year sales growth of 7.0%, and a free cash flow yield of 4.5% as of March 31, 2026. The quality of the strategy can be highlighted by high ROIC and low aggregate company leverage. The strategy is as of quarter end is valued at a next twelve months free cash flow yield that is more attractive than the benchmark.
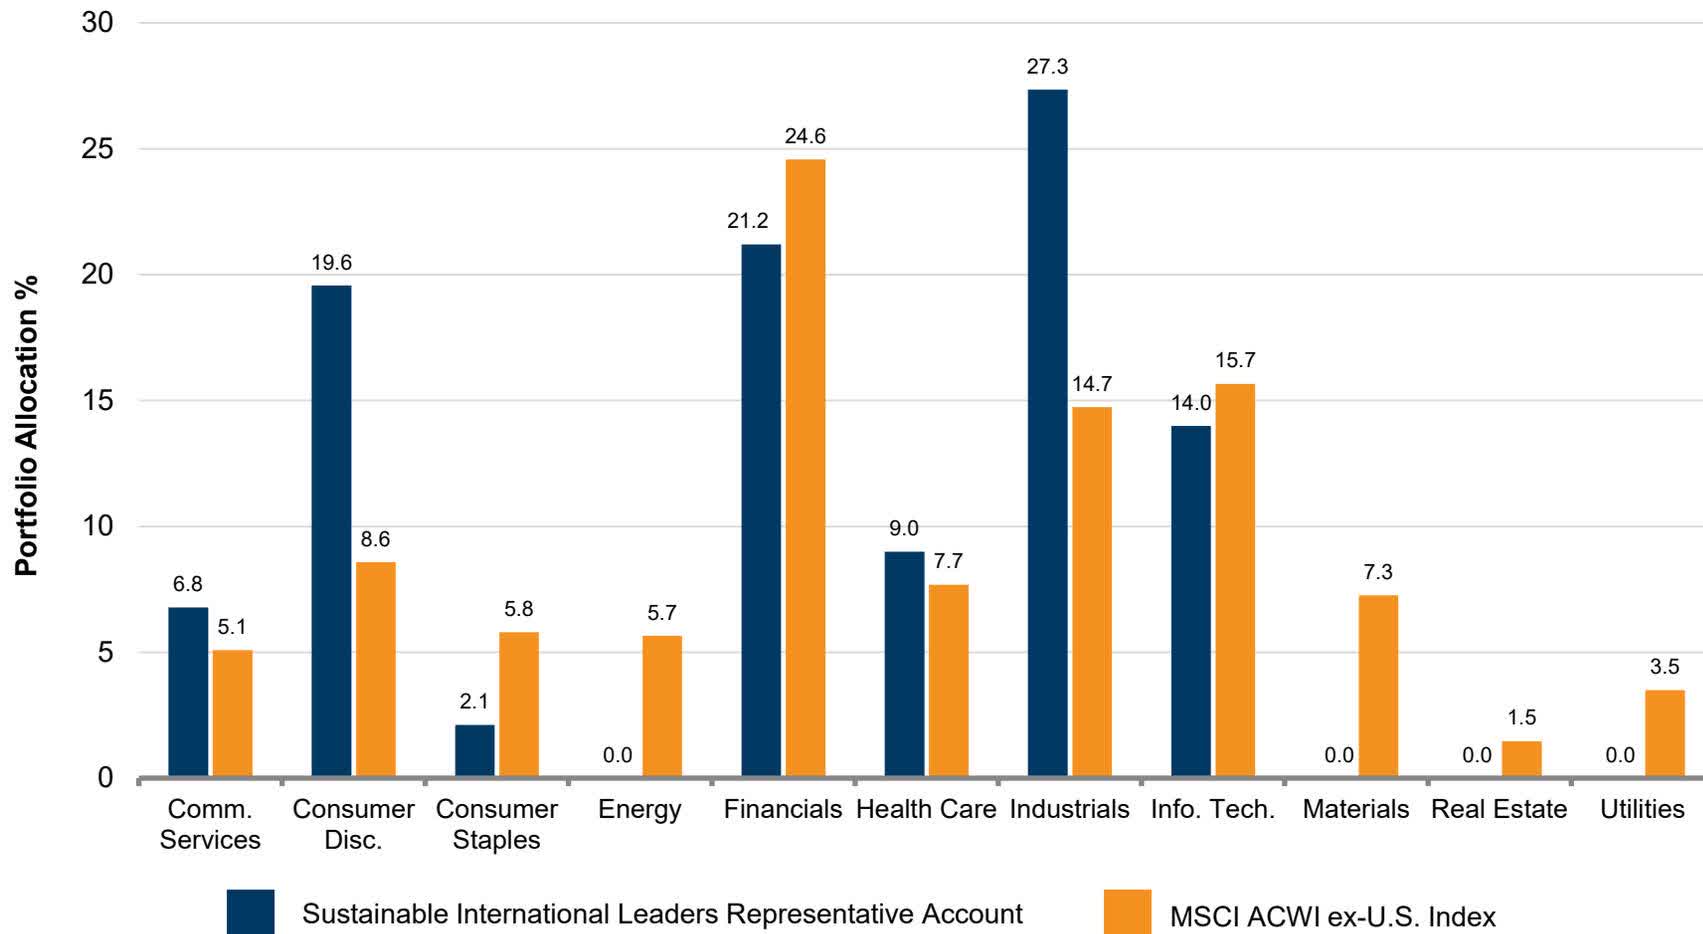
SECTOR BROWN ADVISORYSUST. INT'LLEADERS REP.ACCOUNT(%) MSCI ACWIEX-US INDEX(%) DIFFERENCE(%) BROWN ADVISORYSUST. INT'LLEADERS REP.ACCOUNT(%) BROWN ADVISORYSUST. INT'LLEADERS REP.ACCOUNT(%) Q1'26 Q1'26 Q1'26 Q4'25 Q1'25 Communication Services 6.78 5.08 1.70 7.22 2.63 Consumer Discretionary 19.57 8.58 10.99 21.22 17.04 Consumer Staples 2.11 5.80 -3.69 2.28 1.70 Energy -- 5.66 -5.66 -- -- Financials 21.21 24.58 -3.37 19.21 26.56 Health Care 8.99 7.69 1.31 8.66 7.00 Industrials 27.35 14.73 12.62 29.98 32.08 Information Technology 13.99 15.66 -1.67 11.44 13.00 Materials -- 7.26 -7.26 -- -- Real Estate -- 1.48 -1.48 -- -- Utilities -- 3.49 -3.49 -- --
SECTOR REPRESENTATIVESUST. INT'L LEADERS ACCOUNT MSCI ACWI EX-US INDEX ATTRIBUTION ANALYSIS AVERAGEWEIGHT (%) RETURN(GROSS %) AVERAGEWEIGHT (%) RETURN(GROSS %) ALLOCATIONEFFECT(GROSS %) SELECTION &INTERACTIONEFFECT(GROSS %) TOTAL EFFECT(GROSS %) Communication Services 6.86 -24.20 5.20 -9.46 -0.12 -1.17 -1.29 Consumer Discretionary 19.79 -15.55 9.12 -13.28 -1.32 -0.67 -1.99 Consumer Staples 2.35 -13.83 5.79 -2.88 0.10 -0.25 -0.14 Energy -- -- 4.72 28.53 -1.17 -- -1.17 Financials 19.69 0.46 24.68 -3.64 0.21 0.77 0.98 Health Care 8.97 -2.40 7.72 -3.10 -0.02 0.07 0.04 Industrials 29.21 -10.17 15.00 -0.18 0.18 -3.08 -2.90 Information Technology 13.13 2.73 15.80 4.58 -0.07 -0.35 -0.42 Materials -- -- 7.18 5.42 -0.41 -- -0.41 Real Estate -- -- 1.54 -4.37 0.05 -- 0.05 Utilities -- -- 3.24 9.22 -0.28 -- -0.28 Total 100.00 -8.24 100.00 -0.70 -2.85 -4.68 -7.53
Representative Sustainable International Leaders Account Top Five Contributors as Of March 31, 2026
SYMBOL NAME DESCRIPTION AVERAGE WEIGHT (%) TOTAL PORT. RETURN (%) PORT. GROSS CONTRIBUTION TO RETURN (%) BG36ZK B3 SA - Brasil, Bolsa, Balcao Provides exchange trading, clearing and other trade services 2.59 41.75 0.79 B929F4 ASML Holding NV Develops, manufactures and markets EUV & DUV lithography systems, metrology and inspection systems & related software solutions 3.42 23.26 0.53 702196 Deutsche Boerse AG Provides financial instruments trading and clearing, investment management solutions, securities and fund services 3.45 11.18 0.41 TSM Taiwan Semiconductor Manufacturing Co., Ltd. Sponsored ADR Manufactures, distributes and tests integrated circuits, silicon wafers, diodes and related semiconductor components 4.31 11.45 0.38 B4TX8S AIA Group (AAGIY) Limited Provides life and health insurance services 4.73 7.97 0.33
Representative Sustainable International Leaders Account Bottom Five Contributors as Of March 31, 2026
SYMBOL NAME DESCRIPTION AVERAGE WEIGHT (%) TOTAL PORT. RETURN (%) PORT. GROSS CONTRIBUTION TO RETURN (%) HDB HDFC Bank Limited (HDB) Sponsored ADR Provides national banking services 3.26 -31.91 -1.17 406141 LVMH Moet Hennessy Louis Vuitton SE Operates as a holding company which manufactures fashion, leather goods, watches, jewelry, perfumes, cosmetics, wines and spirits 3.12 -27.66 -0.92 B19NLV Experian PLC Provides decision analytics, marketing services, consumer services and credit services 3.31 -22.68 -0.82 588185 CTS Eventim (CEVTY) AG & Co. KGaA Engages in ticketing and live entertainment event management 1.97 -36.18 -0.82 484628 SAP SE Provides e-business software solutions 2.15 -30.01 -0.74
Representative Sustainable International Leaders Account Portfolio Activity as of march 31, 2026
SYMBOL ADDITIONS SECTOR 037184 Games Workshop Group PLC Consumer Discretionary 7974 Nintendo Co., Ltd. Communication Services
SYMBOL DELETIONS SECTOR 7309 Shimano Inc. Consumer Discretionary
Sustainable International Leaders Representative Account as Of March 31, 2026
SUSTAINABLE INTERNATIONAL LEADERS REPRESENTATIVE ACCOUNT MSCI ACWI EX-US INDEX ROIC (LFY ex. financials ¹ ) Median (%) 18.6 10.0 3 YR. growth CAGR Median (%) 7.0 6.4 FCF Yield ex. financials ¹ ((NTM Median)) (%) 4.5 4.3 Active Share 91.6 -- Net Debt to EBITDA (ex. financials ¹ ) Median ² 0.1 1.0
Sustainable International Leaders Representative Account as Of March 31, 2026
TOP 10 HOLDINGS % OF PORTFOLIO AIA Group Limited 5.2 Howden Joinery Group PLC (HWDJY) 4.6 Taiwan Semiconductor Manufacturing Co., Ltd. Sponsored ADR 4.4 Deutsche Boerse AG 4.2 Compass Group PLC (CMPGY) 4.0 Keyence Corporation (KYCCF) 3.7 London Stock Exchange Group plc 3.6 ASML Holding NV 3.5 AstraZeneca PLC (AZN) 3.4 Compagnie Financiere Richemont SA 3.4 Total 39.9
Source: FactSet ®. Top 10 Equity Holdings% of Portfolio weight calculations include cash and cash equivalents which was 0.9% as of 03/31/2026 and is provided as a Supplemental Information.
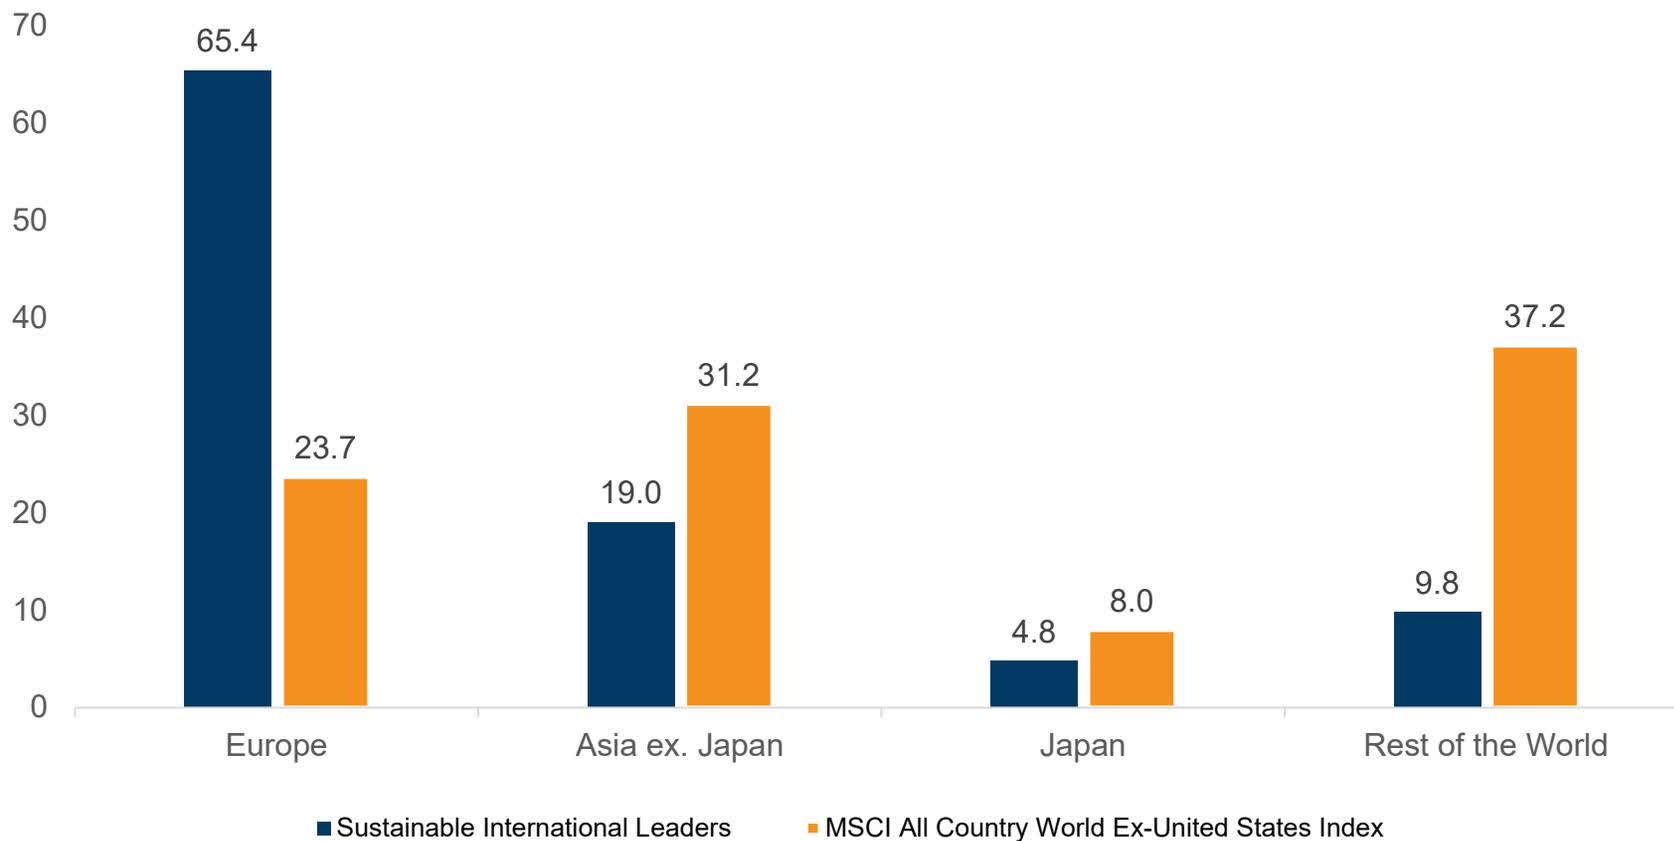
Representative Sustainable International Leaders Account as Of March 31, 2026
Global Industry Classification Standard (gics) as Of March 31, 2026
DISCLOSURES For institutional investors and professional clients only. Past performance may not be a reliable guide to future performance and investors may not get back the amount invested. All investments involve risk. The value of the investment and the income from it will vary. There is no guarantee that the initial investment will be returned. The views expressed are those of the author and Brown Advisory as of the date referenced and are subject to change at any time based on market or other conditions. These views are not intended to be and should not be relied upon as investment advice and are not intended to be a forecast of future events or a guarantee of future results. Past performance is not a guarantee of future performance and you may not get back the amount invested. The information provided in this material is not intended to be and should not be considered to be a recommendation or suggestion to engage in or refrain from a particular course of action or to make or hold a particular investment or pursue a particular investment strategy, including whether or not to buy, sell, or hold any of the securities mentioned. It should not be assumed that investments in such securities have been or will be profitable. To the extent specific securities are mentioned, they have been selected by the author on an objective basis to illustrate views expressed in the commentary and do not represent all of the securities purchased, sold or recommended for advisory clients. The information contained herein has been prepared from sources believed reliable but is not guaranteed by us as to its timeliness or accuracy, and is not a complete summary or statement of all available data. This piece is intended solely for our clients and prospective clients, is for informational purposes only, and is not individually tailored for or directed to any particular client or prospective client. All investments involve risk. The value of the investment and the income from it will vary. There is no guarantee that the initial investment will be returned. Sustainable investment considerations are one of multiple informational inputs into the investment process, alongside data on traditional financial factors, and so are not the sole driver of decision-making. Sustainable investment analysis may not be performed for every holding in the strategy. Sustainable investment considerations that are material will vary by investment style, sector/industry, market trends and client objectives. The strategy seeks to identify companies that it believes may be desirable based on our analysis of sustainable investment related risks and opportunities, but investors may differ in their views. As a result, the strategy may invest in companies that do not reflect the beliefs and values of any particular investor. The strategy may also invest in companies that would otherwise be excluded from other funds that focus on sustainable investment risks. Security selection will be impacted by the combined focus on sustainable investment research assessments and fundamental research assessments including the return forecasts. The strategy incorporates data from third parties in its research process but does not make investment decisions based on third-party data alone. The MSCI ACWI ex USA Index captures large and mid cap representation across 22 of 23 Developed Markets (DM) countries (excluding the US) and 24 Emerging Markets (EM) countries. With 1,970 constituents, the index covers approximately 85% of the global equity opportunity set outside the US (as of February 27, 2026). FactSet® is a registered trademark of FactSet Research Systems, Inc.. Global Industry Classification Standard ((GICS®)) and “GICS” are service makers/trademarks of MSCI and Standard & Poor’s. Figures shown on sector diversification and quarterly attribution by detail slides may not total due to rounding. The use of Second party screening is account specific and not inherent in the strategy’s investment approach, but may be used as requested by clients on a case by case basis. Terms and Definitions The Average Weight of a position or sector refers to the daily average for the period covered in this report of a stock's value as a percentage of the portfolio. Allocation Effect measures the impact of the decision to allocate assets differently than those in the benchmark. Active Share is calculated by taking the sum of the absolute value of the differences of the weight of each holding in the manager's portfolio versus the weight of each holding in the benchmark index and dividing by two. Selection and Interaction Effect reflects the combination of selection effect and interaction effect. Selection effect measures the effect of choosing securities that may or may not outperform those of the benchmark. Interaction effect measures the effect of allocation and selection decisions (i.e., did we overweight the sectors in which we underperformed). Total Effect reflects the combination of allocation, selection and interaction effects. Totals may not equal due to rounding. RoIC is a measure of determining a company's financial performance.. .. ROIC ex financials excludes Banks and Insurance companies, and outliers excluded from the benchmark. Free Cash Flow (FCF) yield is a measure of financial performance calculated as operating cash flow minus capital expenditures. FCF yield calculations presented use the median NTM (Next Twelve Months) and exclude Banks and Insurance companies, and outliers excluded from the benchmark. Free Cash Flow (FCF) is a measure of financial performance calculated as operating cash flow minus capital expenditures. Free cash flow (FCF) represents the cash that a company is able to generate after laying out the money required to maintain or expand its asset base. Free cash flow is important because it allows a company to pursue opportunities that enhance shareholder value. Without cash, it's tough to develop new products, make acquisitions, pay dividends and reduce debt. Sales growth rate is based on reported company revenue for the past three years at the end of the current quarter, provided as a historical average. Net debt-to-EBITDA (earnings before interest depreciation and amortization) ratio is a measurement of leverage, calculated as a company's interest-bearing liabilities minus cash or cash equivalents, divided by its EBITDA. The calculation presented excludes Banks and Insurance companies, and outliers excluded from the benchmark. Return On Equity (ROE) is the amount of net income returned as a percentage of shareholders equity. Return on equity measures a corporation's profitability by revealing how much profit a company generates with the money shareholders have invested. ROE is expressed as a percentage and calculated as: . Compound Annual Growth Rate (CAGR) is the rate of return that would be required for an investment to grow from its beginning balance to its ending balance, assuming the profits were reinvested at the end of each period of the investment's life span. The Internal Rate of Return (IRR) is a measure of an investment's rate of return. The internal rate of return is a discount rate that makes the net present value(NPV) of all cash flows from a particular project equal to zero. It is also called the discounted cash flow rate of return. Earnings Per Share (EPS) is a measure of a company's profitability, calculated by dividing quarterly or annual income (minus dividends) by the number of outstanding stock shares. The higher a company's EPS, the greater the profit and value perceived by investors. Sustainable International Leaders Composite **Return is for period September 1, 2021 through December 31, 2021. Brown Advisory Institutional claims compliance with the Global Investment Performance Standards ((GIPS®)) and has prepared and presented this report in compliance with the GIPS standards. Brown Advisory Institutional has been independently verified for the periods from January 1, 1993 through December 31, 2024. The Verification reports are available upon request. A firm that claims compliance with the GIPS standards must establish policies and procedures for complying with all the applicable requirements of the GIPS standards. Verification provides assurance on whether the firm's policies and procedures related to composite and pooled fund maintenance, as well as the calculation, presentation, and distribution of performance, have been designed in compliance with the GIPS standards and have been implemented on a firm-wide basis. Verification does not provide assurance on the accuracy of any specific performance report. GIPS® is a registered trademark of CFA Institute. CFA Institute does not endorse or promote this organization, nor does it warrant the accuracy or quality of the content contained herein. *For the purpose of complying with the GIPS standards, the firm is defined as Brown Advisory Institutional, the Institutional and Balanced Institutional asset management divisions of Brown Advisory. As of July 1, 2016, the firm was redefined to exclude the Brown Advisory Private Client division, due to an evolution of the three distinct business lines. The Sustainable International Leaders Composite (the Composite) includes all discretionary portfolios invested in the Sustainable International Leaders strategy. The Sustainable International Leaders strategy aims to achieve capital appreciation by investing primarily in international equities. The strategy intends to invest in equity securities of companies that the portfolio manager believes are leaders within their industry or country, as demonstrated by an ability to deliver high relative return on invested capital over time. Sustainable investment considerations are one of multiple informational inputs into the investment process, alongside data on traditional financial factors, and so are not the sole driver of decision-making. Sustainable investment analysis may not be performed for every holding in the strategy. Sustainable investment considerations that are material will vary by investment style, sector/industry, market trends and client objectives. The Sustainable International Leaders Strategy ("Strategy") seeks to identify companies that it believes may be desirable based on our analysis of sustainable investment related risks and opportunities, but investors may differ in their views. As a result, the Strategy may invest in companies that do not reflect the beliefs and values of any particular investor. The Strategy may also invest in companies that would otherwise be excluded from other strategies that focus on sustainable investment risks. Security selection will be impacted by the combined focus on sustainable investment research assessments and fundamental research assessments including the return forecasts. The Strategy incorporates data from third parties in its research process but does not make investment decisions based on third-party data alone. The Composite creation date is October 6, 2021. The Composite inception date is September 1, 2021. The benchmark is the MSCI ACWI ex U.S. Net Index rebalanced quarterly. The MSCI ACWI ex U.S. Net Index captures large and mid cap representation across Developed Markets (DM) countries (excluding the U.S.) and Emerging Markets (EM) countries. The Index covers approximately 85% of the global equity opportunity set outside the U.S. All MSCI indexes and products are trademarks and service marks of MSCI or its subsidiaries. An investor cannot invest directly into an index. Benchmark returns are not covered by the report of the independent verifiers. As of September 1, 2022, the Composite benchmark was changed from the FTSE All-World ex-U.S. Net Index to the MSCI ACWI ex U.S. Net Index. The change was applied retroactively from the Composite inception date. The Advisor determined that MSCI indices are more widely used for global products, and thereby provide more relevant data to shareholders and prospects as well as comparisons to competitors. Composite dispersion is an equal-weighted standard deviation of portfolio gross returns calculated for the accounts in the Composite for the entire calendar year period. The composite dispersion is not applicable (N/A) for periods where there were five or fewer accounts in the Composite for the entire period. Gross-of-fees performance returns are presented before management fees but after all trading commissions, and gross of foreign withholding taxes (if applicable). Net-of-fees performance returns are calculated by adjusting the gross-of-fees performance return by the highest fee for the institutional strategy as outlined in Part 2A of the firm's Form ADV, applied on a monthly basis. Certain accounts in the Composite may pay asset-based custody fees that include commissions. For these accounts, gross returns are also net of custody fees. Other expenses can reduce returns to investors. The standard management fee schedule is as follows: 0.80% on the first $50 million; 0.55% on the next $50 million; 0.45% on the next $50 million; and 0.40% on the balance over $150 million. Further information regarding investment advisory fees is described in Part 2A of the firm's Form ADV. Actual fees paid by accounts in the Composite may differ from the current fee schedule. Effective July 1, 2023, the firm transitioned from using actual account fees in the calculation of net performance returns to applying the highest fee for the institutional strategy as outlined in Part 2A of the firm's Form ADV. The net performance track record was revised back to Composite inception. The three-year annualized ex-post standard deviation measures the variability of the Composite (using gross returns) and the benchmark for the 36-month period ended on December 31. The 3 year annualized standard deviation is not presented as of December 31, 2021, December 31, 2022, and December 31, 2023 because 36 month returns for the Composite were not available (N/A). Valuations and performance returns are computed and stated in U.S. Dollars. All returns reflect the reinvestment of income and other earnings. A complete list of composite descriptions and broad distribution and limited distribution pooled funds is available upon request. Policies for valuing investments, calculating performance, and preparing GIPS Reports are available upon request. Past performance is not indicative of future results. This is not an offer to sell securities. That may only be accomplished by the issuance of a private offering memorandum/subscription documents. This piece is provided for informational purposes only and should not be construed as a research report, a recommendation or suggestion to engage in or refrain from a particular course of action or to make or hold a particular investment or pursue a particular investment strategy, including whether or not to buy, sell or hold any of the securities mentioned, including any mutual fund managed by Brown Advisory.
Year Composite Total Gross Returns (%) Composite Total Net Returns (%) Benchmark Returns (%) Composite 3-Yr Annualized Standard Deviation (%) Benchmark 3-Yr Annualized Standard Deviation (%) Portfolios in Composite at End of Year Composite Dispersion (%) Composite Assets ($USD Millions)* GIPS Firm Assets ($USD Millions)* 2024 3.0 2.2 5.5 18.2 16.0 Five or fewer N/A 34 88,323 2023 17.1 16.1 15.6 N/A N/A Five or fewer N/A 33 78,241 2022 -16.5 -17.2 -16.0 N/A N/A Five or fewer N/A 17 58,575 2021** -1.6 -1.9 -1.4 N/A N/A Five or fewer N/A 1 79,715
Editor's Note: The summary bullets for this article were chosen by Seeking Alpha editors.
Editor's Note: This article covers one or more microcap stocks. Please be aware of the risks associated with these stocks.
此内容由惯性聚合(RSS阅读器)自动聚合整理,仅供阅读参考。 原文来自 — 版权归原作者所有。