



Getty Images
The performance data quoted represents past performance and does not guarantee future results . Current performance may be lower or higher. Periods over one-year are annualized. Performance figures are presented gross and net of fees and have been calculated after the deduction of all transaction costs and commissions, and include the reinvestment of all income. Please reference the GIPS Report which accompanies this commentary. The commentary is not intended as a guarantee of profitable outcomes. Any forward-looking statements are based on certain expectations and assumptions that are susceptible to changes in circumstances. Opinions and views expressed constitute the judgment of Polen Capital as of the date herein, may involve a number of assumptions and estimates which are not guaranteed, and are subject to change. Contribution to relative return is a measure of a securities contribution to the relative return of a portfolio versus its benchmark index. The calculation can be approximated by the below formula, taking into account purchases and sales of the security over the measurement period. Please note this calculation does not take into account transactional costs and dividends of the benchmark, as it does for the portfolio. Contribution to relative return of Stock A = (Stock A portfolio weight (%) - Stock A benchmark weight (%)) x (Stock A return (%) - Aggregate benchmark return (%)). All company-specific information has been sourced from company financials as of the relevant period discussed.
The first quarter of 2026 was a highly volatile one for global equities. Concerns about AI disruption fears reached a fever pitch this quarter and in late February the US and Israel launched Operation Epic Fury in Iran and other nations in the Middle East. These two issues in combination were the primary catalysts for violent moves in stock prices and other asset classes. The best performing sectors in the MSCI ACWI Index (the "Index"), unsurprisingly given the backdrop of war in the Middle East, were Energy, Materials, Utilities, Consumer Staples, Industrials, and Real Estate. While we do, at times, find Consumer Staples and Industrials businesses that meet our investment criteria, in the aggregate, these aren't sectors that we tend to have much exposure to so their strength was another headwind to our relative performance in the quarter.
For the quarter, the Polen Global Growth Composite Portfolio (the "Portfolio") declined -15.7% (net of fees), while the Index declined -3.2%. While we have made a rather meaningful shift in our exposures in Global Growth during the past year—cutting our software and software adjacent exposures in half and building a significant position in semiconductor and related businesses—we continue to own several enterprise software, internet platform and hyperscaler businesses as well as digital payments companies and proprietary information-based businesses. Many of these companies' shares have come under pressure from the concerns that generative AI will disrupt their growth, their business models or both. Much of the declines were triggered by new products from Anthropic's Claude Cowork agentic system that can execute processes for knowledge works autonomously. Indeed, we too see plenty of disruption risk for some businesses that can be replicated better by agentic systems over time especially for software products that are simple and handle low-stakes workloads (don't need precision), are standalone or point products (not integrated with other systems), have low cost of failure, light regulatory oversight and run on publicly available data. We wouldn't invest in software businesses like this before generative AI and especially not now. The software (and other information-based) businesses we seek to invest in involve deep systems of record and handle complex, multi-faceted workloads that are embedded in customer environments. They also often have deep domain expertise and stringent regulatory requirements.
Replacing these systems would be a complex, hazardous, and a costly exercise that few management teams would be willing to risk. It is worth remembering that generative AI is probabilistic not deterministic, which means the answers it gives are a best guess based on the data set on which it's been trained. Mistakes and hallucinations that are a natural part of gen AI products cannot be tolerated in mission critical business operations. The competitive advantages of incumbent enterprise software companies are manifold and gen AI coded software cannot easily overcome those advantages, in our view. Contrarily, these embedded enterprise software companies can add AI agents to their existing offerings far easier than AI agents can displace incumbent software. In addition, as agents need access to a company's mission critical software, the software companies may be able to monetize agentic users just as they do human ones. Companies like Microsoft (MSFT), ServiceNow (NOW), Shopify (SHOP), Oracle (ORCL), and CoStar all have multi-layered moats and, in each case, we see generative AI as a tailwind for their businesses, not a headwind. While we've reduced our aggregate software exposure, we added selectively during the quarter to the businesses that we remain most convicted. We've also added to platform businesses, like Meta, Tencent (TCEHY) and Spotify (SPOT), that we feel are successfully applying AI to drive stronger growth and/or do not need to change their business model to continue delivering results.
Amidst this investor panic, it would appear to us that the proverbial 'baby' has been 'thrown out with the bathwater'. Take Microsoft for example, after the quarter's sell off is now trading at the same valuation (~20x 12-month forward earnings) as Exxon Mobil (XOM) despite generating ~4x the amount of operating profit and ~2x the free cash flow (even with Microsoft's heavy investment into AI infrastructure) and delivering materially higher earnings growth, all with a much greater degree stability and consistency through the cycle. To us, this exemplifies the dichotomy of perception vs. reality.
At the same time, the angst around an AI bubble and the future return from the vast infrastructure investment spend has seen enthusiasm wane for the immediate beneficiaries. Take NVIDIA (NVDA) for example, in their most recent earnings report during the quarter they increased revenues more than 70% year-over-year and delivered meaningful beats on the top and bottom lines, while significantly increasing forward guidance well above consensus estimates. Despite these stellar numbers, the market reaction was one of disinterest as their shares declined post-print and have languished since despite continued evidence showing there seems to be a long runway of outsized future growth ahead for the company. It seems semiconductor investment dollars have moved further, and swiftly, down the supply chain into areas such as memory producers during the quarter, chasing even faster growth as a memory bottleneck is leading to big price increases in this more commoditized segment of the market. During the first half of the first quarter, many software shares were down 30%+ while many memory-related companies shares were up 30%+, a breath-taking move and divergence in a very short period of time.
To us, not only are these two examples astonishing individually, but the narratives driving some software and semiconductor company performance seem to illustrate that psychology and sentiment are increasingly dictating stock performance versus fundamentals and earnings delivery.
Importantly, as earnings reports for the Portfolio's holdings across these industries have come in during the quarter, they have generally delivered strong operational performance. Revenue growth, customer retention, and cash flow generation remain intact across our holdings in these areas, and we believe the magnitude of share price declines do not reflect an observable change in their intrinsic value.
In the first quarter, we took advantage of the volatility in the marketplace, increasing our exposures to Communication Services platform businesses demonstrating progress applying AI and to semiconductor-related businesses that continue to deliver robust results despite share price declines. While we have reduced our overall exposure to software meaningfully during the past year and slightly more during the first quarter, we have concentrated our software investments in businesses we believe are best positioned to benefit from gen AI tailwinds. The Portfolio's expected earnings growth remains in the mid-to-high teens range over the coming five years (well above our expectation for the Index's earnings growth).
In Q1 2026, the Portfolio returned -15.7% (net of fees) compared to -3.2% for the Index. Top relative contributors to the Portfolio's performance included TSMC, Tesla (not owned), and Apple (not owned). By contrast, the largest relative detractors in the quarter were Adyen, Boston Scientific, and CoStar Group .
TSMC, the dominant manufacturer of semiconductor chips globally (60% market share), was our top relative and absolute contributor in 1Q. AI-related demand has only continued to grow, contributing to accelerating growth in the first quarter. While NVIDIA is seemingly on a path to overtake Apple as TSMC's largest customer, TSMC is also benefitting from the growth in custom AI chips (ASICs) as inference and efficiency gains become increasingly important. While the company benefits strongly from the massive amounts of capex the hyperscalers are investing in the AI infrastructure build out, the company itself is investing heavily to maintain its position as the dominant player on the leading-edge advanced nodes (3nm, 5nm) which comes with significant pricing power. While growth can come with a higher degree of cyclicality than most of our companies, through the cycle we expect TSMC should be capable of generating mid-teens revenue growth with modest margin expansion, resulting in high-teens EPS growth.
Adyen was our biggest detractor in the quarter. Adyen is a Netherlands-based operator of a global payments platform, integrating the payment stack along gateway, risk management, processing, acquiring and settlement. We think Adyen's recent results highlight a company that continues to grow at a healthy pace despite short-term volatility in processed volume. Net revenue growth remains stable at approximately 20%, reflecting continued wallet share gains with enterprise customers. Importantly, there is little evidence that the competitive environment has materially changed since the last major drawdown in the stock. The recent volatility in the stock appears more reflective of sentiment than of any structural change in the underlying business, and as long-term investors we believe this represents an attractive opportunity.
In Q1 2026, we initiated new positions in Siemens Energy (SMNEY), Tokyo Electron (TOELY), Meta Platforms (META), and ASML (ASML) while we sold our holdings in Abbott Laboratories (ABT), Adobe (ADBE), Paycom Software (PAYC) and SAP (SAP) . We also added to our holdings in Boston Scientific, Spotify, Tencent Holdings, Broadcom, NVIDIA, Shopify, ServiceNow, and CoStar Group, while trimming our exposure to Amazon, Alphabet, MSCI, Oracle, Microsoft, and Siemens Healthineers (SMMNY) . The net result of these trades were 1) a lower and more concentrated exposure to software companies, 2) increased exposure to the semiconductor supply chain and 3) increased exposure to platform businesses within Communication Services.
We initiated a new position in Siemens Energy which had spun out of parent Siemens AG in 2020 and is a global energy technology company that manufactures and services the infrastructure that generates, transmits, and stabilizes electricity. The company operates across the full power value chain, including gas and steam turbines, grid transmission equipment, industrial decarbonization solutions, and wind turbines.
The critical growth drivers for Siemens Energy are the Gas Services segment and the Grid Tech segment which comprise 60% by high barriers to entry, but also the potential for cyclical demand, and strong secular tailwinds from data center energy consumption, electrification and grid strengthening. These two segments both have the potential to grow revenues at a double-digit rate over the next 3 years. Overall, we view Siemens Energy as very well positioned over the next few years with the potential for mid-teens or better annual earnings growth.
Tokyo Electron was another new position we added in the quarter. The company is a Japanese leading semiconductor capital equipment vendor that occupies a dominant position in etch, deposition, and wafer cleaning. These are critical steps in the semiconductor manufacturing process and provides the Portfolio with some exposure to the semi-cap equipment industry where the current supply/demand dynamics heavily favor the suppliers. Beyond its meaningful scale advantages, we think Tokyo Electron strategically partners with customers, continuously improves its technologies and is well managed. The company's main customers include the large foundries (TSMC, Samsung, Intel), but 30-40% of the company revenues come from China as well and this is a market that provides opportunity and risk. Recently both TSMC and Samsung have announced significant increases in capex plans—a big positive for Tokyo Electron. The company has roughly 12% share in the wafer fabrication equipment market and a higher 20% share in the fast-growing (but cyclical) DRAM market. We believe Tokyo Electron is poised to grow total returns at a mid-teens rate over the coming years.
We re-initiated a position in Meta Platforms, a name we previously owned in 2022. While we remain mindful of elevated data center capex and the uncertainty around its ultimate return without a comparable cloud business, we are encouraged by Meta's strong execution in monetizing AI across its platforms. Advertising revenues are growing at approximately 25% despite already exceeding a $200bn annual run rate, supported by an unparalleled global reach of 3.2bn monthly and 2.2bn daily active users. Although margins are likely to face near-term pressure from continued investment, we expect re-expansion as management balances growth and spending. With the stock trading at ~21x FY26 earnings after a prolonged period of sideways performance, we see an attractive valuation for a business capable of delivering mid-teens EPS growth, with additional upside potential if investment intensity moderates.
Finally, we initiated a small position in ASML, the leading global provider of lithography machines to the semiconductor industry and the only global provider of extreme ultraviolet lithography (EUV) equipment necessary for advanced semiconductor manufacturing. ASML's machines print minute detail onto silicon wafers. This minute detail is what drives improvement in chip performance, powering technological progress. ASML commands a monopolistic position within its segment of the semi supply chain (in some sub-segments it has 100% market share) and the technological complexity of its equipment creates an enormous barrier to entry. ASML should benefit from the strong semi cycle—both for memory and logic—that we think is likely to persist until the end of the decade. Additionally, recent innovation in light source technology could improve ASML's machine throughput which would potentially translate into much higher pricing for their machines in the future. Given the various industry tailwinds, we expect ASML should be able to grow earnings at a high-teens rate or better.
On the other hand, we exited our position in Abbott Laboratories during the quarter, following a prior reduction after the company announced its acquisition of Exact Sciences (EXAS). The size and dilutive nature of the deal raised concerns around capital allocation, which were reinforced by disappointing Q4 results that showed weaker-than-expected organic revenue growth. With business momentum deteriorating and increased uncertainty tied to the acquisition, we believe stepping aside is the prudent course for now.
We also sold Adobe, Paycom, and SAP to redeploy the capital to our highest conviction software names like ServiceNow, Shopify and CoStar Group . The previously discussed price dislocations within the software space have presented opportunities for long-term patient investors and we believe it prudent to consolidate some of the portfolio around businesses where we believe the AI disruption concerns are excessive and are unlikely to materially affect their moat. ServiceNow, Shopify and CoStar Group are those types of businesses, in our opinion. These companies are heavily intertwined into their customers' workflow (and thus difficult to replace), process/house important data and offer their own enhanced AI solutions, and in the case of CoStar Group, have deep domain expertise that we believe would be very difficult to index by AI models. In the case of ServiceNow and Shopify, we believe their respective customers are likely to use their proprietary AI tools rather than try to re-create their own or outsource to an unproven third-party. Both ServiceNow and Shopify are already growing rapidly and we believe have wide open growth potential in enormous markets and AI should be a tailwind for them, and we expect CoStar Group will see significant margin expansion in the coming years that should lead to attractive earnings growth. We expect these three companies to be among the fastest earnings growers in the Portfolio over the next five years.
Over the course of our history, there have been numerous periods of narrative-driven volatility that while uncomfortable, ultimately end, as the weight of continuously compounding earnings adds up and proves difficult for market participants to ignore. We are excited about the buying opportunities we are seeing in exceptional businesses that have the potential to deliver above average long-term compounding in the coming years.
Our investment process emphasizes underwriting long-term competitive advantages and multi-year earnings power. We remain confident in the attractive long-term compounding potential of our Portfolio holdings compared to the broader market, and we continue to focus on owning businesses with durable advantages, wide economic moats, strong balance sheets, and the ability to grow their earnings over a multi-year horizon. As the weight of our Portfolio's earnings continues to compound, we believe it will once again prove difficult for market participants to ignore.
Thank you for your interest in Polen Capital and the Global Growth strategy. Please feel free to contact us with any questions or comments.
Sincerely,Damon Ficklin and Steve Atkins, CFA
Damon FicklinHead of Team, Portfolio Manager24 years of industry experience Stephen Atkins, CFAPortfolio Manager & Analyst28 years of industry experience Important Disclosures & Definitions This commentary is very limited in scope and is not meant to provide comprehensive descriptions or discussions of the topics mentioned herein. Moreover, this commentary has been prepared without taking into account individual objectives, financial situations or needs. As such, this commentary is for informational discussion purposes only and is not to be relied on as legal, tax, business, investment, accounting or any other advice. Recipients of this commentary should seek their own independent financial advice. Investing involves inherent risks, and any particular investment is not suitable for all investors; there is always a risk of losing part or all of your invested capital. No statement herein should be interpreted as an offer to sell or the solicitation of an offer to buy any security (including, but not limited to, any investment vehicle or separate account managed by Polen Capital). Recipients acknowledge and agree that the information contained in this commentary is not a recommendation to invest in any particular investment, and Polen Capital is not hereby undertaking to provide any investment advice to any person. This commentary is not intended for distribution to, or use by, any person or entity in any jurisdiction or country where such distribution or use would be contrary to local law or regulation. Unless otherwise stated in this commentary, the statements herein are made as of the date of this commentary and the delivery of this commentary at any time thereafter will not create any implication that the statements are made as of any subsequent date. Certain information contained herein is derived from third parties beyond Polen Capital's control or verification and involves significant elements of subjective judgment and analysis. While efforts have been made to ensure the quality and reliability of the information herein, there may be limitations, inaccuracies, or new developments that could impact the accuracy of such information. Therefore, this commentary is not guaranteed to be accurate or timely and does not claim to be complete. Polen Capital reserves the right to supplement or amend these slides at any time, but has no obligation to provide the recipient with any supplemental, amended, replacement or additional information. Any statements made by Polen Capital regarding future events or expectations are forward-looking statements and are based on current assumptions and expectations. Such statements involve inherent risks and uncertainties and are not a reliable indicator of future performance. Actual results may differ materially from those expressed or implied. The MSCI ACWI Index is a market capitalization weighted equity index that measures the performance of large and mid-cap segments across developed and emerging market countries. The index is maintained by Morgan Stanley Capital International. The performance of an index does not reflect any transaction costs, management fees, or taxes. It is impossible to invest directly in an index. Past performance is not indicative of future results. Source: All data is sourced from Bloomberg unless otherwise noted. All company-specific information has been sourced from company financials as of the relevant period discussed. Definitions: Contribution to relative return: a measure of a security's contribution to the relative return of a portfolio versus its benchmark index. The calculation can be approximated by the below formula, taking into account purchases and sales of the security over the measurement period. Please note this calculation does not take into account transactional costs and dividends of the benchmark, as it does for the portfolio. Contribution to relative return of Stock A = (Stock A portfolio weight (%) - Stock A benchmark weight (%)) x (Stock A return (%) - Aggregate benchmark return (%)). All company-specific information has been sourced from company financials as of the relevant period discussed. GIPS Report Polen Capital ManagementGlobal Growth Composite—GIPS Composite Report Performance % as of 12-31-2025: (Annualized returns are presented for periods greater than one year) 1 A 3 Year Standard Deviation is not available for 2015 and 2016 due to 36 monthly returns are not available. 2 N/A - There are five or fewer accounts in the composite the entire year. Total assets and UMA assets are supplemental information to the GIPS Composite Report. While pitch books are updated quarterly to include composite performance through the most recent quarter, we use the GIPS Report that includes annual returns only. To minimize the risk of error we update the GIPS Report annually. This is typically updated by the end of the first quarter. GIPS Report The Global Growth Composite created and incepted on January 1, 2015 contains fully discretionary global growth accounts that are not managed within a wrap fee structure and for comparison purposes is measured against MSCI ACWI. Prior to October 18, 2016, the benchmark for the Global Growth Composite was the MSCI ACWI variant with gross dividends. As of October 18, 2016, the benchmark was changed retroactively to the MSCI ACWI variant with net dividends, to more accurately reflect the Global Growth Composite's strategy. Effective January 2022, fully discretionary large cap equity accounts managed as part of our Global Growth strategy that adhere to the rules and regulations applicable to registered investment companies subject to the U.S. Investment Company Act of 1940 were included into the Global Growth Composite. The accounts comprising the portfolios are highly concentrated and are not constrained by EU diversification regulations. Polen Capital Management claims compliance with the Global Investment Performance Standards (GIPS®) and has prepared and presented this report in compliance with the GIPS standards. Polen Capital Management has been independently verified for the periods April 1, 1992 through December 31, 2024 . The verification reports are available upon request. A firm that claims compliance with the GIPS standards must establish policies and procedures for complying with all the applicable requirements of the GIPS standards. Verification provides assurance on whether the firm's policies and procedures related to composite and pooled fund maintenance, as well as the calculation, presentation, and distribution of performance, have been designed in compliance with the GIPS standards and have been implemented on a firm-wide basis. Verification does not provide assurance on the accuracy of any specific performance report. Polen Capital Management is an independent registered investment adviser. Polen Capital Management maintains related entities which together invest exclusively in equity portfolios consisting of high-quality companies. A list of all composite and pooled fund investment strategies offered by the firm, with a description of each strategy, is available upon request. In July 2007, the firm was reorganized from an S-corporation into an LLC and changed names from Polen Capital Management, Inc. to Polen Capital Management, LLC. Results are based on fully discretionary accounts under management, including those accounts no longer with the firm. Effective January 1, 2022, composite policy requires the temporary removal of any portfolio incurring a client initiated significant net cash inflow or outflow of 10% or greater of portfolio assets, provided, however, if invoking this policy would result in all accounts being removed for a month, this policy shall not apply for that month. The U.S. Dollar is the currency used to express performance. Returns are presented gross and net of management fees and include the reinvestment of all income. Net of fee performance was calculated using either actual management fees or highest fees for fund structures. The annual composite dispersion presented is an asset-weighted standard deviation using returns presented gross of management fees calculated for the accounts in the composite the entire year. Policies for valuing investments, calculating performance, and preparing GIPS Reports are available upon request. The separate account management fee schedule is as follows: Institutional: Per annum fees for managing accounts are 85 basis points (0.85%) on the first $50 Million and 65 basis points (0.65%) on all assets above $50 Million of assets under management. HNW: Per annum fees for managing accounts are 160 basis points (1.60%) of the first $500,000 of assets under management and 110 basis points (1.10%) of amounts above $500,000 of assets under management. Actual investment advisory fees incurred by clients may vary. The per annum fee schedule for managing the Polen Global Growth Fund, which is included in the Global Growth Composite, is 85 basis points (.85%). The total annual fund operating expenses are up to 135 basis points (1.35%). As of 9/1/2024, the mutual fund expense ratio goes up to 1.23%. This figure may vary from year to year. The per annum fee schedule for managing the Polen Capital Global Growth ETF, which is included in the Global Growth Composite, is 85 basis points (.85%). The total annual fund operating expenses are up to 85 basis points (.85%). Past performance does not guarantee future results and future accuracy and profitable results cannot be guaranteed. Performance figures are presented gross and net of management fees and have been calculated after the deduction of all transaction costs and commissions. Portfolio returns are net of all foreign non-reclaimable withholding taxes. Reclaimable withholding taxes are reflected as income if and when received. Polen Capital is an SEC registered investment advisor and its investment advisory fees are described in its Form ADV Part 2A. The advisory fees will reduce clients' returns. The chart below depicts the effect of a 1% management fee on the growth of one dollar over a 10 year period at 10% (9% after fees) and 20% (19% after fees) assumed rates of return. The MSCI ACWI Index is a market capitalization weighted equity index that measures the performance of large and mid-cap segments across developed and emerging market countries. The index is maintained by Morgan Stanley Capital International. It is impossible to invest directly in an index. The performance of an index does not reflect any transaction costs, management fees, or taxes. The information provided in this document should not be construed as a recommendation to purchase or sell any particular security. There is no assurance that any securities discussed herein will remain in the composite or that the securities sold will not be repurchased. The securities discussed do not represent the composite's entire portfolio. Actual holdings will vary depending on the size of the account, cash flows, and restrictions. It should not be assumed that any of the securities transactions or holdings discussed will prove to be profitable, or that the investment recommendations or decisions we make in the future will be profitable or will equal the investment performance of the securities discussed herein. A complete list of our past specific recommendations for the last year is available upon request. GIPS® is a registered trademark of CFA Institute. CFA Institute does not endorse or promote this organization, nor does it warrant the accuracy or quality of the content contained herein.
Year End UMA Firm Composite Assets Annual Performance Results 3 Year Standard Deviation 1 Total ($Millions) Assets ($Millions) Assets ($Millions) U.S. Dollars ($Millions) Number of Accounts Composite Gross (%) Composite Net (%) MSCI ACWI (%) Composite Dispersion 2 (%) Composite Gross (%) MSCI ACWI (%) 2024 52,943 21,135 31,808 718.76 8 13.20 11.93 17.49 0.1 19.69 16.20 2023 58,910 22,269 36,641 670.70 9 32.38 30.92 22.20 0.1 20.08 16.27 2022 48,143 18,053 30,090 507.47 7 -30.53 -31.39 -18.35 0.0 20.39 19.86 2021 82,789 28,884 53,905 138.08 7 17.90 17.07 18.54 0.6 15.08 16.84 2020 59,161 20,662 38,499 39.14 3 25.01 24.13 16.27 N/A 16.16 18.13 2019 34,784 12,681 22,104 6.50 2 37.37 36.35 26.60 N/A 12.10 11.22 2018 20,591 7,862 12,729 4.77 2 3.14 2.22 -9.41 N/A 11.50 10.47 2017 17,422 6,957 10,466 4.16 2 32.66 31.55 23.96 N/A 10.12 10.36 2016 11,251 4,697 6,554 0.33 1 1.21 0.34 7.86 N/A N/A N/A 2015 7,451 2,125 5,326 0.33 1 10.07 9.14 -2.36 N/A N/A N/A
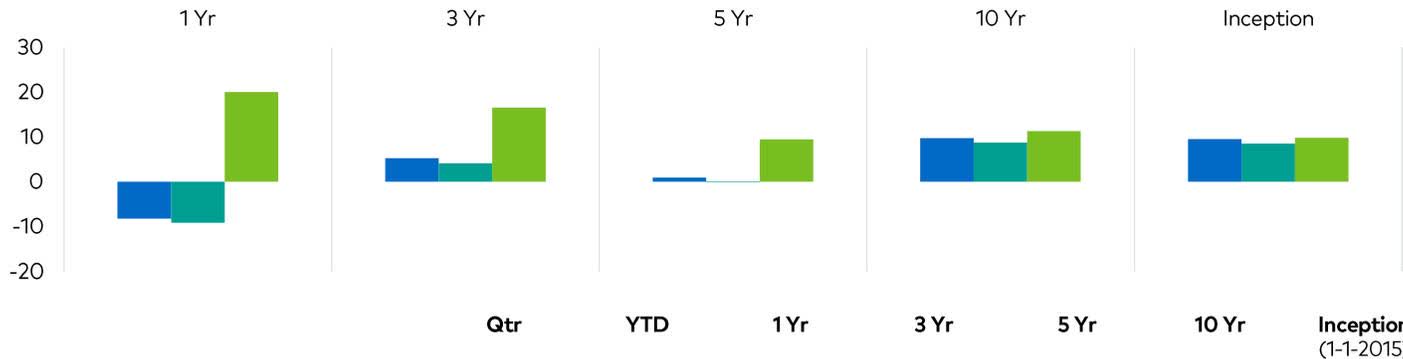
1 Yr 5 Yr 10 Yr Inception Polen Global Growth (Gross) 2.89 4.78 11.62 11.48 Polen Global Growth (Net) 1.83 3.66 10.58 10.45 MSCI ACWI 22.34 11.19 11.71 10.36
Return 1 Year 2 Years 3 Years 4 Years 5 Years 6 Years 7 Years 8 Years 9 Years 10 Years 10% 1.10 1.21 1.33 1.46 1.61 1.77 1.95 2.14 2.36 2.59 9% 1.09 1.19 1.30 1.41 1.54 1.68 1.83 1.99 2.17 2.37 20% 1.20 1.44 1.73 2.07 2.49 2.99 3.58 4.30 5.16 6.19 19% 1.19 1.42 1.69 2.01 2.39 2.84 3.38 4.02 4.79 5.69
Editor's Note: The summary bullets for this article were chosen by Seeking Alpha editors.
Editor's Note: This article covers one or more microcap stocks. Please be aware of the risks associated with these stocks.
此内容由惯性聚合(RSS阅读器)自动聚合整理,仅供阅读参考。 原文来自 — 版权归原作者所有。