









Akmal Hazim bin Khalit./iStock via Getty Images
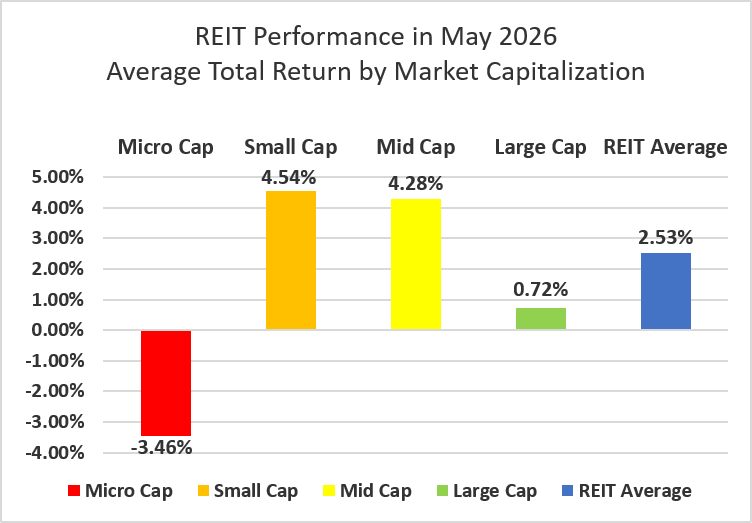
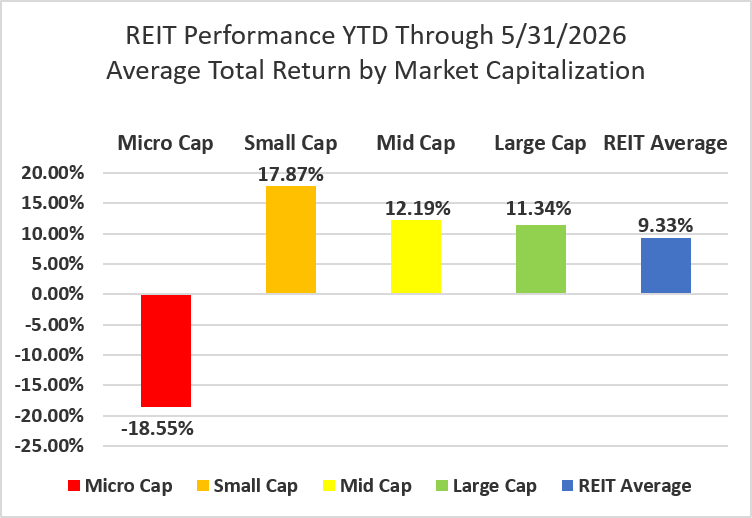
After a particularly strong April (+8.90%), REITs saw further gains in May (2.53% ) and now average a +9.33% year-to-date return after the first 5 months of the year. The REIT sector fell short of the Dow Jones Industrial Average (+2.9%), S&P 500 (+5.3%) and NASDAQ (+8.4%) in May. The market cap weighted Vanguard Real Estate ETF (VNQ) badly underperformed the average REIT in May (-0.65% vs. +2.53%) but has performed virtually identically with the average REIT year-to-date (9.31% vs. +9.33%). The spread between the 2026 FFO multiples of large cap (18x) and small cap REITs (12.2x) widened again in May as multiples expanded 0.2 turns for large caps and 0.1 turns for small caps. Investors currently need to pay an average of 47.5% more for each dollar of FFO from large cap REITs relative to small cap REITs. In this monthly publication, I will provide REIT data on numerous metrics to help readers identify which property types and individual securities currently offer the best opportunities to achieve their investment goals.
Source: Graph by Simon Bowler of 2nd Market Capital, Data compiled from S&P Global Market Intelligence LLC. See important notes and disclosures at the end of this article
Micro cap REITs (-3.46%) extended their long streak of underperforming their larger peers. Small caps (+4.54%) led the REIT sector again in May with mid caps (+4.28%) close behind and large caps (+0.72%) finishing narrowly in the black. During the first five months of 2026, small cap REITs have outperformed large caps by 653 basis points.
Source: Graph by Simon Bowler of 2nd Market Capital, Data compiled from S&P Global Market Intelligence LLC. See important notes and disclosures at the end of this article
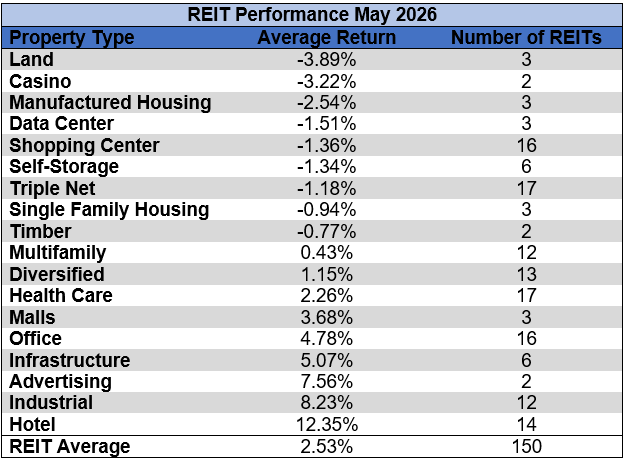
50% of REIT property types averaged a positive total return in May with a 16.24% total return spread between the best and worst performing property types. Hotels (+12.35%) and Industrial (+8.23%) led the REIT sector while Land (-3.89%) and Casinos (-3.22%) lagged.
Source: Table by Simon Bowler of 2nd Market Capital, Data compiled from S&P Global Market Intelligence LLC. See important notes and disclosures at the end of this article
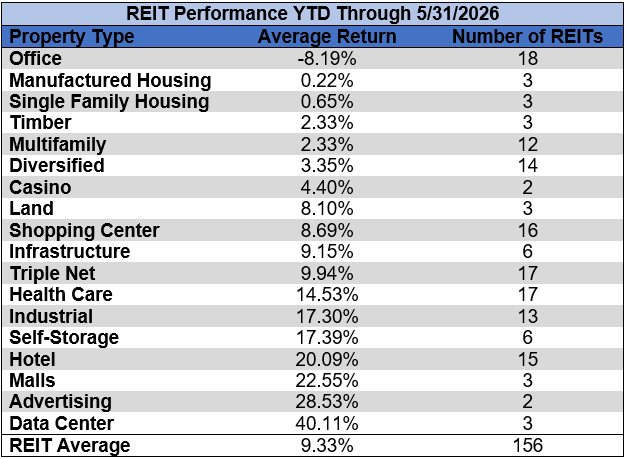
Office (-8.19%) remains the only property type in the red year-to-date. Data Centers (+40.11%) and Advertising (+28.53%) led the REIT sector over the first five months of the year.
Source: Table by Simon Bowler of 2nd Market Capital, Data compiled from S&P Global Market Intelligence LLC. See important notes and disclosures at the end of this article
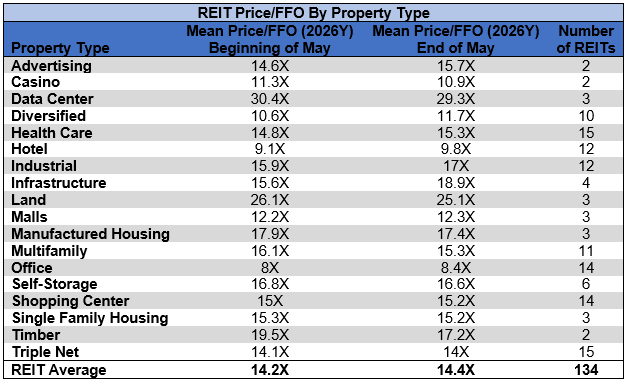
The REIT sector as a whole saw the average P/FFO (2026Y) increase from 14.2x to 14.4x during May. 50% of property types averaged multiple expansion and 50% averaged multiple contraction. Data Centers (29.3x), Land (25.1x), Infrastructure (18.9x) and Manufactured Housing (17.4x) currently trade at the highest average multiples among REIT property types. Office (8.4x) and Hotels (9.8x) are the only property types that average single digit FFO multiples.
Source: Table by Simon Bowler of 2nd Market Capital, Data compiled from S&P Global Market Intelligence LLC. See important notes and disclosures at the end of this article
Peakstone Realty Trust (PKST) was acquired and taken private by Brookfield Asset Management (BAM) in an all-cash transaction on May 6th. PKST shareholders received $21.00/share.
Veris Residential (VRE) was acquired and taken private on May 27th by an investor consortium led by Affinius Capital in partnership with Vista Hill Partners. It was an all-cash transaction in which VRE shareholders received $19/share.
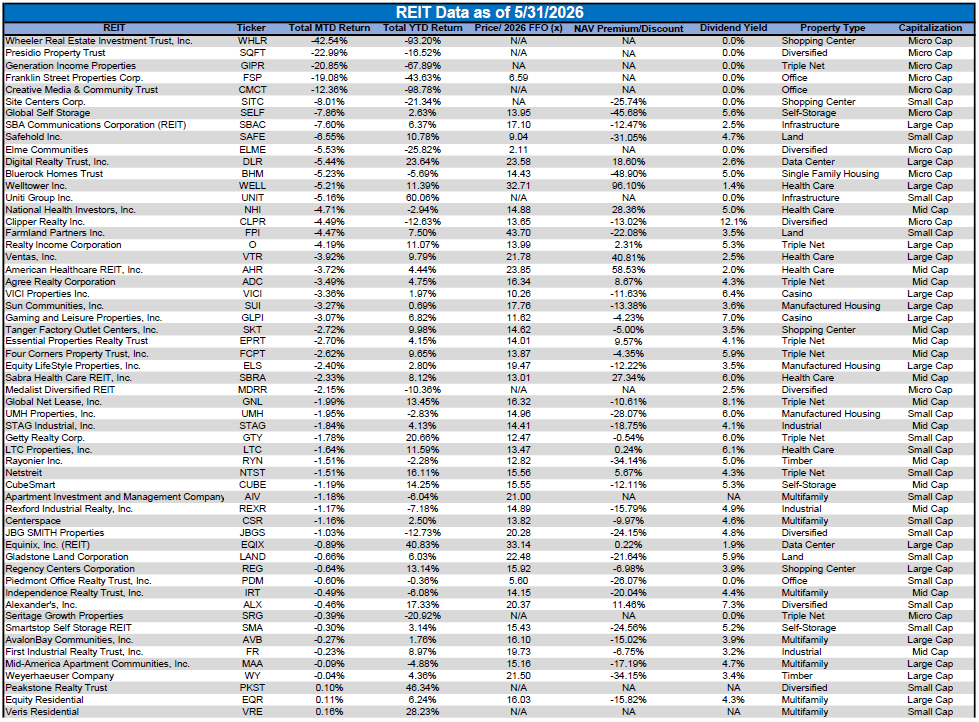
InnSuites Hospitality Trust (IHT) (+37.50%) was the best performing REIT in May as it saw a strong post-earnings price rebound. IHT announced that they are exploring diversification options and are considering a potential reverse merger with Unigen Power, a power generation company in which IHT has held an investment for years.
Wheeler REIT (WHLR) (-42.54%) was yet again the worst performing REIT in May as the share price continued to collapse. Wheeler now has the 2nd worst REIT performance in 2026 with a year-to-date return of -93.20%.
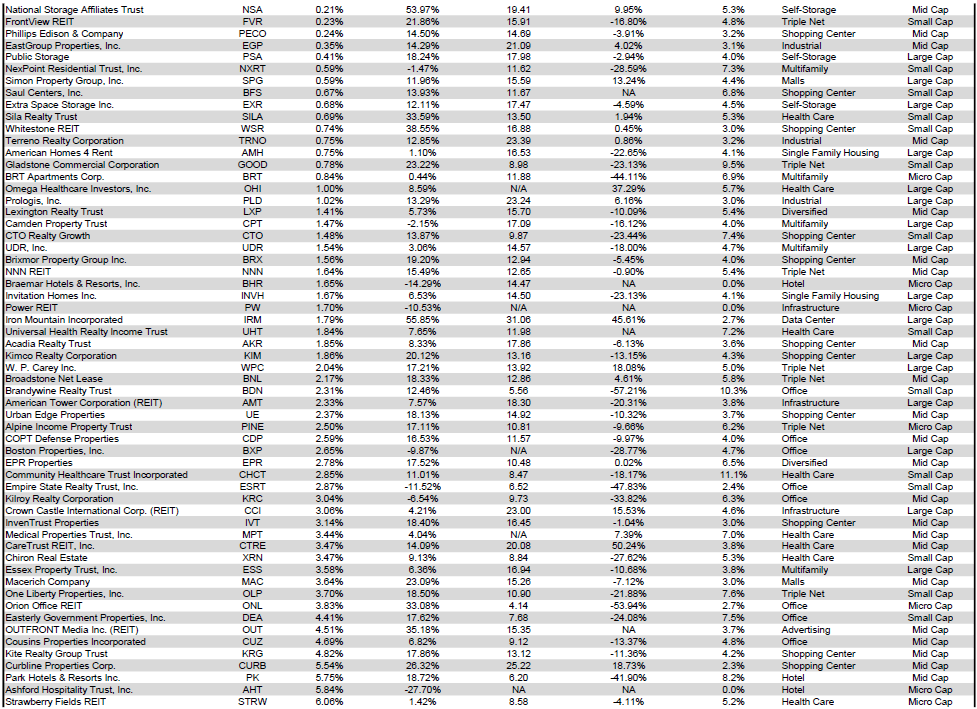
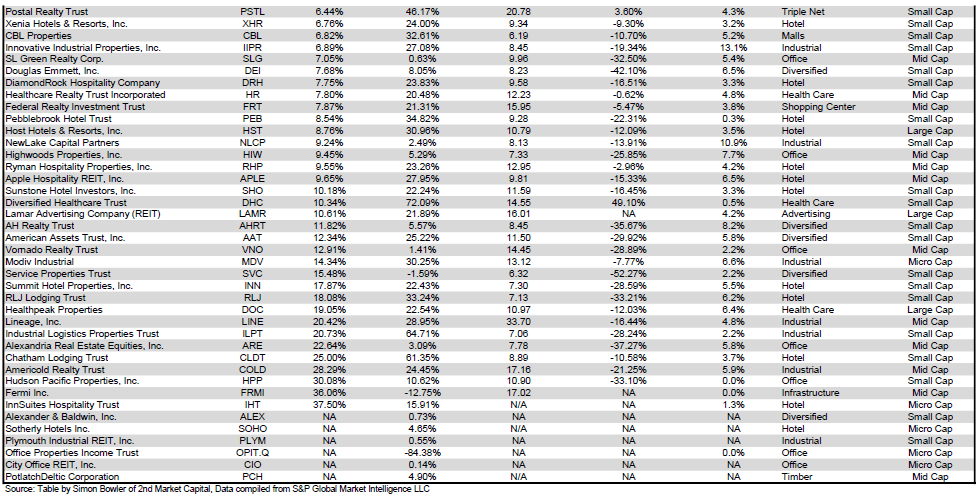
64% of REITs had a positive total return in May. REITs have averaged a strong +9.33% year-to-date total return in 2026, tremendously better than the dismal -7.33% return for the REIT sector over the first five months of 2025.
For the convenience of reading this table in a larger font, the table below is available as a PDF as well.
Source: Table by Simon Bowler of 2nd Market Capital, Data compiled from S&P Global Market Intelligence LLC. See important notes and disclosures at the end of this article
Source: Table by Simon Bowler of 2nd Market Capital, Data compiled from S&P Global Market Intelligence LLC. See important notes and disclosures at the end of this article
Source: Table by Simon Bowler of 2nd Market Capital, Data compiled from S&P Global Market Intelligence LLC. See important notes and disclosures at the end of this article
Dividend yield is an important component of a REIT's total return. The particularly high dividend yields of the REIT sector are, for many investors, the primary reason for investment in this sector. As many REITs are currently trading at share prices well below their NAV, yields are currently quite high for many REITs within the sector. Although a particularly high yield for a REIT may sometimes reflect a disproportionately high risk, there exist opportunities in some cases to capitalize on dividend yields that are sufficiently attractive to justify the underlying risks of the investment. I have included below a table ranking equity REITs from highest dividend yield (as of 5/31/2026) to lowest dividend yield.
For the convenience of reading this table in a larger font, the table below is available as a PDF as well.
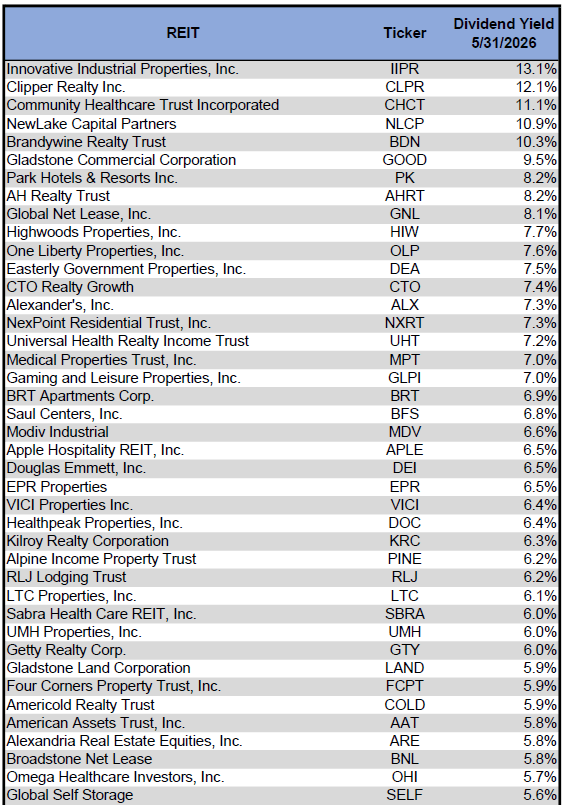
Source: Table by Simon Bowler of 2nd Market Capital, Data compiled from S&P Global Market Intelligence LLC. See important notes and disclosures at the end of this article
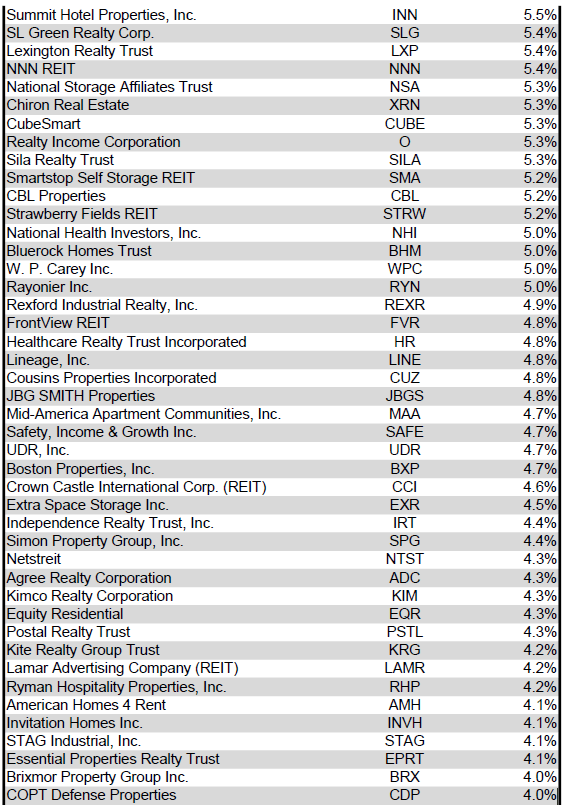
Source: Table by Simon Bowler of 2nd Market Capital, Data compiled from S&P Global Market Intelligence LLC. See important notes and disclosures at the end of this article
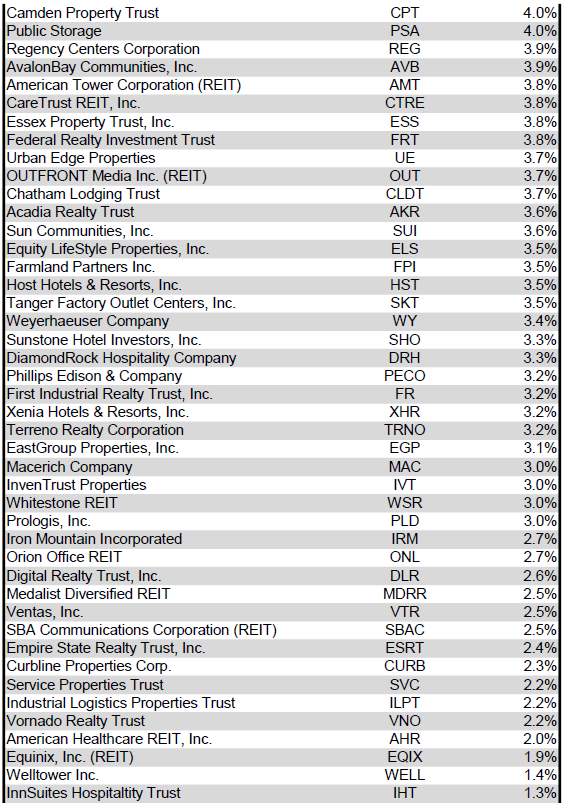
Source: Table by Simon Bowler of 2nd Market Capital, Data compiled from S&P Global Market Intelligence LLC. See important notes and disclosures at the end of this article
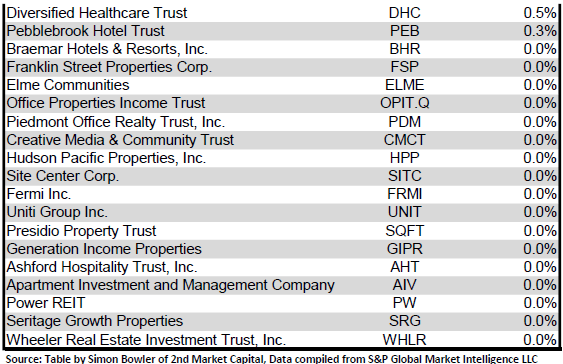
Source: Table by Simon Bowler of 2nd Market Capital, Data compiled from S&P Global Market Intelligence LLC. See important notes and disclosures at the end of this article
Although a REIT’s decision regarding whether to pay a quarterly dividend or a monthly dividend does not reflect on the quality of the company’s fundamentals or operations, a monthly dividend allows for smoother cash flow to the investor. Below is a list of equity REITs that pay monthly dividends ranked from highest yield to lowest yield.
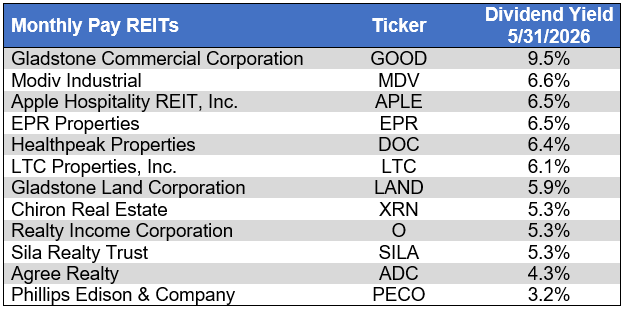
Source: Table by Simon Bowler of 2nd Market Capital, Data compiled from S&P Global Market Intelligence LLC. See important notes and disclosures at the end of this article
5 REITs hiked their dividends in May, all of which pay quarterly. Over the first 5 months of 2026, 41 REITs have raised their dividends. The +38.9% dividend increase from CBL & Associates Properties (CBL) was the biggest hike in May followed by +6.3% from Strawberry Fields REIT (STRW) and +5.9% from Independence Realty Trust (IRT).
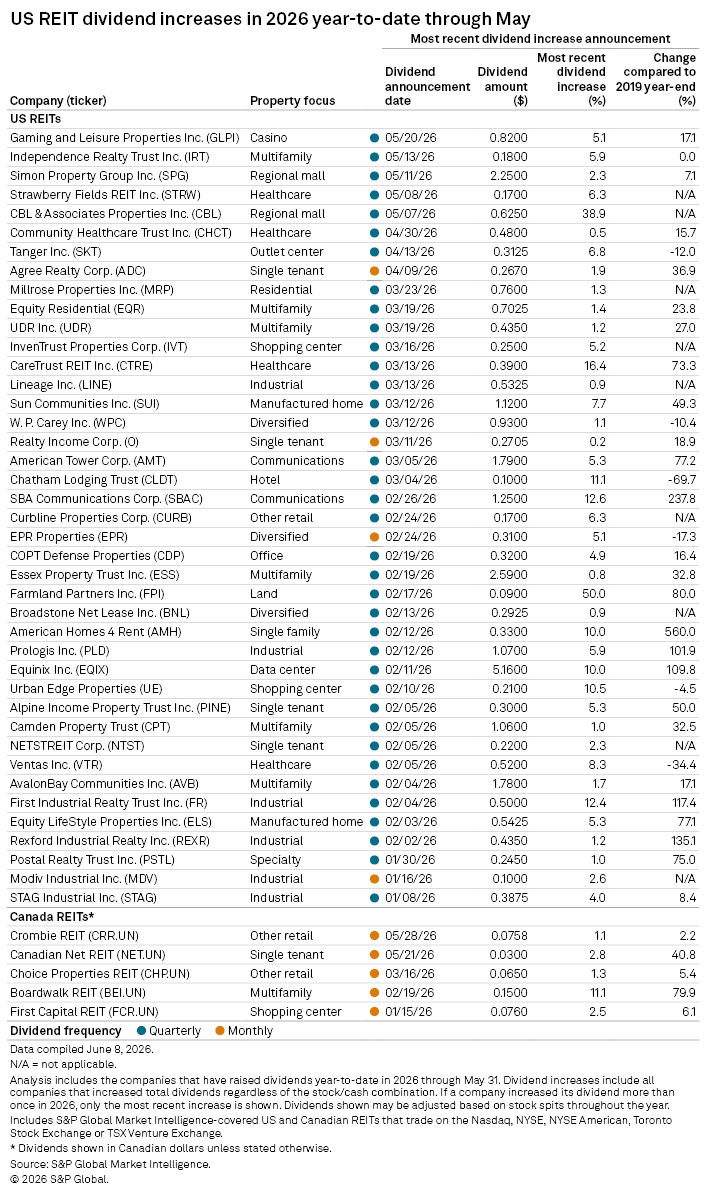
Source: S&P Global Market Intelligence
The number of corporate bankruptcies in May reached the highest monthly total thus far in 2026, although year-to-date bankruptcy filings remain 1.3% lower than over the same period of 2025. There were, however, more bankruptcy filings thus far this year than in the first 5 months of any year from 2011-2024.
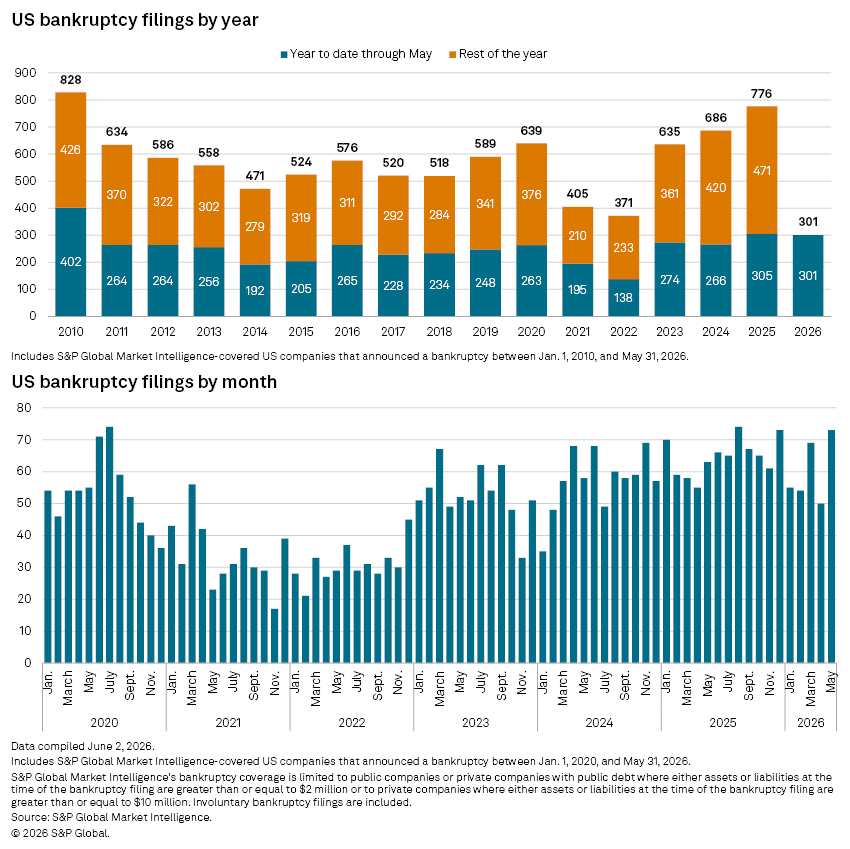
Source: S&P Global Market Intelligence
Below is a downloadable data table, which ranks REITs within each property type from the largest discount to the largest premium to NAV. The consensus NAV used for this table is the average of analyst NAV estimates for each REIT. Both the NAV and the share price will change over time, so I will continue to include this table in upcoming issues of The State of REITs with updated consensus NAV estimates for each REIT for which such an estimate is available.
For the convenience of reading this table in a larger font, the table below is available as a PDF as well.
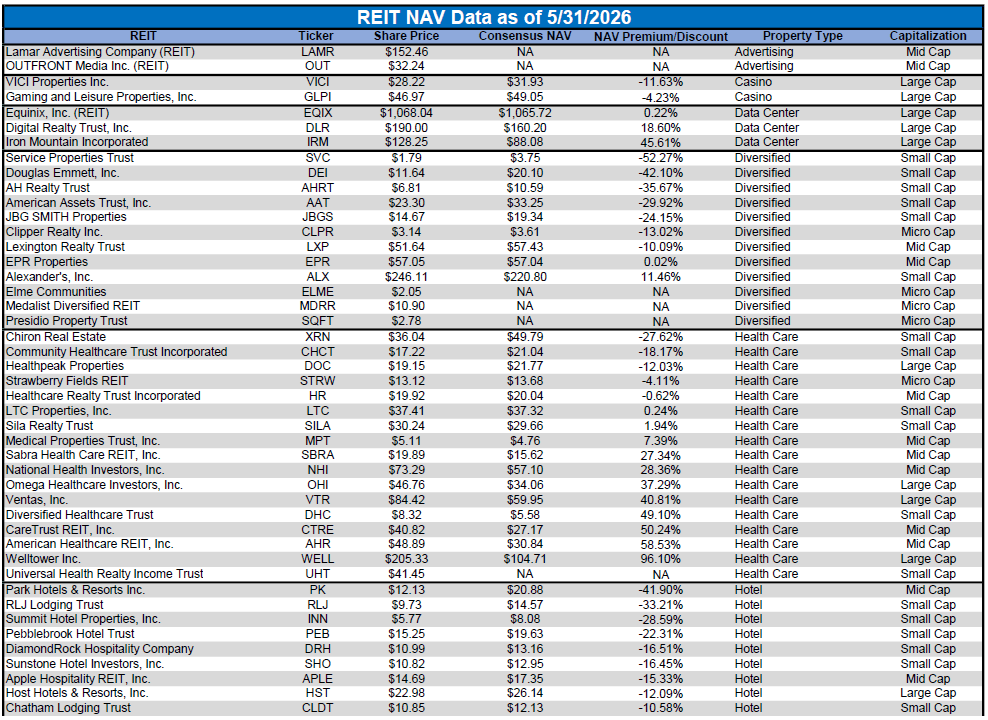
Source: Table by Simon Bowler of 2nd Market Capital, Data compiled from S&P Global Market Intelligence LLC. See important notes and disclosures at the end of this article
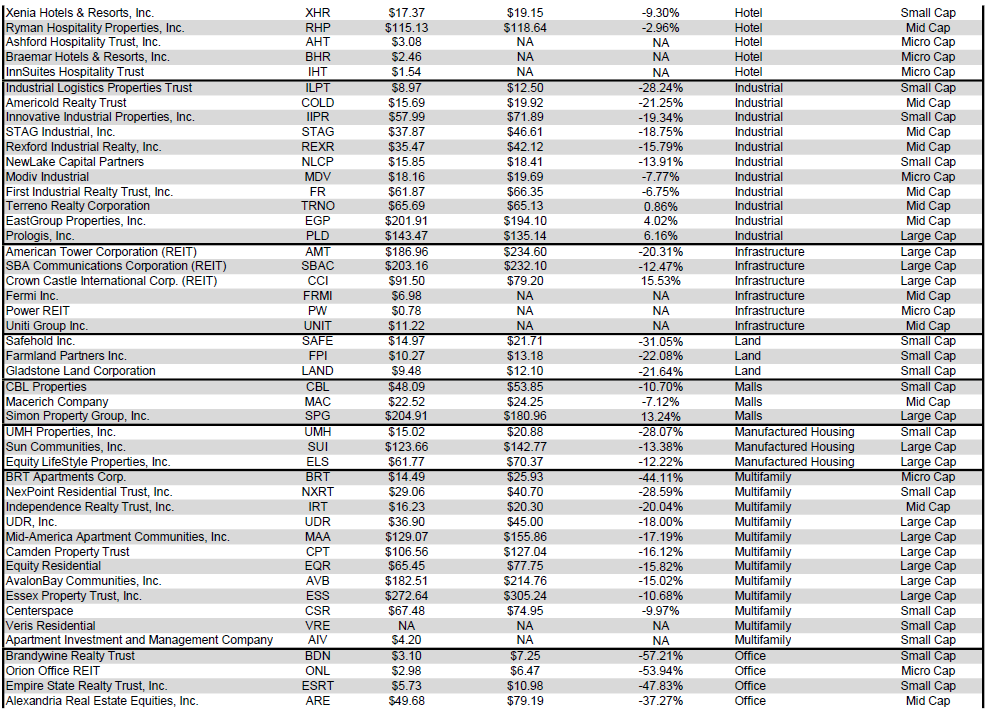
Source: Table by Simon Bowler of 2nd Market Capital, Data compiled from S&P Global Market Intelligence LLC. See important notes and disclosures at the end of this article
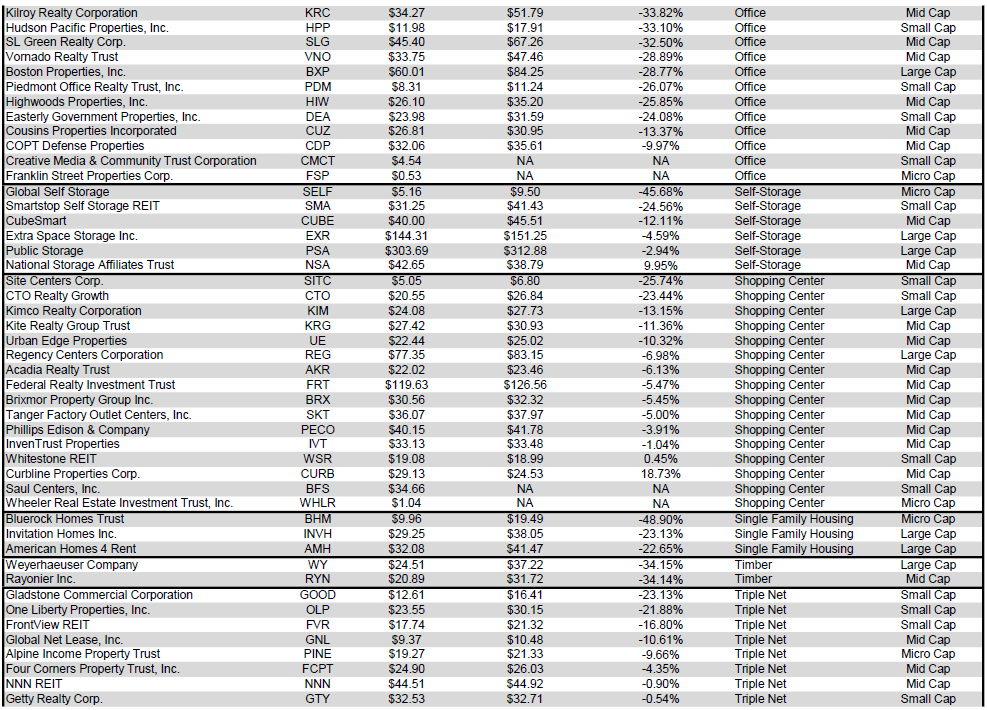
Source: Table by Simon Bowler of 2nd Market Capital, Data compiled from S&P Global Market Intelligence LLC. See important notes and disclosures at the end of this article

Source: Table by Simon Bowler of 2nd Market Capital, Data compiled from S&P Global Market Intelligence LLC. See important notes and disclosures at the end of this article
The large cap REIT premium (relative to small cap REITs) continued to widen in May and investors are now paying on average about 48% more for each dollar of 2026 FFO/share to buy large cap REITs than small cap REITs (18x/12.2x - 1 = 47.54%). As can be seen in the table below, there is presently a strong positive correlation between market cap and FFO multiple.
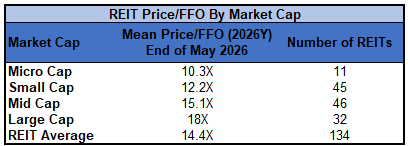
Source: Table by Simon Bowler of 2nd Market Capital, Data compiled from S&P Global Market Intelligence LLC. See important notes and disclosures at the end of this article
The table below shows the average NAV premium/discount of REITs of each market cap bucket. This data, much like the data for price/FFO, shows a strong, positive correlation between market cap and Price/NAV. The average large cap REIT (-1.02%) trades just shy of consensus NAV. Mid cap REITs (-5.36%) trade at a single-digit discount. Small cap REITs (-19.36%) trade for about 4/5 of NAV while micro caps (-28.40%) trade for less than 3/4 of NAV.
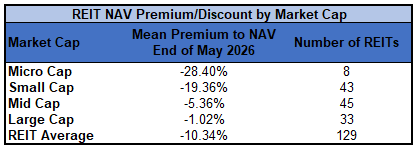
Source: Table by Simon Bowler of 2nd Market Capital, Data compiled from S&P Global Market Intelligence LLC. See important notes and disclosures at the end of this article
It is a rare opportunity to be able to sell a dollar for $1.20 or $1.30 or to buy a dollar for only $0.70 or $0.80. That, however, is effectively what many REITs have been doing. REITs that trade at an NAV premium have been issuing new common shares at prices well-above NAV and heavily discounted REITs have been repurchasing their own shares at prices far south of NAV. Each of these actions is accretive to NAV and is a useful tool that REITs can utilize when their share price becomes disconnected from their fair value.
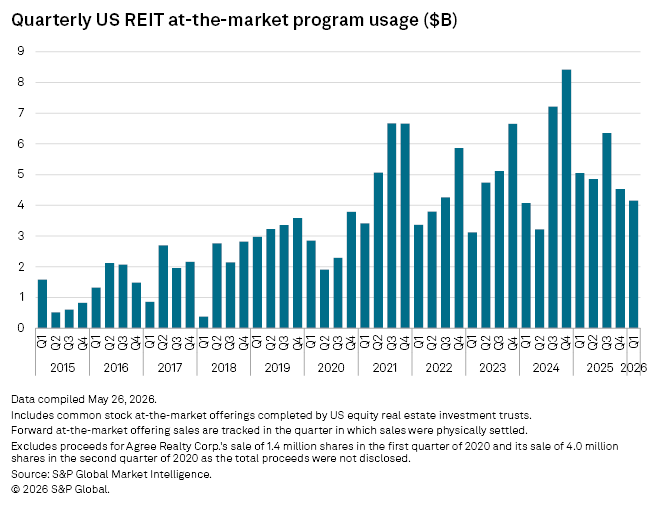
Source: S&P Global Market Intelligence
The overwhelming majority of equity raised through at-the-market share offerings during the first quarter of 2026 was from Healthcare and Data Center REITs trading at substantial premiums to NAV. Industrial and Single Tenant Retail REITs also utilized their ATMs albeit for smaller equity raises.
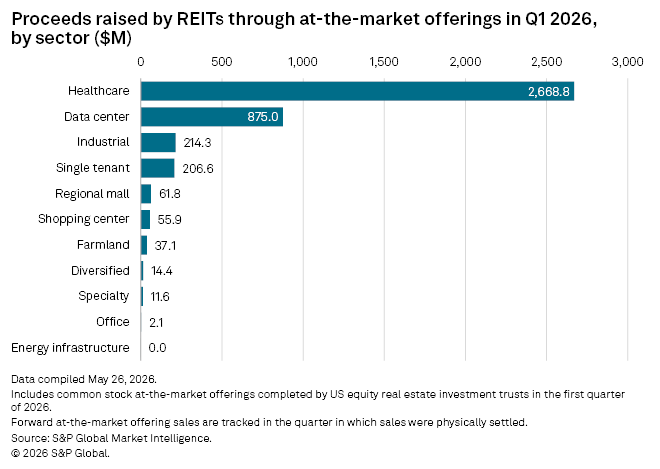
Source: S&P Global Market Intelligence
Welltower (WELL) had far and away the largest Q1 2026 total issuance of $1.557B of shares. This was followed by $875M from Digital Realty Trust (DLR), $800M from Ventas (VTR) and $135M from Terreno Realty (TRNO). About ¾ of the equity raised in Q1 was via direct share sales with about a quarter coming from settled forward sale agreements.
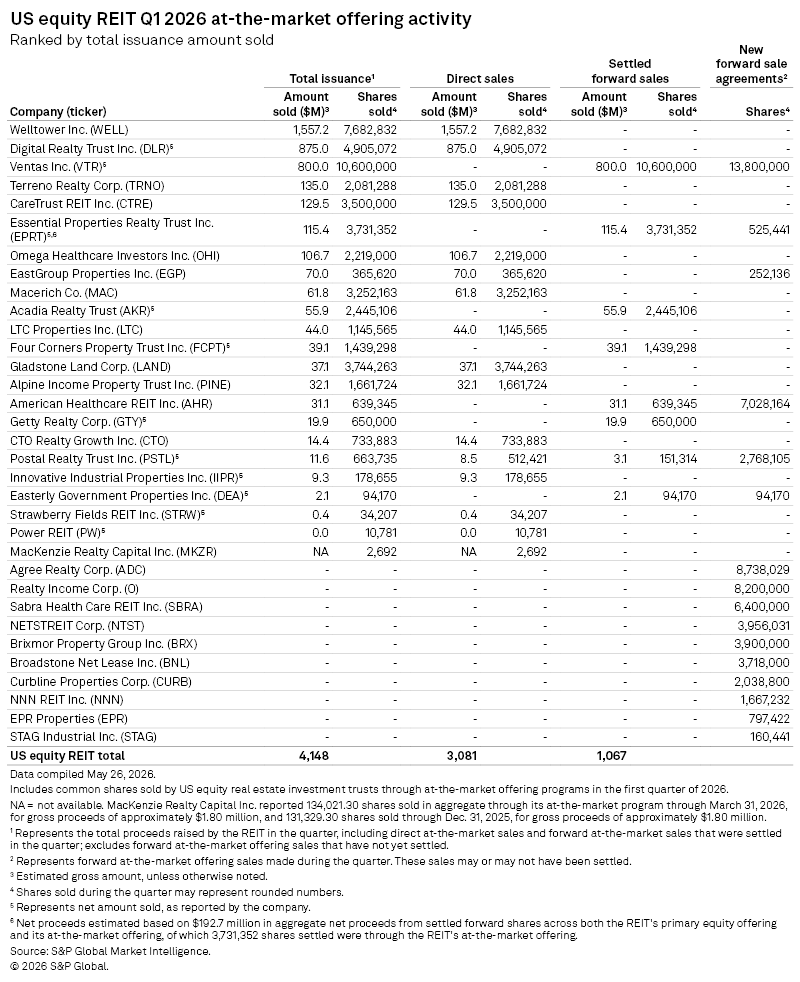
Source: S&P Global Market Intelligence
After a big spike in share repurchase activity in Q4 2025, REITs further ramped up buybacks in Q1 2026. This marked the 5th straight quarter of rising share repurchase activity as REITs capitalized on the attractive opportunity to buy back their own shares at wide NAV discounts.
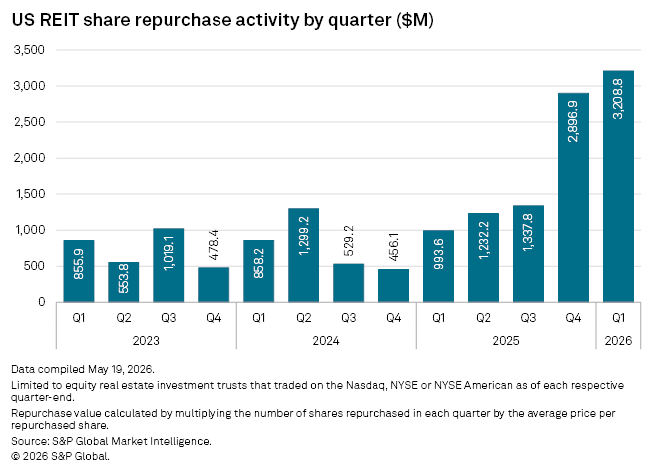
Source: S&P Global Market Intelligence
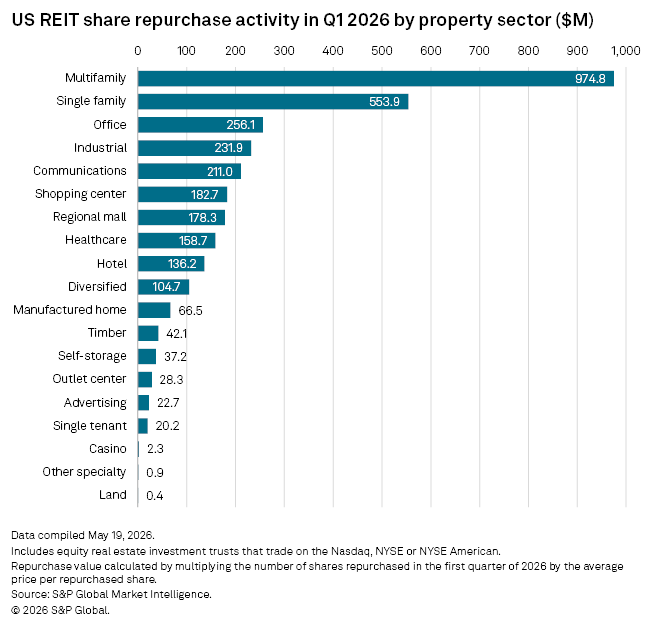
Repurchase activity was most aggressive among residential REITs in Q1 with Multifamily REITs buying back nearly a billion dollars worth of shares ($974.8M) and Single Family Home REITs buying back another $553.9M. Office REITs ($256.1M) capitalized on deep NAV discounts with accretive buybacks as well.
Source: S&P Global Market Intelligence
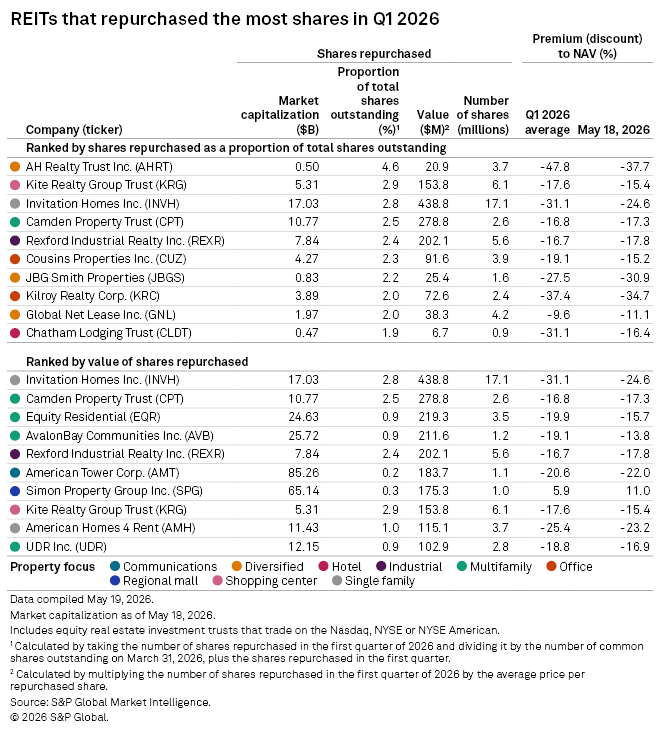
There were many big share repurchases in Q1 from REITs trading at substantial discounts to NAV, with the exception of Simon Property Group (SPG) which bought back shares at an average of 5.9% above NAV. AH Realty Trust (AHRT) bought back a whopping 4.6% of outstanding shares in Q1 at a remarkable 47.8% average discount to NAV. Although AHRT has rallied since then, the opportunity for highly accretive share repurchases remains. Other REITs with large repurchases in Q1 were Kite Realty Group (KRG) (2.9% of shares), Invitation Homes (INVH) (2.8% of shares), Camden Property Trust (CPT) (2.5% of shares) and Rexford Industrial Realty (REXR) (2.4% of shares). All still trade at a discount, so the opportunity for more buybacks remains.
Source: S&P Global Market Intelligence
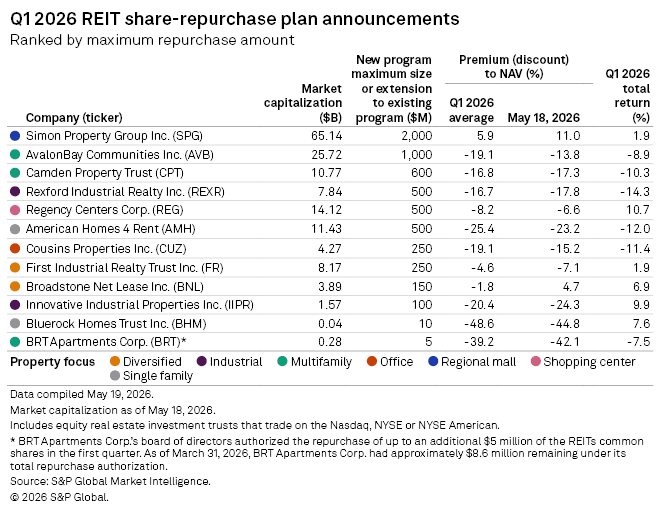
The elevated share repurchase activity in recent quarters is poised to continue throughout the rest of the year so long as NAV discounts persist. During Q1 2026, a litany of REITs announced new or extended repurchase programs. The largest share repurchase plans announced during the fourth quarter was from Simon Property Group with a maximum potential buyback of $2B of shares. This was followed by $1B from AvalonBay Communities (AVB), $600M from Camden Property Trust (CPT) and $500M each from Rexford Industrial Realty (REXR), Recency Centers (REG) and American Homes 4 Rent (AMH).
Source: S&P Global Market Intelligence
REIT investors thankfully also have access to a version of buying a dollar for far less than $1.00. With numerous quality REITs across multiple property types still trading for substantial discounts to NAV, there are a wide range of discounted common shares, preferred shares and baby bonds that can be scooped up for material discounts to their fair value. The vast majority of the high-quality discounted REITs pay a dividend, which provides cash flow while waiting for the valuation discount to close. This baseline yield plus share price upside has the potential for producing a very strong total return.
此内容由惯性聚合(RSS阅读器)自动聚合整理,仅供阅读参考。 原文来自 — 版权归原作者所有。