







ismagilov/iStock via Getty Images
We are pleased to provide you with Gator Financial Partners, LLC's, Gator Offshore Partners, Ltd.'s, and Gator Qualified Partners, LLC's (the (("Funds"))) 2026 1 st quarter investor letter. This letter reviews the Fund's 2026 Q1 and shares our investment thesis on Ameriprise Financial (AMP).
During the 1 st quarter of 2026, the Funds had weak absolute and mixed relative performance. We underperformed the broader market, but we outperformed the Financials sector benchmark. The Fund's holdings in small and mid-cap Financials slightly outperformed the largest bank and insurance companies again this quarter.
Our long positions in First Financial Bancorp (FFBC), Webster Financial (WBS), Northeast Bank (NBN), Esquire Financial (ESQ), and WEX (WEX) were the top contributors to the Fund's performance. The largest detractors were long positions in Compass (COMP), First Citizens (FCNCA), UBS Group (UBS), SLM Corp (SLM), and Barclays (BCS).
2026 Q1 Total Return Annualized Return Since Inception ¹ Since Inception ¹ Gator Financial Partners, LLC ² -7.22% 2,989.38% 21.32% S&P 500 Total Return Index ³ -4.33% 616.76% 11.74% S&P 1500 Financials Index ³ -8.89% 341.40% 8.72% Gator Offshore Partners, Ltd. ² -7.42% 357.63% 13.51% S&P 500 Total Return Index ³ -4.33% 331.36% 12.95% S&P 1500 Financials Index ³ -8.89% 240.74% 10.76% Gator Qualified Partners, LLC ² -5.75% 10.19% 13.81% S&P 500 Total Return Index ³ -4.33% 6.18% 8.33% S&P 1500 Financials Index ³ -8.89% -3.96% -5.24% Source: Gator Capital Management & Bloomberg
The first quarter was difficult. We had strong results in January, driven by small- to mid-cap regional bank earnings and the unexpected early closing of Compass's acquisition of Anywhere Real Estate (HOUS). In February, the market's tone changed. Market participants became concerned about private credit, which affected alternative asset managers and, to some extent, banks that have exposure to private credit by providing back-leverage to private credit funds. Also, there was a fresh round of fears that Large Language Models (("LLM" or "AI")) were threatening business models such as financial advisors and real estate brokers. Of course, March was dominated by volatility around the U.S./Iran conflict and the potential economic impact of a prolonged conflict and higher oil prices.
We were a bit more active than usual during the quarter. We used the January rally in Compass shares to cut the position by 25%. We also sold Webster Financial after it announced a sale to the Spanish bank Santander (SAN). We purchased new positions in two companies we previously owned: Ameriprise Financial (see investment thesis below) and Primerica (PRI). We also purchased shares in PROG Holdings (PRG), a rent-to-own and buy now, pay later (("BNPL")) business spun off from Aaron's Rents (AAN) six years ago.
Ameriprise Financial combines an independent advisory and brokerage platform with a captive asset manager and insurance/annuity operations. The company serves over 2 million individual, business, and institutional clients and, at year-end, had $1.7 trillion in assets on its platform. It is currently undervalued versus peers despite having one of the most compelling best-in-class growth stories in the wealth management space and a demonstrated commitment to returning capital to shareholders. We purchased Ameriprise in Q1 after the stock sold off on fears around AI disintermediation of financial advisors.
1. Ameriprise is a great business with high returns on equity, minimal need for capital, and a strong, long-tenured management team - Ameriprise generates exceptional returns on equity with an ROE of over 50%. This level of return is nearly unmatched among diversified financial services peers. It reflects the capital-light nature of the wealth management and asset management businesses, which together require minimal incremental equity to grow. The business is run by CEO Jim Cracchiolo, who has led the company since its 2005 spin-off from American Express (AXP). His two-decade tenure has produced a compounding machine.
2. Ameriprise trades at the lower end of its historical valuation range – Ameriprise's valuation is compelling in both absolute and relative terms. Despite consistently compounding earnings at double-digit rates, Ameriprise trades at 10.4x estimated next twelve-month (("NTM")) earnings per share (("EPS")). Historically, Ameriprise has traded between 8x and 16x NTM EPS. Also, Ameriprise trades at a discount to its wirehouse and large independent wealth management peers on a price-to-earnings basis.
3. We think Ameriprise frequently trades at a discount to peers because it is often classified as a Life Insurer – Ameriprise is often covered by sell-side research analysts who also cover life insurance companies. While Ameriprise does own a life insurer, this business accounts for only about 16% of Ameriprise's earnings, compared with 34% in 2005, when Ameriprise was spun off from American Express. Life insurance stocks trade at low valuations because their businesses are capital-intensive and often earn low returns due to the industry's high competitive intensity. In contrast, wealth management businesses should trade with higher valuations because they are not capital intensive and retain clients for long periods of time due to the trusted advice that financial advisors provide. We note that Ameriprise's life insurance company avoids the most price competitive areas of the life insurance industry. Ameriprise sells its insurance products through its own salesforce, so it does not compete with other life insurance companies in the most intense segments of the industry. We prefer to use a wealth management set of peers like Morgan Stanley (MS), Raymond James Financial (RJF), LPL Financial (LPLA), and Stifel Financial (SF) when evaluating Ameriprise.
4. Signature Wealth provides opportunity for increased share of wallet and reinforces flywheel - In mid-2025, Ameriprise launched its Signature Wealth offering. This product is a unified managed account that allows advisors to select institutional investment models for their clients. This platform allows advisors to offer more sophisticated investment offerings to their clients within a single account, and Ameriprise earns an incremental platform fee on those assets. This product allows Advisors to focus on clients and prospects rather than managing portfolios. Columbia Threadneedle is the asset management arm of Ameriprise. It is another beneficiary of the Signature Wealth product. Columbia is a quality manager on a standalone basis, generating attractive flows and returns across their strategies. They are also among the investment options that advisors can select through the Signature Wealth offering. Any flows directed to Columbia Threadneedle will benefit Ameriprise through the management fees they earn; this is incremental to the asset-based fees Ameriprise generates from client assets in the advisory business. This structure is relatively common at wirehouse firms but differentiated within the independent channel. Even independent managers with asset management capabilities are limited in their proprietary offerings compared to what Columbia Threadneedle can offer clients.
5. Compelling organic growth strategy discounted vs peers - Ameriprise has successfully leveraged platform improvements to drive retention and recruiting while also focusing on productivity per advisor. This is in contrast to others in the industry that have approached recruiting primarily through increasingly large economic incentives. We believe the wealth advisory space will only increase in competitive intensity over time, with improving retention from the wirehouses and continued pressure from financial sponsors further inflating the cost of advisor recruitment. Against this backdrop, we believe the company's focus on organic growth rather than compensation-led broker recruitment will deliver more durable earnings growth relative to peers. Over time, success should contribute to a narrowing valuation gap vs. independent peers.
6. Build out of bank lending was a missing piece that strengthens a holistic offering - Ameriprise has been building out its bank lending capabilities, further expanding into securities-based lending and HELOCs. Bank lending products were something the wirehouses and other independent advisors had had for years, and Ameriprise was missing them. We believe it's a notable upgrade to their existing platform that should bring revenue and help improve advisor retention and recruitment.
7. Cash generative business with a history of capital returns - Ameriprise has a history of strong free cash flow generation and has regularly returned over 80% of operating earnings to shareholders. Management has been able to invest while consistently reducing the share count and paying a healthy dividend. Since Ameriprise was spun off from American Express in 2005, the company has repurchased more than 60% of its original shares outstanding.
8. Franchise value if there is industry consolidation – Although we are not predicting a sale of Ameriprise, we note that there is a limited number of wealth management franchises available with the scale of Ameriprise. We believe both Goldman Sachs (GS) and UBS Group are potential acquirers of Ameriprise. Goldman lags Morgan Stanley in its Wealth Management scale. UBS mentioned on its latest earnings call that it is interested in gaining additional scale in its US wealth business.
1. AI disintermediation risk - The launch of an AI-powered wealth management tool by Anthropic (ANTHRO) has stoked fears about the disintermediation of human financial advisors. The concern is that AI could compress advisory fees industrywide, accelerate the shift toward self-directed investing, or erode Ameriprise's competitive advantage in advisor productivity. Ameriprise acknowledges this risk. We believe the risk is overstated in the near term, with the financial advisor relationship being built on behavioral coaching, trust, and personalized planning that AI does not easily replicate, especially during periods of market volatility. Morgan Stanley's stock largely recovered from the same fears, yet Ameriprise remains approximately 12% below its early February high.
2. Cash sweep and interest rate sensitivity - Ameriprise earns net investment income on residual cash held in brokerage sweep accounts, both on-balance sheet through the bank and off-balance sheet through money market fund arrangements. These residual cash balances generate meaningful income, which could be at risk if the federal funds rate falls. Beyond rate risk, there is a longer-term structural question about whether clients will increasingly seek higher-yielding alternatives to traditional brokerage cash sweep accounts, such as tokenized money market funds or stablecoin-like instruments, which could reduce aggregate sweep balances over time. Ameriprise is better positioned than most peers, given that its smaller bank subsidiary generates less income on residual cash than its peers.
3. Continued pressure on active management at Columbia Threadneedle - The secular shift from active to passive investing remains a headwind for all asset managers, including Columbia Threadneedle, Ameriprise's institutional asset management arm.
4. Market level risk - A substantial portion of Ameriprise's revenues and earnings are directly linked to the level of client invested assets, most prominently through wrap account advisory fees. A meaningful market correction would reduce this AUM base and, by extension, the advisory fees earned on it. While Ameriprise's diversification across wealth management, asset management, and insurance/annuity businesses provides some offset, the company remains meaningfully exposed to prolonged weakness in the market.
5. Long-term care insurance tail risk - Ameriprise carries a closed block of legacy long-term care (LTC) insurance policies that it stopped underwriting in 2002. LTC is notoriously difficult to price and reserve accurately. The company has taken substantial rate increases and has ceded a significant portion of the risk to reinsurer Genworth (GNW), which creates counter-party risk to Genworth. While the block is in run-off and management has been disciplined in addressing the reserve adequacy, the tail risk is real and could surface through adverse annual unlocking charges. We consider this a manageable but structurally unresolvable risk given the policies' remaining duration.
Below are the Fund's five largest common equity long positions. All data is as of March 31, 2026.
Société Generale (SCGLY)
BNP Paribas (BNPQY)
First Citizens Bancshares
Compass
Ameriprise Financial
Below is a table showing the Fund's positioning within the Financials sector as of March 31, 2026.
Long Short Net Alt Asset Managers 2.76% 0.00% 2.76% Capital Markets 20.93% 0.00% 20.93% Banks (large) 22.33% -15.41% 6.92%
27.66% -11.88% 15.77% Banks (small) 21.34% 0.00% 21.34% P&C Insurance 1.73% -6.27% -4.53% Life Insurance 11.37% 0.00% 11.37% Non-bank Lenders 4.25% -0.61% 3.64% Processors 10.90% 0.00% 10.90% Real Estate 6.42% -1.18% 5.23% Exchanges 0.00% 0.00% 0.00% Index Hedges 0.00% -42.71% -42.71% Non-Financials 0.00% 0.00% 0.00% Total 129.69% -78.06% 51.63%
The Fund's gross exposure is 207.75%, and its net exposure is 51.63%. From this table, we exclude fixed-income instruments such as preferred stock. Preferred stock positions account for an additional 9.14% of the portfolio.
Thank you for entrusting us with a portion of your wealth. We are grateful to you, our investors, who believe in and trust our strategy. On a personal level, Derek Pilecki, the Fund's Portfolio Manager, continues to invest more than 80% of his liquid net worth in the Fund.
As always, we welcome the opportunity to speak with you and discuss the Fund.
Sincerely,
Gator Capital Management, LLC
Gator Capital Management, LLC prepared this letter. Ultimus LeverPoint Fund Solutions, LLC, our administrator, is responsible for the distribution of this information and not its content. General Disclaimer By accepting this investment letter, you agree that you will not divulge any information contained herein to any other party. This letter and its contents are confidential and proprietary information of the Fund, and any reproduction of this information, in whole or in part, without the prior written consent of the Fund is prohibited. The information contained in this letter reflects the opinions and projections of Gator Capital Management, LLC (the "General Partner") and its affiliates as of the date of publication, which are subject to change without notice at any time subsequent to the date of issue. All information provided is for informational purposes only and should not be deemed as investment advice or a recommendation to purchase or sell any specific security. All performance results are based on the net asset value of the Fund. Net performance results are presented net of management fees, brokerage commissions, administrative expenses, and accrued performance allocation, as indicated, and include the reinvestment of all dividends, interest, and capital gains. The performance results represent Fund-level returns and are not an estimate of any specific investor's actual performance, which may be materially different from such performance depending on numerous factors. The market indices appearing in this letter have been selected for the purpose of comparing the performance of an investment in the Fund with certain well-known equity benchmarks. The statistical data regarding the indices has been obtained from Bloomberg and the returns are calculated assuming all dividends are reinvested. The indices are not subject to any of the fees or expenses to which the funds are subject and may involve significantly less risk than the Fund. The Fund is not restricted to investing in those securities which comprise these indices, its performance may or may not correlate to these indices, and it should not be considered a proxy for these indices. The S&P 500 Total Return Index is a market cap weighted index of 500 widely held stocks often used as a proxy for the overall U.S. equity market. The S&P 1500 Financials Index is a market cap weighted index of financial stocks within the S&P 1500 Super Composite Index we used as a proxy for the Financials sector of the U.S. equity market. An investment cannot be made directly in either index. The Fund consists of securities which vary significantly from those in the benchmark indices listed above. Accordingly, comparing results shown to those of such indices may be of limited use. Statements herein that reflect projections or expectations of future financial or economic performance of the Fund are forward-looking statements. Such "forward-looking" statements are based on various assumptions, which assumptions may not prove to be correct. Accordingly, there can be no assurance that such assumptions and statements will accurately predict future events or the Fund's actual performance. No representation or warranty can be given that the estimates, opinions, or assumptions made herein will prove to be accurate. Any projections and forward-looking statements included herein should be considered speculative and are qualified in their entirety by the information and risks disclosed in the Fund's Private Placement Memorandum. Actual results for any period may or may not approximate such forward-looking statements. You are advised to consult with your own independent tax and business advisors concerning the validity and reasonableness of any factual, accounting and tax assumptions. No representations or warranties whatsoever are made by the Fund, the General Partner, or any other person or entity as to the future profitability of the Fund or the results of making an investment in the Fund. Past performance is not a guarantee of future results. The funds described herein are unregistered private investment funds commonly called "hedge funds" (each, a "Private Fund"). Private Funds, depending upon their investment objectives and strategies, may invest and trade in a variety of different markets, strategies and instruments (including securities, non-securities and derivatives) and are NOT subject to the same regulatory requirements as mutual funds, including requirements to provide certain periodic and standardized pricing and valuation information to investors. There are substantial risks in investing in a Private Fund (which also are applicable to the underlying Private Funds, if any, in which a Private Fund may invest). Prospective investors should note that: ● A Private Fund represents a speculative investment and involves a high degree of risk. Investors must have the financial ability, sophistication/experience, and willingness to bear the risks of an investment in a Private Fund. An investor could lose all or a substantial portion of his/her/its investment. ● An investment in a Private Fund is not suitable for all investors and should be discretionary capital set aside strictly for speculative purposes. Only qualified eligible investors may invest in a Private Fund. ● A Private Fund's prospectus or offering documents are not reviewed or approved by federal or state regulators and its privately placed interests are not federally, or state registered. ● An investment in a Private Fund may be illiquid and there are significant restrictions on transferring or redeeming interests in a Private Fund. There is no recognized secondary market for an investor's interest in a Private Fund and none is expected to develop. Substantial redemptions within a limited period of time could adversely affect the Private Fund. ● Certain portfolio assets of a Private Fund may be illiquid and without a readily ascertainable market value. The manager's/advisor's involvement in the valuation process creates a potential conflict of interest. Instances of mispriced portfolios, due to fraud or negligence, have occurred in the industry. ● A Private Fund may have little or no operating history or performance and may use performance information which may not reflect actual trading of the Private Fund and should be reviewed carefully. Investors should not place undue reliance on hypothetical, pro forma or predecessor performance. ● A Private Fund may trade in commodity interests, derivatives, and futures, both for hedging and speculative purposes, and may execute a substantial portion of trades on foreign exchanges, all of which could result in a substantial risk of loss. Commodities, derivatives, and futures prices may be highly volatile, may be difficult to accurately predict, carry specialized risks and can increase the risk of loss. ● A Private Fund's manager/advisor has total trading authority over a Private Fund. The death or disability of a key person, or their departure, may have a material adverse effect on a Private Fund. ● A Private Fund may use a single manager/advisor or employ a single strategy, which could mean a lack of diversification and higher risk. Alternatively, a Private Fund and its managers/advisors may rely on the trading expertise and experience of third-party managers or advisors, the identity of which may not be disclosed to investors, which may trade in a variety of different instruments and markets. ● A Private Fund may involve a complex tax structure, which should be reviewed carefully, and may involve structures or strategies that may cause delays in important financial and tax information being sent to investors. ● A Private Fund's fees and expenses, which may be substantial regardless of any positive return, will offset such Private Fund's trading profits. If a Private Fund's investments are not successful or are not sufficiently successful, these payments and expenses may, over a period of time, significantly reduce or deplete the net asset value of the Private Fund. ● A Private Fund and its managers/advisors and their affiliates may be subject to various potential and actual conflicts of interest. ● A Private Fund may employ investment techniques or measures aimed to reduce the risk of loss which may not be successful or fully successful. ● A Private Fund may employ leverage, including involving derivatives. Leverage presents specialized risks. The more leverage used, the more likely a substantial change in value may occur, either up or down. The above summary is not a complete list of the risks, tax considerations and other important disclosures involved in investing in a Private Fund and is subject to the more complete disclosures in such Private Fund's offering documents, which must be reviewed carefully prior to making an investment. Derek Pilecki, CFA, Portfolio Manager March 2026 Gator Financial Partners, LLC Monthly Performance, net of Fees Performance and Risk Analysis* *Top 5 positions represent delta adjusted position values. *Statistics reflect the performance of Gator Financial Partners, LLC since inception. OVERVIEW Gator Financial Partners, LLC, Gator Financial Partners Offshore, Ltd., and Gator Qualified Partners, LLC (the “Funds”) are long/short equity hedge funds focused on the Financials sector. The portfolios are built by performing intensive bottom-up fundamental research on both long and short positions. The Funds are concentrated on the portfolio manager’s highest conviction ideas. The Funds favor small and mid-cap companies and companies with less research coverage from the sell-side. The sector requires specialized knowledge to correctly analyze the companies. Therefore, the portfolio manager believes there are regular opportunities for sector specialists doing fundamental research. The Fund’s goal is to maximize total return while accepting short-term periods of volatility due to the portfolio’s concentration. Growth of $1,000,000 ¹ The chart displays the performance of three investment options from 2008 to 2026. The y-axis represents the value in millions of dollars, ranging from $1 M to $40 M. The x-axis shows the years from 2008 to 2026. The legend indicates: Gator Financial Partners, LLC shows a sharp upward trend starting around 2020, reaching its peak near $35 M in 2025 before a slight dip in 2026. The S&P 500 TR and S&P Financials 1500 TR show much slower, more linear growth, ending the period at significantly lower values. Line chart showing the growth of $1,000,000 invested in Gator Financial Partners, LLC, S&P 500 TR, and S&P Financials 1500 TR from 2008 to 2026. The chart shows that Gator Financial Partners, LLC significantly outperformed the other two indices over the period, ending at $30,887,759 in 2026, while the S&P 500 TR ended at $7,169,163 and the S&P Financials 1500 TR ended at $4,408,811. Performance is calculated net of fees and expenses Assets Under Management Funds AUM $232.5 M Strategy AUM $421.9 M Firm AUM $437.9 M About Gator Gator Capital Management, LLC was founded in 2008 by Derek Pilecki and is located in Tampa, Florida. Gator Capital Management is registered with the SEC as a Registered Investment Advisor. Registration of an investment advisor does not imply any level of skill or training. Gator manages Financials sector long/short portfolios for private partnerships, mutual funds, and separately managed accounts. "Strategy AUM" is defined as AUM (both in pooled vehicles and in SMAs) that invest predominantly in securities in the Financials sector. "Firm AUM" is defined as all AUM. ¹ Fund figures include reinvestment of income. Indices are not available for direct investment. Investment Terms Gator Financial Partners Offshore, Ltd. Monthly Performance, net of Fees Gator Qualified Partners, LLC Monthly Performance, net of Fees DISCLAIMER This document is provided for informational purposes only, is confidential, and may not be reproduced or circulated without the prior written consent of Gator Capital Management, LLC. It does not constitute an offer to sell or a solicitation of an offer to buy any interest in Gator Financial Partners, LLC, Gator Financial Partners Offshore, Ltd., or Gator Qualified Partners, LLC (the (("Funds"))). Any such offer will be made only to Accredited Investors or Qualified Purchasers by means of a Confidential Private Placement Memorandum (PPM). Past performance is not a guarantee of future results. An investment in the Funds is speculative and involves a high degree of risk, including the possible loss of principal; there is no assurance that investment objectives will be achieved or that any investor will receive a return of capital. Investors in Gator Financial Partners, LLC and Gator Financial Partners Offshore, Ltd. (each a 3(c)(1) fund) must qualify as "Accredited Investors," and investors in Gator Qualified Partners, LLC (a 3(c)(7) fund) must qualify as "Qualified Purchasers," as defined by the U.S. Securities and Exchange Commission. Interests in the Funds are subject to substantial restrictions on withdrawal, redemption, and transfer, and no secondary market exists or is expected to develop. Investors must be prepared to bear the economic risk of an investment for an indefinite period. The Funds' fees and expenses may be substantial and may offset any profits. Prospective investors should consult their legal, tax, and financial advisors regarding eligibility and suitability prior to investing. Comparisons to indices are for illustrative purposes only. The S&P 500 Total Return Index and S&P 1500 Financials Total Return Index are unmanaged, market-cap-weighted indices representing the broad U.S. equity and financials markets, respectively. Indices are not subject to fees or expenses, and an investment cannot be made directly in them. The Fund's portfolio differs significantly from these benchmarks in terms of holdings, risk profile, and concentration; therefore, these indices should not be considered a proxy for Fund performance. Gator Capital Management, LLC 2502 N. Rocky Point Dr., Suite 665Tampa, FL 33607(813) 282-7870investorrelations@gatorcapital.com
Year Jan Feb Mar Apr May Jun Jul Aug Sep Oct Nov Dec YTD S&PFinancials 2026 5.48% (6.28%) (6.15%) (7.22%) (8.89%) 2025 7.03% (2.05%) (5.15%) 0.42% 7.87% 5.70% 6.62% 4.05% 0.32% (5.25%) 5.69% 4.00% 31.94% 14.34% 2024 1.51% 3.54% 5.34% (2.36%) 4.32% (0.54%) 11.56% (1.62%) 0.97% 1.63% 18.19% (4.97%) 41.88% 29.78% 2023 15.60% 1.55% (13.35%) 7.00% (1.06%) 6.74% 10.35% (2.47%) (0.17%) (2.52%) 9.25% 9.63% 44.18% 11.66% 2022 1.07% 0.68% (5.70%) (3.99%) 1.45% (12.06%) 8.13% 3.44% (13.40%) 10.84% 3.93% (4.04%) (11.99%) (10.15%) 2021 0.00% 7.09% 3.32% 3.20% 1.16% (1.95%) (0.01%) 1.50% 0.78% 1.35% (0.94%) 6.52% 23.86% 34.55% 2020 (2.26%) (11.02%) (36.23%) 22.38% 7.75% 10.71% 5.46% 7.01% 0.29% 6.24% 15.61% 5.17% 18.39% (1.91%) 2019 17.76% 4.44% (2.60%) 4.25% (4.74%) 4.58% 1.05% (4.86%) 7.60% 0.98% 2.87% 3.32% 38.10% 31.22% 2018 8.59% (2.36%) (4.57%) 1.20% 0.44% (0.12%) 4.06% 0.22% (1.31%) (7.37%) (0.29%) (14.01%) (16.02%) (13.03%) 2017 1.19% 5.58% (3.54%) 1.09% (3.75%) 3.02% 4.78% (3.21%) 4.67% (1.12%) 3.50% 5.14% 17.98% 20.89% 2016 (12.35%) 2.02% 8.77% 4.68% 3.00% (9.79%) 12.80% 4.95% (0.77%) 1.72% 23.95% 5.67% 48.08% 24.28% 2015 (6.78%) 3.56% (2.34%) 3.67% 0.74% (0.90%) (3.78%) (4.55%) (5.96%) 4.60% 2.49% (9.85%) (18.55%) (0.72%) 2014 0.27% 8.12% (0.48%) (2.69%) (0.49%) 0.88% (2.27%) 1.44% (1.87%) (2.89%) (0.04%) (0.52%) (0.97%) 14.89% 2013 8.26% 3.97% 4.11% 3.80% 5.89% (3.78%) 2.70% (3.51%) (0.71%) 5.06% 4.73% 2.68% 37.76% 34.20% 2012 4.55% 1.65% 7.51% (1.37%) (0.67%) 3.99% 1.94% (1.57%) 2.40% 7.61% 1.72% 3.01% 34.87% 26.90% 2011 14.03% 9.26% (4.00%) 1.20% 6.43% 1.32% 0.36% (5.00%) (5.34%) 2.76% (0.41%) (4.34%) 15.34% (15.01%) 2010 (2.97%) 6.01% 4.55% 5.77% (3.00%) (17.98%) 3.93% (6.65%) 7.03% 7.73% 5.61% 5.13% 12.39% 13.31% 2009 22.60% 7.00% 19.23% 11.00% 17.19% 20.93% 7.90% 15.28% (0.50%) (12.63%) (0.87%) 8.65% 186.31% 15.46% 2008 (1.89%) (7.24%) (21.90%) 16.63% (7.93%) 11.02% (15.26%) (33.48%)
Net Performance Gator S&P500 TR S&P 1500Financials TR Top 5 Long Positions % of NAV* Annual Compound Return 21.32% 11.74% 8.72% Société Générale S.A. 8.86% Cumulative Return 2,989.38% 616.76% 341.40% BNP Paribas 6.87% % of Profitable Percentage 62.44% 68.08% 57.28% First Citizens Bancshares 6.60% Compass Inc. 6.42% Ameriprise Financial Inc. 5.05%
Risk Analysis Gator S&P500 TR S&P 1500Financials TR Annualized Volatility 25.67% 15.50% 21.80% Sharpe Ratio (RFR) 0.71 0.63 0.32 Sortino Ratio (RFR) 1.25 1.10 0.56 Downside Deviation 15.60% 10.17% 15.07% 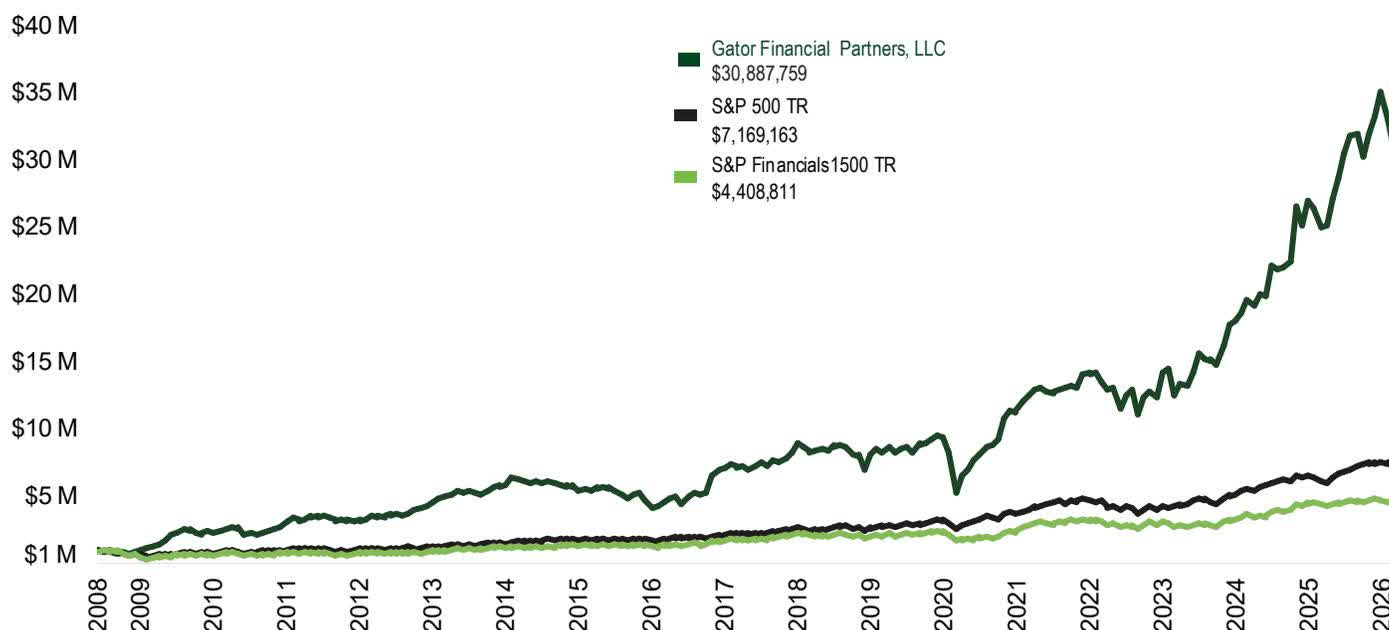
Gator Financial Partners, LLC Gator Financial Partners Offshore, LLC Gator Qualified Partners, LLC Fund Structure 3(c)(1) fund U.S. on-shore flagship Cayman-based offshore feeder to flagship fund 3(c)(7) fund for Qualified Purchasers Management Fee 1% 1% 1% Incentive Fee 20% 20% 20% Other Expenses 0.17% 0.24% 0.20% (Expense Cap) Primer Brokers Interactive Brokers (IBKR) & Jefferies (JEF) Interactive Brokers & Jefferies Interactive Brokers Legal Kilpatrick Townsend Kilpatrick Townsend Kilpatrick Townsend Auditor Kaufman Rossin & Co. Kaufman Rossin & Co. KPMG Third-Party Fund Administrator Ultimus Leverpoint Private Fund Solutions Ultimus Leverpoint Private Fund Solutions Ultimus Leverpoint Private Fund Solutions Minimum Investment $250,000 $250,000 $500,000 Lock-ups No No No Liquidity Monthly Monthly Monthly Redemption Notice 10 Business Days 10 Business Days 10 Business Days Transparency Portfolio Positions Released Quarterly Portfolio Positions Released Quarterly Portfolio Positions Released Quarterly
Year Jan Feb Mar Apr May Jun Jul Aug Sep Oct Nov Dec YTD S&PFinancials 2026 5.46% (6.35%) (6.27%) (7.42%) (8.89%) 2025 7.01% (2.16%) (5.28%) 0.38% 7.84% 5.60% 6.59% 3.99% 0.21% (5.27%) 5.63% 3.89% 30.90% 14.34% 2024 1.47% 3.33% 5.23% (2.39%) 4.17% (0.66%) 11.50% (1.74%) 0.87% 1.61% 18.06% (5.05%) 40.30% 29.78% 2023 15.80% 1.37% (13.70%) 6.97% (1.33%) 6.88% 10.42% (2.68%) (0.23%) (2.53%) 9.00% 9.41% 42.42% 11.66% 2022 1.12% 0.63% (5.90%) (4.04%) 1.25% (12.12%) 8.01% 3.23% (13.49%) 10.79% 3.75% (4.16%) (13.12%) (10.21%) 2021 (0.30%) 6.68% 3.01% 1.86% 0.95% (2.13%) 0.92% 1.22% 0.59% 1.29% (1.05%) 7.72% 22.30% 34.55% 2020 (2.52%) (11.34%) (36.53%) 21.64% 7.19% 10.24% 4.99% 6.46% (0.19%) 5.88% 16.20% 8.62% 17.54% (1.91%) 2019 17.62% 4.17% (2.55%) 4.32% (5.21%) 4.86% 0.98% (5.28%) 9.61% 0.80% 2.65% 3.14% 38.53% 31.22% 2018 8.57% (2.48%) (4.61%) 1.15% 0.35% (0.17%) 4.00% 0.12% (1.35%) (7.59%) (0.43%) (14.08%) (16.89%) (13.03%) 2017 1.16% 5.51% (3.60%) 1.02% (3.81%) 2.97% 4.71% (3.30%) 4.62% (1.17%) 3.58% 5.01% 17.25% 20.89% 2016 (13.03%) 1.79% 9.46% 4.36% 2.83% (9.31%) 13.57% 4.80% (0.84%) 1.68% 25.56% 5.55% 49.97% 24.28% 2015 (6.15%) 3.56% (1.93%) 3.67% 0.68% (0.40%) (4.33%) (4.00%) (6.15%) 4.01% 2.40% (9.43%) (16.89%) (0.72%) 2014 (2.56%) (0.46%) 0.94% (2.56%) 1.66% (2.65%) (3.35%) (0.18%) (0.40%) (9.28%) 11.80%
Year Jan Feb Mar Apr May Jun Jul Aug Sep Oct Nov Dec YTD S&PFinancials 2026 5.52% (5.82%) (5.16%) (5.75%) (8.89%) 2025 5.58% 3.99% 0.37% (5.29%) 5.20% 6.49% 16.92% 5.41%
Editor's Note: The summary bullets for this article were chosen by Seeking Alpha editors.
Editor's Note: This article covers one or more microcap stocks. Please be aware of the risks associated with these stocks.
此内容由惯性聚合(RSS阅读器)自动聚合整理,仅供阅读参考。 原文来自 — 版权归原作者所有。