









Donny DBM/iStock via Getty Images
The Calamos Phineus Long/Short Fund (CPLIX) declined 3.6% in Q1 (Class I shares at NAV) versus a 4.6% price decline for the S&P500 Index. The Iran war will likely be the defining event of 2026, but any interpretation requires two perspectives. The nature of the shock is only half the story—at least as important is the context in which it arrived. Today's reflationary regime was already narrowing the path for risk assets. Iran is the amplifier, not the cause.
The Fund maintained modestly positive net equity exposures through Q1, but this understates the conviction behind our defensive posture. Through February and March, combined short exposure and notional option protection matched 100% of NAV—a deliberate response to a backdrop we characterized as peak reflation, and to a geopolitical trajectory whose tail risks were multiplying.
The April 8 ceasefire announcement was judged a buy signal for US equities. On April 7, ahead of Trump's deadline for further escalation, the Fund added upside call options against its index hedges—a structure that proved suited to the moment. As markets recovered and oil prices fell from peak levels, net equity exposure rose above 60%, allowing the Fund to recover its Q1 drawdown.
April has confirmed rather than contradicted our broader framework for 2026. The Iran conflict has proven to be a strategic amplifier—clarifying rather than deciding the equity cycle. Earnings resilience remains the market's primary anchor, the AI narrative its organizing theme, and the US industrial and defense complex its most durable source of opportunity. None of this was altered by the shock.
The remainder of 2026 will likely see further upheaval, given that Trump's policy activism implies volatility in both positive and negative directions. Our emphasis remains on the preservation of optionality and the disciplined management of exposures—all amid an active opportunity that exhibits remarkable momentum character. Structure is strategy for today's long/short world.
The first quarter of 2026 has delivered on the more turbulent half of our forecast while confounding its more orderly assumptions. Operation Epic Fury was not in our script, but it was in our framework. We argued that the equity bull market would encounter significant headwinds in H1, that peak reflation was approaching and that volatility would rise. All of this has come to pass—though the catalyst has been more dramatic and more dangerous.
We had anticipated an interim peak for US equity benchmarks in the first quarter followed by a correction of 10%+ through the summer, with the best opportunities for reinvestment emerging ahead of the midterm elections in autumn. The Iran war has precipitated and dramatized a correction that one could have reasonably judged probable. Yet it has not resulted in a bear-market, though events have narrowed the margin for error.
The Fund emphasized downside protection in Q1—with a non-trivial prospect of broader regional escalation, such coverage was obligatory. But this was blunted by the nature of the shock itself which drove an internal rotation quite different from the conventional risk-off playbook, compounded by the grinding, range-bound nature of the decline. The Fund pivoted on April 7, adding upside optionality that raised net equity exposures into the 60%–70% range. ¹
Market behavior since the inception of Epic Fury is instructive: there was no disorderly collapse. Investors are treating the energy shock as temporary and the geopolitical disruption as containable. We share this view as a base case. April's recovery is so far typical of the aftermath of geopolitical shocks, and what follows depends heavily on the context in which the shock emerged.
From this perspective, the stagflationary nature of the shock is an amplifier rather than a decisive shift in the equity cycle. The risk of a US recession has increased, but it is still not high. Importantly, AI has retained its primacy as the market's organizing theme. Equity resilience is easier to sustain when the assets that define the cycle's leadership continue to attract capital and deliver earnings.
Why did Trump act now? Our answer is the convergence of the political calendar and strategic conviction. This was his last window to deploy military force on a significant scale before the midterm elections erode his congressional margin. Trump has been consistent on the Iranian threat for years, never a believer in diplomacy as anything but a mechanism for delay. For a president conscious of legacy, dismantling a uniquely malignant regime ² carries appeal.
The minimum objective of Epic Fury—the degradation of Iran's nuclear and ballistic missile capability—appears essentially complete. The wider objective is a pacified Iran that no longer projects an external threat, while regime change in the Western liberal sense was always a delusion ³ . What likely emerges is a fractious internal struggle among competing factions whose primary motivation is the preservation of power and wealth. Pandora's box has been opened.
Iran is a new country since February 28. The former Supreme Leader has not been buried—an Islamic impossibility that speaks to the regime's paralysis. ⁴ His successor governs from an undisclosed location. The IRGC ⁵ and the conventional government are pulling in opposite directions: the former committed to resistance, the latter seeking an off-ramp. The Islamabad talks require only an ambiguity that each side can present as victory. The parallel with Saddam Hussein after Kuwait is not lost. ⁶
Iranian regime change was always a political chimera. What is required—and what remains possible—is a shift in internal priorities much as the Mao-to-Deng transition reoriented Chinese society without displacing the regime. Some argue the Iranian political class has been hardened ⁷ by the conflict, yet history suggests the opposite is more likely. ⁸ The cessation of hostilities invariably surfaces internal discontent, and in Iran that discontent was conspicuous before the first strike.
History offers a hopeful lens. Societies reliably moderate after the actual experience of war—when its costs are visibly seen and felt across the governing classes. Europe after 1945, America after Vietnam, Russia after Afghanistan: the pattern is consistent. Few within today’s IRGC lived through the existential crucible of the Iran-Iraq war. Belligerence is easy in its absence. The cessation of hostilities has a precedent for shifting priorities—even among hardliners.
Some of our interpretation is colored by the view that this conflict marks the beginning of the end of the Iranian regime as currently constituted—but the transition will take time and likely entail the construction of alternative oil supply channels. From that point of view, Trump may not receive the political benefit, and in that narrow sense he has miscalculated. Of course, history has a longer and sometimes kinder memory than the electoral cycle.
For the broader geopolitical map, the Iran confrontation is one front in a more extended Sino-American cold war. Iran supplied China with cheap energy and a lever of influence. Simultaneously, the Trump administration has been systematically curtailing Chinese influence in Central and South America; Venezuela is a case in point. The logic is consistent: constrain the supply lines and compress the geographic reach of Chinese strategic ambition.
China’s role has been revealing. Beijing exercised its Security Council veto to shield Iran from a UN resolution authorizing an international coalition—a scored point in the great power competition. But its support has been conspicuously absent: negligible air defense capability supplied, no bilateral meetings convened, no material assistance once the strikes began. The Gulf states have taken note ⁹ and are signaling that their security relationships with Washington will deepen.
In April, the crisis has transitioned into a clearly defined “leverage phase” ¹⁰ —execution risk is elevated, but diplomacy is not broken. A ceasefire of some kind was always probable. Confusion within Iran—the absence of identifiable leadership willing to expose itself—facilitated such an arrangement. No formal negotiation is required when there is ambiguity about who speaks for the regime. Washington can call it a ceasefire; Iran’s rulers need not contradict.
May will bring some validation to these assumptions, and China’s role in the process will be revealing. Through its Belt and Road initiative, China has a major stake in the future stability of Iran, and in this sense, it can be a winner in any proper détente. The run-up to the planned Xi-Trump meeting in Beijing on May 15 is the window for a material de-escalation of the Strait of Hormuz—and the moment at which China’s true priorities will become legible.
Early April delivered a ceasefire that we judged a buy signal for equity exposures. After emphasizing downside protection through Q1, ¹¹ the Fund added upside call options on April 7 to capture asymmetric participation in a recovery without abandoning the defensive posture entirely. Our conviction was straightforward: both sides had more to gain from an off-ramp than from escalation, and the market had not yet priced that probability correctly.
The relief rally that began on April 8 reflects the emergence of a political path—US coercion is working, and the media’s portrayal of a strategic draw provides Iran its necessary off-ramp. Prior to hostilities, any shift in Iranian nuclear intent was rejected outright: “Why should we negotiate away what you cannot take from us militarily?” ¹² Both sides escalated until Iran chose to descend the ladder. Talks are now the priority.
The ceasefire warranted an increase in equity exposure not because it resolved anything, but because it transformed the conflict’s character. What followed was the highest-level direct engagement between Washington and Tehran in more than a decade, with an agenda encompassing sanctions relief, frozen assets, the Strait of Hormuz, Lebanon, and Iran’s nuclear posture. The conflict had moved from signaling into structured bargaining. Markets do not require resolution—only a credible path toward it.
This ceasefire deserves careful interpretation. The Trump administration issued an ultimatum with a precise deadline—and began acting on it eight hours early, striking petrochemical sites, bridges and rail lines before the clock expired. For the first time in the long history of US ultimatums to Tehran, the threat was demonstrably credible. Iran deployed civilians and social media figures to shield installations. What followed was not negotiation but controlled escalatory descent—coercion, not diplomacy.
For the Western media, this confrontation has produced a draw rather than a victory—and draws invite revisionism. Trump’s problem is that military force could not be applied without genuine economic disruption. He may have miscalculated ¹³ that Iran could be brought to heel while domestic opinion remained quiescent. Instead, much of the establishment (in Europe especially) has treated the conflict as an instrument to damage Trump ¹⁴ rather than a legitimate security operation.
There is always a danger of confusing military dominance with strategic success. Iran’s rulers understand that much of the West just wants a quiet life without disturbance. Yet the regime faces its own internal reckoning: popular discontent is profound, compounded by genuine fear within the leadership that the current pause is merely the prelude to further strikes. It is that fear that makes resolution credible. The linchpin for markets remains the complete reopening of the Strait—which we expect by mid-May alongside the Trump-Xi meeting in Beijing.
America has three non-negotiable demands that will define the boundary of any agreement—permanent elimination of nuclear capability, dissolution of the proxy network, and constraints on ballistic missiles. Paradoxically, the nuclear question is the most tractable. Iran’s enrichment infrastructure has been degraded; Tehran has learned that nuclear capability is not the deterrent it once hoped. Nuclear concessions will be forthcoming, but Iran’s leadership is acutely aware of what this would hand Trump politically, implying the most deliberate procrastination on precisely the most tractable issue.
The proxy question is diminished by events. Hezbollah has been systematically decapitated—forty-one senior leaders assassinated since the truce began. Syria has been lost. The Houthis are silent. The Iraqi militias, enriched by years of relative peace have little appetite for sacrifice. A regime that once commanded a coherent arc of regional influence is now administering its remnants. Iran entered this conflict with a proxy network as its primary strategic asset outside its own borders; it will exit with something considerably diminished.
The ballistic missile demand is harder—this remains Iran’s existential insurance and surrendering it is a different order of concession from the nuclear question. Iran demonstrated it could strike Tel Aviv and the Gulf capitals with meaningful effect. But Trump’s impatience for a deal may ultimately prove the decisive variable here. His instinct that a residual missile threat keeps the Gulf states permanently anchored to American protection is not without logic and may ultimately shape the terms.
The Strait of Hormuz is dominating media coverage, but this belongs in a different analytical category. The war was not initiated over the Strait—it was open on the day hostilities began. Oman’s Foreign Minister has clarified that no tariff regime will be imposed on transit; in his formulation, the Strait is a geographical fact, not a human construct. The American calculus is that reopening follows automatically from the resolution of the substantive demands. The unspoken vulnerability is that the Strait’s leverage is a wasting asset ¹⁵ for Iran.
Complex adversarial settlements rarely progress linearly. The pattern—initial contact, stalling, more coercion, renewed engagement—is the mechanism by which both sides discover what the other will accept. Washington has maintained maximum pressure through the naval blockade while dispatching senior envoys; Tehran has hardened its public tone while privately signaling willingness to talk. This is not a contradiction—it is the architecture of coercive diplomacy.
The multilateral structure of the Islamabad talks—Tehran, Washington, Riyadh, and Beijing simultaneously engaged—reinforces their credibility. China operates as a ceiling on escalation: its direct energy exposure makes prolonged disruption as costly for Beijing as for any party. The China-Pakistan five-point initiative elevates the framework beyond a bilateral one into a more durable recognized structure. Distributed influence of this kind lowers tail risk by making outright collapse harder to sustain.
Mature engagement is precisely where things stand today. Negotiations on the nuclear chapter have moved beyond principles to the technical parameters of a workable agreement—the duration of enrichment constraints, the sequencing of sanctions relief, and the verification architecture. The logic for continued engagement remains intact. Market behavior is consistent with this progress, despite the headline signaling that can unsettle observers.
Regional wars rarely catalyze bear markets, but the March revolt reflected the economic nature of the oil shock. The war is delivering a stagflationary impulse at the moment when the macro environment is ill-equipped to absorb it. US inflation was already stuck near 3%, and 10-year Treasury yields have broken above the 4.30% ceiling. Central banks appear disarmed: despite heightened risks to growth, they are unable to ease without entrenching inflation expectations.
The critical threshold is well understood: WTI crude sustained above $100/barrel for months raises recession risk. This is the number that matters and the constraint that will shape the pace and terms of the diplomatic resolution. The market has been pricing a temporary disruption, not a structural one. That assumption is reasonable as a base case, but it is fragile and the margin for error narrows with every week that the Strait of Hormuz remains compromised.
How narrow is that margin? The sense of crisis is palpable, yet there is much the market does not know. And its ignorance may be working in the direction of reassurance rather than alarm. Global petroleum inventories ¹⁶ stood at 8.2 bn barrels as of January, the highest level since the Covid-era inventory build of early 2021. At normal Hormuz throughput, that stockpile represents more than a year's worth of lost Persian Gulf shipments—and that assumes no workarounds.
It is this buffer—unevenly accessible but genuinely large—that explains why markets have registered disruption rather than catastrophe. The important unknown is Chinese oil stocks: estimates place them at 1.3–1.4 bn barrels, but the true figure may be considerably larger. ¹⁷ The market's controlled reaction to the Strait closure is less a sign of complacency than a reflection of a strategic buffer whose true depth no one outside of China fully knows. ¹⁸
Equally critical is the widespread resilience of the US private sector. In particular, America's labor market remains a still underestimated structural underpinning. It is fundamentally changed from its pre-Covid incarnation—less cyclical, less prone to rapid job destruction, more resilient to moderate shocks. Employers who secured good workers through the post-Covid years are reluctant to release them. This is the backdrop defining why a US recession is unlikely in 2026.
All of this should be viewed in the context of the new post-Covid investment regime. During the years of the Great Moderation, exogenous shocks were deflationary. Today, inflationary impulses are persistent and frequent. The Iran war is emblematic: amplifying the characteristics of a decade already defined by higher structural inflation, fiscal excess and geopolitical fragmentation. Our diagnosis of peak reflation ¹⁹ is validated and accelerated simultaneously.
It amplifies trans-Atlantic divergence and the fragmentation of interests within Europe. It reinforces America's comparative advantage in security and deepens the investment case for defense and reindustrialization. These are not tactical themes of a passing crisis—they extend beyond any ceasefire and are consistent with the reflationary policy backdrop that defines this decade.
For the equity world, the winner has been energy—but this may prove tactical rather than durable. The odds of WTI crude below $70 by the midterms are better than even.
We prefer the derivative themes in energy infrastructure, strategic defense and their industrial adjacencies—large capital goods companies exposed to the rearmament and reindustrialization agenda. The world of perpetual geopolitical conflict makes these not merely tactical but structurally relevant for the remainder of the decade.
The comparative resilience of select large-cap technology is unsurprising given the AI tailwinds including February's funding of its ugly duckling—OpenAI. Here, the elevated short interest and protection accumulated since last October have provided a technical cushion. With a few exceptions, the AI trade has been cleansed of its most speculative momentum; the fast money has exited. What remains is less vulnerable to the kind of momentum unwind that has afflicted banks, small caps and other reflation proxies.
One analytical casualty of March was the international rotation trade. The thesis that market leadership had passed to non-US markets has not survived its first serious test. The strategic vulnerabilities of Europe are again on full display. The argument for a sustained rotation away from American supremacy—benign US reflation, a weakening dollar, improving global growth expectations—has been materially undermined. The case is unanswerable.
More fundamental visibility has begun to emerge through the April reporting season. Strong corporate earnings are why Q1 is judged as a correction within a volatile range rather than a bear market . This explains rotation across sectors and styles rather than material downside (>10%) for US benchmarks. To wit, more than 50% of Russell 3000 Index members were down more than 20% in Q1. Beyond the midterms, interest rates are a greater risk than the profit cycle.
The Iranian din will fade—negotiations have replaced uncontrolled escalation and further de-escalation should emerge by mid-May. But elevated oil is just one component of the higher-for-longer regime for interest rates that preceded this conflict and will outlast it. The bond market remains the honest barometer of the cost surge embedded in the macro environment. It is still an open question—to be answered by markets first—how this disruption registers in sequential economic data over the coming quarters.
The United States is more of a winner than a loser in the Iran conflict. Relative self-sufficiency in oil insulates its consumers and industrial base from the worst of the price shock, while higher energy prices accelerate earnings growth across its energy complex—thus supporting profit growth above 15% for the major indices. In a crisis that has exposed every structural vulnerability of Europe, America’s comparative advantages have been reinforced rather than eroded.
The catalyst for Iranian de-escalation which will return investors to more prosaic debates is China. Beijing has a deep interest in a stable Iran—as its energy supplier, Belt and Road partner, regional counterweight. The economic cost of Strait closure will support its willingness to act, but naturally at a price . The deal Beijing extracts will include US technology export concessions—with US AI capex running at $600 billion annually against China’s $120 billion, Beijing cannot afford delay in this race.
April’s equity recovery has therefore been quick, but not careless. Of the major debates hanging over US equities—Iran’s impact on oil prices and the durability of the AI narrative—the latter remains decisive and integral to the bull market since late 2022. The hedging accumulated across the technology sector since October has provided a cushion. But the reason the bear market narrative has remained dormant is earnings resilience, which more than geopolitics explains the market’s relative calm.
The preferred long opportunity remains cyclical rather than defensives. The Fund is focused on the US industrial sector in particular where multiple tailwinds converge: supply chain onshoring, defense spending, AI buildout, and energy infrastructure. These are multi-year allocation decisions, not cyclical impulses. As one example, US utility capex is running at a ~15% annualized pace driven by data center power demand. Earnings visibility is unusually high, and investor positioning is not extreme.
The outlook for technology is complicated. The hyperscaler ecosystem has become an increasingly tactical trade. The ongoing funding of OpenAI is stimulating competitive spending and sustained demand despite its scale, particularly for NVIDIA, Microsoft, Oracle and Amazon. That said, OpenAI’s business model is not sustainable. The concentration of exposure among all the major players creates a vulnerability that hinges on timing, not probability. SoftBank selling its good assets to fund its bad (OPENAI) is an early symptom.
Consumer discretionary offers a tactical opportunity worth capturing but not overstaying. De-escalation in Iran, Fed rate cuts, declining fuel prices—all will support sentiment. The deeper mechanism is mortgage relief if the 10-year Treasury can remain anchored near 4% and mortgage rates can decline toward 5%. The latter threshold makes homebuying materially affordable in a housing market frozen for years. Regional banks could be direct beneficiaries of this cycle—precisely as the competitive pressure from private credit begins to ease.
War has obfuscated what will shortly be the next drama. The announcement of a new Fed Chair on May 15—with the role assumed by June 17—may move markets before a single decision is taken. Contrary to consensus, Kevin Warsh will deliver multiple rate cuts between July and September. Retreating oil prices and a growth mandate from the Trump administration will ensure another easing cycle. The transmission to the economy will be direct, particularly if US mortgage markets are revived.
All of this is caveated by the most consequential interventionist of our times: Donald J. Trump. No president in half a century has exercised comparable influence over market fortunes—his commentary and policy agenda have driven both the five best and five worst trading days of his second term. His deliberate ambiguities and reversals are not aberrations; they are the operating method. For investors, this demands an ability to manage volatility and a sharper distinction between tactical positioning and strategic conviction.
March brought into sharp relief the difficulty of constructing a genuinely defensive portfolio in this regime. Bonds have failed as a hedge—yields have risen as equity prices have fallen. Gold and silver proved unreliable: too widely owned to function as refuges in a stagflation shock. The correlation between bonds and equities that underpinned the classic 60/40 allocation for decades cannot be relied upon when inflation is the predominant concern. There is no easy solution—only a disciplined and active navigation of the available options.
The buy signal from early April is more tactical than strategic—none of this alters the broader framework for 2026. Both the geopolitical trajectory and the macro backdrop will remain fluid, with large swings encompassing both upside and downside surprises. Ironically, this is consistent with the pattern outlined in our January outlook. Our emphasis remains on preserving optionality. What has transpired since confirms rather than contradicts that thesis.
Both hands on the wheel.
Michael Grant, Co-CIO
Index hedges were actively and aggressively managed during the quarter and into April. The S&P 500 Index (SPY) short was trimmed from 68% to 48%, with a new short in the Nasdaq Index (QQQ) initiated at 22% to hedge the increasing risk in technology names. These adjustments reflected our view that downside risk (and the momentum trade) was concentrated in mega-cap technology rather than the broader market.
For the quarter, the Fund declined 3.5% net of fees while the S&P500 Index declined 4.6% in price terms. Longs detracted approximately 580 basis points while shorts including hedges contributed 255 basis points. US positions detracted 219 basis points overall, while international positions detracted 122 basis points. Despite the crisis, there was no “flight to quality” in fixed income markets; bonds were not an effective hedge.
Some of the Fund’s defensive positioning was blunted by the unusual playbook of the Iran shock, in which long cyclical exposure suffered downside volatility while key defensive sectors underperformed. Gold and silver sold off as aggressively as many other sectors. More than 50% of Russell 3000 Index members were down more than 20% in Q1. The big shift favored the energy complex where the Fund had negligible long exposure.
The Fund added substantial put option protection (>50% of NAV) through February and March in addition to the individual and index shorts. This type of hedging does not materially contribute to performance during modest corrections of less than 5% (the “insurance deductible”), but we judged it suitable for our mandate, protecting fund capital from more dramatic downside tails had events played out deleteriously.
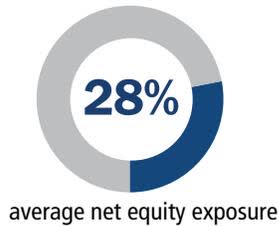
As the sell-off accelerated and broadened into late March, the Fund shifted the balance of downside protection from outright shorts to more put option exposure that would allow the Fund to benefit from any April recovery; this proved the correct shift. After entering the quarter with modest aggregate equity exposures of 10%–15%, delta-adjusted net equity exposure increased to 28.9% at quarter-end.
Before fees and expenses
STRATEGY CONTRIBUTION TO Q1 PERFORMANCE Long -5.80% Short 2.55% Net Return -3.25% Past performance is no guarantee of future results.
The challenge in March was protecting capital from the unexpected nature of the geopolitical shock while retaining our conviction that this would not fundamentally disrupt the US economic or equity cycle. This implied a tactical, active approach to managing the market dislocation including how equity weakness was used to reallocate long capital.
To keep our clients updated on our views and these shifts, updates were published on April 1, 2026 (“ Both Hands on the Wheel ”) and again on April 14, 2026 (“ Both Hands on the Wheel—Addendum ”).
As noted, net equity exposures increased in April with the addition of index call options to capture the upside of any ceasefire announcement on April 8. Equally, this increase reflected rising conviction in pro-cyclical themes as the Iranian conflict would gradually be resolved for financial markets, primarily through the transmission mechanism of oil prices.
To some degree, the first quarter unfolded as anticipated in our 2026 outlook: an early-year attempt at new highs followed by rising volatility and a material pullback, particularly among mega-cap technology leaders. The S&P 500 peaked in February before declining ~9% in a little over a month as the war drove a spike in energy prices, interest rates, and volatility.
Index and sector hedges contributed 301 basis points and offset a material portion of long stock weakness. The SPY index short contributed 195 basis points and the new QQQ technology short contributed 55 basis points, tactically capturing the Nasdaq's disproportionate sell-off. The industrial hedge (XLI) contributed 41 basis points while a new semiconductor short (SMH) paired with new semi longs detracted 24 basis points. A volatility hedge (VXX long) contributed 36 basis points as volatility spiked but remained remarkably contained in the context of events.
Mega-cap positioning detracted 192 basis points as the market's most crowded names bore the brunt of the correction. Microsoft was the largest detractor at 100 basis points on a 23% decline as its "safe haven" status was challenged by growing fears that AI could disrupt software businesses more broadly. Rising capex intensity shifted the relevant valuation metric from earnings (28x trailing) to free cash flow (40x trailing).
Amazon detracted 55 basis points on a 10% decline as investors digested guidance that capex would rise from $132 billion in 2025 to $200 billion in 2026—enough to flip free cash flow negative. Despite the deratings, we remain positive on both Amazon and Microsoft; each has navigated investment cycles prudently in the past and achieved high returns on spending.
NVIDIA detracted 36 basis points, and the long was increased from 2.7% to 3.9%, narrowing the underweight versus the S&P 500 where it carries a 7.7% weight. The stock has marked time since last summer, partly because OpenAI has lost ground to rivals Alphabet and Anthropic, and partly because investors favored memory names as higher-beta plays on AI infrastructure. Calendar 2026 and 2027 estimates are poised to move higher.
The Tesla short was closed for modest gains on broader market weakness, while the Fund avoided losses in other Mag 7 names. In aggregate, mega-cap exposure averaged 12.2% versus 33.3% for the S&P 500—our deliberate underweight absorbed 192 basis points of loss compared with 388 basis points at benchmark weights, a relative benefit of ~200 basis points.
Q1 witnessed a shift in the AI narrative from adoption to accountability. For two years, markets accepted hyperscaler capex commitments at face value. But as spending projections approach their ceiling and analyst estimates begin to plateau, the burden of proof is shifting. The question is no longer whether AI spending continues—but whether returns on that spending justify the valuations of its beneficiaries.
Data on AI adoption is moving in the right direction, but the pace remains notably linear. The share of US workers using AI on the job has climbed to 43%, saving roughly 2% of weekly hours. These are real productivity gains but not the step-change that might rewrite the macro narrative overnight. The sectors enjoying the most adoption are those with the most to gain: knowledge-intensive businesses where payroll is the dominant cost line.
One tension is the emerging divergence within AI spending beneficiaries themselves. A cohort that has traded as a single thematic will increasingly be evaluated on fundamentals. Some—the picks-and-shovels names with recurring infrastructure-like revenues—have solid earnings visibility. Others are exposed to vendor displacement or a deceleration in hyperscaler capex. That divergence will eventually appear in stock performance.
This informed the Fund’s increase in the Broadcom long while reducing more speculative AI infrastructure plays, as well as maintaining positions in software names like Microsoft and Datadog that benefit as enterprises shift from building AI infrastructure to deploying AI applications. The dividing line between infrastructure and application will define technology returns in the second half of the decade.
The most underappreciated risk in the AI ecosystem is OpenAI itself. At an implied valuation near $850 billion, the company must deliver multiple years of triple-digit revenue growth to appear reasonably priced. Competitive pressure from Anthropic in the enterprise market adds a daunting wrinkle. None of this derails the broader AI thesis, but it is a sentiment risk given the many large players with exposure here (Microsoft, Amazon, Oracle and NVIDIA).
Oracle’s Q1 volatility was a direct expression of this OpenAI risk, and Microsoft’s selloff also reflected concern about its partner’s financial trajectory. The divergence between infrastructure and application will come into sharper focus through the remainder of 2026. And as the organizing theme for so much of US outperformance, these developments require vigilance.
Technology including mega-caps was the largest detractor with total exposure averaging 18.3% and detracting 391 basis points. Exposure increased from 12.2% to 20.2% during the quarter as we added across semiconductors and software on weakness. For much of the quarter, investors pressed the long-semiconductor, short-software trade with each release of new AI functionality.
Anthropic has rapidly moved from a distant third player to a leading enterprise AI partner and the most prominent enabler of software functionality replicated by AI. Its annualized revenue rate more than tripled from $9 billion at the end of December to $30 billion in early April. This acceleration has reshaped the positioning dynamics across the entire technology complex.
Semiconductors detracted 60 basis points and exposure was increased from 1.5% to 5.9%. Broadcom was increased from 1.5% to 4.2% on weakness given its leadership in custom AI chips and partnerships with major hyperscalers, notably Alphabet. (GOOGL) Infineon Technologies was initiated as a new 2.2% long and detracted 32 basis points; the position reflects our thesis that European semiconductor companies offer attractive exposure to electrification and industrial automation at more reasonable valuations.
SECTOR LONG SHORT TOTAL Index Hedges 36 265 301 Industrials 63 0 63 Materials 26 0 26 Information Technology -357 -34 -391 Energy 16 0 16 Health Care -91 0 -91 Consumer Discretionary -97 5 -92 Financials -84 3 -81 Communication Services -91 0 -91 Total -580 239 -341 Past performance is no guarantee of future results.
Intel was traded (and then closed) on the short side and contributed 21 basis points on a 20% decline as the company continued to struggle with its foundry ambitions. Government support and an array of large partners have raised hope for a resurgence, but that is likely to play out over years. Analog Devices was traded tactically and contributed modestly. Microchip Technology was traded on the short side with negligible impact.
Software exposure was increased on weakness to 7.5% and detracted 135 basis points—the worst-performing sub-sector. The pullback accelerated as rising interest rates and fears of AI disruption weighed on multiples across the group. Three incremental longs additions—Intuit, HubSpot, and Synopsys—represented an attempt to identify those better positioned to withstand the AI disruption threat. Q1 revealed it is too early to prove that case as investors sold indiscriminately.
Intuit's position was increased from 1.0% to 2.8% and detracted 45 basis points on a 35% decline as investors grew concerned about AI disruption to its core tax franchise. While tax may be at risk, we see less threat to QuickBooks—60% of sales with an entrenched small-business user base and demonstrated pricing power. HubSpot was traded tactically and detracted 39 basis points on a 39% decline. Synopsys was maintained near 2.2% and detracted 37 basis points.
Communication Services detracted 91 basis points and was reduced from 5.4% to 3.0%. The Fund exited Pinterest and rotated from Netflix to Spotify. Pinterest lacks the scale to compete against Meta and Alphabet, and suffers from a user base that engages only occasionally. The position was sold after the January 27 layoff announcement foreshadowed growth and margin degradation in its February earnings release, thus avoiding a subsequent 40% loss.
Reddit detracted 28 basis points on a 41% decline and was modestly increased to 1.0%. In contrast to Pinterest, Reddit retains headroom for further monetization, and its user base is growing at double-digit rates. Spotify was increased to 2.0% and detracted 16 basis points; we expect its own suite of AI-enabled features later this year.
Industrials remain the Fund's largest sector allocation, with exposure reduced from 45.3% to 39.9% during the quarter. The sector contributed 63 basis points led by strength in defense names L3Harris and BAE Systems alongside industrial product vendors Johnson Controls and Regal Rexnord. The large industrials exposure reflects our thesis that the US capex cycle, reindustrialization and global rearmament represent structural, multi-year tailwinds.
L3Harris was the top stock contributor at 69 basis points, benefiting from rising defense budget proposals, strong backlog growth and the outbreak of the Iran war. The position was reduced from 4.4% to 3.3% following an 18% gain. BAE Systems contributed 61 basis points on a 28% advance driven by continued momentum in European defense spending; the position was trimmed from 2.3% to 1.5%.
Boeing detracted 31 basis points on an 8% decline amid the war and broader macro concerns weighing on the aerospace supply chain. Regal Rexnord contributed 38 basis points as industrial automation demand exceeded expectations and was increased from 1.1% to 2.3%. Johnson Controls contributed 26 basis points, continuing to benefit from commercial HVAC upgrades and data center construction. Emerson Electric and Schneider Electric detracted modestly.
3M detracted 30 basis points on a 9% decline; we added on weakness given the improving operational trajectory and defensive characteristics. Ferguson Enterprises was initiated at 1.0% and contributed moderately, positioned to benefit from a pickup in US construction activity. Flowserve, an indirect energy play, was initiated at 1.2% and detracted moderately. Carrier Global contributed 10 basis points.
The professional and IT services exposure was reduced from 9.1% to 6.3% and was neutral to performance. CACI International contributed 27 basis points and was reduced from 2.7% to 1.2% near highs. Waste Management was closed and contributed modestly. Booz Allen detracted modestly as government spending was disrupted by the shutdown. Jacobs Solutions detracted 13 basis points as fears of AI disruption broadened to engineering services—we see more opportunity for efficiency gains than risk to the business model.
United Airlines was the largest detractor at 70 basis points as the oil shock put airline earnings at risk despite the structural resilience that has emerged for the US legacy players. Lufthansa detracted 27 basis points; Southwest Airlines was neutral. In transports, Union Pacific contributed 21 basis points and Canadian Pacific Kansas City contributed 20 basis points as rail consolidation prospects remained supportive. Uber was closed (switched to DoorDash) and detracted modestly.
Financials exposure was maintained near 8.0%, detracting 81 basis points. Wells Fargo detracted 61 basis points on a 15% decline as the stock reversed some of its 2025 gains; the position was maintained as we view the valuation discount to peers as unwarranted. Morgan Stanley detracted 16 basis points, mirroring the broader decline despite robust trading and banking activity.
Citigroup was initiated with a new 1.1% long position and detracted modestly, reflecting our view that its ongoing transformation is underappreciated and the valuation gap to peers narrows further. Capital One was closed and detracted modestly, while the American Express short was closed on the March pullback. Toast was initiated as a new long. Deutsche Bank was traded tactically and contributed modestly.
Banks could be among the most direct beneficiaries of an imminent rate-cutting cycle, generating volume growth in lending precisely as the competitive pressure from private credit begins to ease. Regional banks have been squeezed between elevated funding costs and the encroachment of private markets into their core corporate lending franchise. The setup is improved if oil prices retreat, releasing consumer purchasing power.
Health Care exposure was reduced from 8.1% to 5.2% and detracted 91 basis points. The main culprit was ICON PLC, which detracted 75 basis points on a 39% decline. We owned it as a cheap business poised to benefit from improved (and AI-supported) biotech funding, but the February 12 disclosure of accounting irregularities led to a 40% single-day decline. The stock was subsequently sold.
Merck was maintained near 1.9% and contributed 11 basis points. Medtronic was increased to 1.5% and detracted modestly. Halozyme was maintained near 1.7% and detracted modestly. Thermo Fisher detracted 12 basis points and Pfizer contributed modestly before both were closed.
Consumer Discretionary including mega-caps (Amazon long and Tesla short) averaged 12.4% exposure and detracted 92 basis points. DoorDash was initiated as a new 2.8% long and detracted 24 basis points as higher fuel prices forced delivery platforms to subsidize drivers, temporarily capping earnings. Despite the weak start, we see long-term value in its logistics platform and are skeptical that it should be included in the AI losers' basket.
Marriott contributed 10 basis points on a 5% advance. D.R. Horton was maintained near 2.9% and detracted 9 basis points; Lowe's contributed modestly and was sold given other opportunities created by the sell-off; Sherwin-Williams detracted modestly. The preceding represent our conviction in an eventual housing recovery, but the trade was put on hold by the oil-induced rise in Treasury yields in March.
Consumer discretionary offers a tactical opportunity that is worth capturing but not overstaying. De-escalation in Iran, combined with Fed rate cuts and declining fuel prices, would provide a meaningful near-term boost to sentiment and spending. The trade works through the autumn midterms especially if mortgage rate relief materializes.
Materials exposure averaged 4.8%, contributing 26 basis points in the quarter. Freeport-McMoRan contributed 24 basis points on a 16% advance as copper prices rallied on data center and electrification demand. Linde was closed and contributed modestly. In hindsight, the big call in the quarter was energy, and the Fund did not capture this to any material degree.
Energy exposure increased from zero to 1.6%, contributing 16 basis points. Baker Hughes was initiated as a new 1.6% long and contributed 15 basis points on a 34% gain, benefiting from strong demand for LNG equipment and energy infrastructure servicing. Chevron was traded tactically and contributed modestly. The sector has benefited from events, but we are skeptical of the durability of that move.
Commodities are a natural winner of today's multi-faced reflation policies and—despite the correction in March along with other cyclicals—momentum will return to these names. The Fund's preference is copper due to the physical scarcity of supply. In this context, the problem with oil is that it is abundantly supplied and today's Strait crisis will eventually exacerbate this.
International positions represented 13.9% of average net long exposure across 11 positions and detracted an aggregate of 122 basis points, with exposure ending the quarter near 12.2%. Positioning remains concentrated in sectors with structural tailwinds—defense, electrification, and select infrastructure—rather than broad geographic diversification. Selectivity is the correct framework because most non-US economies are in a precarious position.
Rotation into cheaper assets beyond the US only works in a benign American reflationary environment. With US reflation approaching its limits by autumn, we exercise caution when adding international exposure and focus on names with idiosyncratic drivers that are less correlated with global beta. There are few "local" reasons to buy non-US equities. For example, there are no European reasons to buy European equities – all is a derivative of the US reflation impulse.
The Iran conflict has been especially revealing—demonstrating the foundational strengths of America's financial supremacy of the last 10–15 years based on three pillars: technological leadership, corporate profitability and strategic autonomy. These are qualities so many other regions lack. The "out of America" trade that was fashionable has collapsed and shown to be a late-cycle momentum trade.
NAME SYMBOL CONTRIBUTION % OF FUND NAV FIRM PROFILE L3 Harris Technologies Inc. (LHX) LHX 0.69% 3.6% long as of 03/31/26 US Defense BAE Systems PLC BA/LN 0.61% 2.4% long as of 03/31/26 US Defense Regal Rexnord Corp. RRX 0.38% 1.5% long as of 03/31/26 US Industrials CACI International Inc. CACI 0.27% 1.6% long as of 03/31/26 US IT Services Johnson Controls Intl PLC (JCI) JCI 0.26% 2.2% long as of 03/31/26 US Industrials
L3Harris is a large US defense prime providing mission-critical technologies across space, airborne, and land domains, with strengths in communications, electronic warfare, and missile propulsion systems following its July 2023 acquisition of Aerojet Rocketdyne. The stock rallied in early January after President Trump indicated he would ask Congress for a $1.5 trillion defense budget in 2027—a 50% increase over fiscal 2026. While we have not assumed an increase of that magnitude, even a more modest 10%–20% increase should drive meaningful upside to revenue and earnings estimates over the next few years.
The Aerojet acquisition continues to validate both financially and strategically. In mid-January, L3Harris announced a direct partnership with the Department of Defense to expand capacity for solid rocket motors that power vital US and allied missiles. The DoD will invest $1 billion in L3Harris' Missile Solutions business through a convertible preferred security, which would convert into common equity upon an expected IPO in the second half of 2026. We view LHX's majority ownership in this higher-growth business as additional upside given the premium multiples at which faster-growing defense technology names trade. We see nearly 20% upside to $410 based on 24x our 2027 EPS estimate, equivalent to a 4.2% free cash flow yield.
BAE Systems is one of the world's largest defense contractors, with approximately 45% of revenue derived from US defense spending and significant exposure to European rearmament. The stock rose 26% in the first quarter, validating our conviction through the Q4 pullback, which reflected sector rotation and Ukraine peace negotiation headlines rather than fundamental deterioration. The Q1 rally was driven by the Trump Administration's signaling of a potential $1.5 trillion defense budget—a powerful tailwind for names with meaningful US exposure—and BAE's own strong 2025 results. Notably, the conflict in Iran has not acted as a further catalyst for the group despite positive longer-term implications for critical munitions restocking and Middle East allied defense needs.
BAE has been among the best-performing US and European defense names year-to-date, and we remain constructive. The thesis is unchanged: strong cash conversion, long-cycle contract visibility, and positioning at the center of both European defense re-industrialization and an upward US budget bias under the current administration. We see 15% upside to 2500p based on a 3.3% free cash flow yield on our 2027 estimates.
Regal Rexnord is a diversified powertrain solutions manufacturer, transformed through a series of divestitures and acquisitions from a consumer-centric motor company into a higher-quality industrial business. The stock rose 33% in the first quarter, outperforming on multiple catalysts. Shares initially rallied in January on the ISM recovery and market broadening trade, then extended its gains following Q4 earnings when management disclosed substantial data center orders tied to E-Pod—an integrated power solution leveraging the company’s existing product portfolio. Earnings power came in well ahead of expectations, and the stock began to rerate accordingly, absorbing a meaningful macro-related pullback along the way.
We continue to like RRX given its fit with our thesis around domestic reshoring and a manufacturing revival. Over 60% of revenues are generated in the US, and the stock entered the year at an attractive low-teens P/E despite no meaningful top-line growth in recent years due to depressed manufacturing end markets. The data center opportunity offers a new growth vector, and we believe there is still significant upside. We see 40% upside to $264 based on 20x our 2027 EPS estimate.
CACI is a defense and national security contractor with growing exposure to hardware solutions in high-priority mission areas including counter-UAS, space, electronic warfare, and enterprise technology. The company is frequently grouped with government services peers, but management deliberately repositioned the portfolio away from civil agencies years ago, and CACI increasingly resembles a defense prime. The stock rallied more than 100% from its first-quarter 2025 trough through early January. At the lows, shares had declined nearly 45% on fears of DOGE-driven contract cancellations and broad government spending cuts. What distinguished CACI was that management continued raising estimates throughout that period and has done so since, demonstrating minimal real exposure to the cuts weighing on the group.
We continue to like CACI for its positioning in some of the fastest-growing areas within the defense budget. This exposure has driven consistent outgrowth relative to both government services peers and traditional defense primes, and the revenue mix continues shifting toward higher-growth hardware markets. We see more than 25% upside to $700 based on 20x our 2027 EPS estimate, implying a 5.2% free cash flow yield.
Johnson Controls is an idiosyncratic turnaround story under new CEO Joakim Weidemanis, who joined the company following a successful track record at Danaher and has moved quickly to reshape the portfolio, address sector-low margins, and accelerate organic growth. The stock rose 9% in the first quarter, despite a 9% pullback in March as the Iran Conflict weighed on industrials broadly. In February, JCI raised guidance and reported blockbuster order growth of 40% year-over-year, beating expectations of mid-single-digit growth. The order strength was not limited to data centers — life sciences was also a meaningful driver, as the rise of biologics-based therapies requires materially different manufacturing environments with more demanding thermal management needs.
We continue to like JCI for its combination of self-help margin improvement and exposure to secular growth in building systems modernization. We believe orders can continue to surprise to the upside, guidance will be revised higher again, and additional portfolio actions are likely. We see greater than 65% upside to $168 based on rolling the current 28x P/E multiple forward to our 2027 upside EPS estimate.
NAME SYMBOL CONTRIBUTION % OF FUND NAV FIRM PROFILE Microsoft Corp. MSFT -1.00% 3.8% long as of 03/31/26 US Software ICON PLC ICLR -0.75% Closed - 0.8% average long in Q1 US Health Care United Airlines Holdings Inc. UAL -0.70% 3.7% long as of 03/31/26 US Airlines Wells Fargo & Co. (WFC) WFC -0.61% 3.7% long as of 03/31/26 US Banks Amazon.Com Inc. AMZN -0.55% 5.0% long as of 03/31/26 US E-Commerce
Microsoft Corp. is the world's largest software company and a leading cloud infrastructure provider, with AI exposure through its OpenAI partnership and integration of Copilot capabilities across its product portfolio. The stock declined 23% in the first quarter compared with a 5% decline for the S&P 500. Nearly all of the underperformance was concentrated around the fiscal Q2 earnings report, where Azure revenue growth of roughly 40% — impressive in absolute terms — came in below buyside expectations, while capital expenditures surprised to the upside. Management attributed the Azure shortfall to a deliberate reallocation of compute capacity away from external client workloads to internal product needs including Copilot. This explanation did little to reassure investors already skeptical about the return profile of AI-related capital spending, a concern that had been building throughout the second half of 2025 and weighed on hyperscalers broadly. Microsoft was also not immune to the broader sell-off in software names in Q1 despite being the highest-quality and most defensive member of the group.
We added to our position on the weakness. Microsoft confronted a strikingly similar dynamic a decade ago when Azure was in its early stages — investors struggled with the inherent timing mismatch between capital investment, revenue recognition, margin expansion, and cash flow generation. What followed was ten years of consistent stock outperformance as secular demand for cloud computing proved the skeptics wrong. We believe generative AI represents the next iteration of this cycle: a compute-intensive technology that structurally favors the existing hyperscalers
given their scale advantages and data gravity. Early signs suggest sentiment may already be turning — supply chain contacts continue to report compute shortages, and spot pricing for GPUs has risen 48% over the past two months. At 22x NTM GAAP EPS, Microsoft is attractively valued relative to its growth profile, and we see upside to $450 based on 28x our 2027 EPS estimate as investors return the hyperscalers to the AI winner's circle.
ICON PLC is a contract research organization providing late-stage clinical trial services to pharmaceutical and biotech companies that outsource these functions. The stock had been out of favor heading into the quarter amid cuts to government funding for academic research, a broader slowdown in biotech funding, and the realignment of major R&D programs at key customers including Pfizer and Bristol Myers. Topline growth had decelerated from 5% in 2023 to 2% in 2024 and an estimated 3% decline in 2025, causing the stock to derate from 18x to 10x forward earnings. The Fund initiated a modest 1.6% position late last year on the view that growth was set to recover in 2026 as the funding environment improved with greater regulatory clarity.
In early February, management delayed the Q4 2025 earnings release, withdrew guidance, and disclosed an investigation into past revenue recognition practices, triggering a 40% single-day decline. Without reliable financials and no reassurance on the scope of the issue, the Fund prioritized risk management over a potential recovery and exited the position entirely.
United Airlines operates a global hub-and-spoke network with an estimated 40%+ of passenger revenue derived from premium products. Structural changes to both labor supply and aircraft capacity emerging from the pandemic have fundamentally improved the competitive landscape for network carriers, delivering better-than-expected pricing power and returns on invested capital. Following a 135% surge in 2024 and a 15% rise in 2025, UAL shares pulled back 18% in the first quarter. A strong start to the year was disrupted by a sharp increase in jet fuel prices following the outbreak of the Iran Conflict on February 27. By mid-March, management noted that the first ten weeks of 2026 represented the ten largest booking weeks in company history, with booked yields in the most recent week up 15–20% and double-digit RASM growth expected in Q2.
We continue to like UAL given the industry's quick and disciplined response to offset higher fuel costs. We believe the conflict further strengthens UAL's relative competitive position, accelerates industry pricing discipline, and should drive incremental upside to revenues, EPS, and free cash flow as the impact is absorbed. The stock's resilience to external shocks is a dynamic we believe should ultimately support multiple expansion. We see >80% upside to $130 based on 9x our 2027 EPS estimate, which we view as potentially conservative.
Wells Fargo is one of the largest US banks, with leading positions in consumer and commercial banking. The Fed's strict balance sheet limits proved a silver lining in recent years, allowing management to high-grade the loan book and focus on cost efficiencies while peers pursued riskier growth strategies. Despite the removal of the asset cap in June 2025 and a favorable regulatory posture under the current administration, the stock has lagged peers including JPMorgan and Citigroup. Wells Fargo used to trade at a 50%+ premium to JPMorgan on price-to-book and now trades at a 35% discount. The stock declined 15% in the first quarter, underperforming most large bank peers, which were down 5%–10%, as its shift toward growing the balance sheet was offset by weakening net interest margins and a disappointing net interest income outlook.
We have preferred WFC as one of the more defensive large banks, but will revisit that thesis if rivals like Citigroup continue to execute better on loan growth and cost reductions. We continue to expect large banks to outperform smaller regional peers in 2026 as challenges from stablecoins, AI, and rising funding costs make size and scale increasingly important.
Amazon is the largest online retailer, third-party retail services platform, and cloud service provider globally. The stock declined 10% in the first quarter compared with a 5% decline for the S&P 500. The underperformance stemmed from a Q4 earnings report where an increased 2026 capex guide of $200B (versus buyside expectations of $170B) overshadowed AWS growth of 24% (the fastest in 13 quarters) and a record backlog of $244B. The market has never seen a $200B capex cycle and reacted with skepticism on whether returns would materialize, pushing the stock down 10% on the print alone.
We added to our position on weakness. CEO Andy Jassy addressed the concern directly in his annual shareholder letter in April, stating Amazon is "not investing $200B in capex on a hunch" and that customer commitments already cover a substantial portion of 2026 spend. Anthropic and OpenAI together represent ~15% of AWS revenue, and both are scaling rapidly. Anthropic's revenue run rate rose over 3x in Q1 alone with AWS as its primary infrastructure partner. We expect AWS to grow 30%+ in Q1 versus consensus at 25% and see further acceleration potential as capacity ramps. Management expects that AWS margins will remain above 30% despite the depreciation ramp. Meanwhile, Retail and Advertising are both accelerating sales growth and achieving record margins. At 20x our 2027 EPS estimate versus a 30x multiple historically, the stock is too cheap for a business growing EPS 20%–30%.
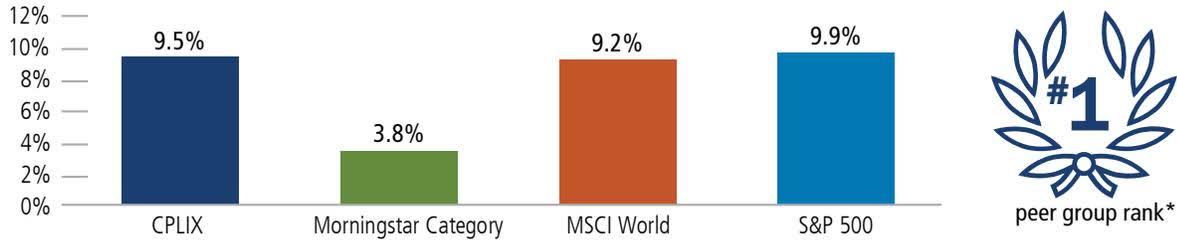
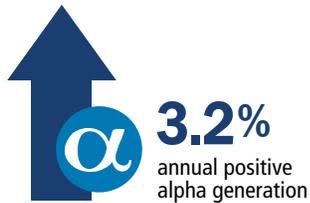
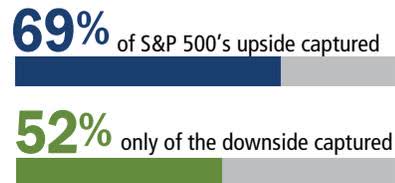
Calamos Phineus Long/Short Fund (CPLIX) About the Author Michael Grant, Co-CIO, Head of Long/Short Strategies, and Senior Co-Portfolio Manager Michael Grant manages investment team members and leads the portfolio management team responsible for our Long/Short strategies. He is also a member of the Calamos Investment Committee, which is charged with providing a top-down framework, maintaining oversight of risk and performance metrics, and evaluating investment processes. He joined Calamos in 2015 and has more than 35 years of investment industry experience. Prior to joining Calamos, Michael founded Phineus Partners in 2002, where he launched the Phineus long/short strategy. Previously, he was a Managing Director of Schroder Investment Management with responsibilities over US equity mandates. During his tenure at Schroders, he also served as Head of the Global Technology Team and Head of the US Equity Team in London. Prior to that, Michael was a portfolio manager for the National Investment Trust Co. in Taipei, Taiwan and a US equity analyst for the Principal Group in Canada. Michael earned a master's degree from the London School of Economics, where he specialized in International History. He has Bachelor of Commerce from the University of Alberta, Canada. Phineus Long/Short Fund Has Delivered What an Alternative Should2002 through 3/31/26 Past performance is no guarantee of future results. Source: Morningstar. Inception as of 5/1/2002. Data as of 3/31/26. Past performance is no guarantee of future results. Sources: Calamos and Morningstar. Fund inception date is 5/1/2002. Data as of 3/31/26. All data shown for the since inception period. *1 of 8 funds. For the period ending 3/31/26, the fund ranked 65 of 94 funds; 65 of 85 funds, 63 of 82 funds, and 43 of 67 funds for the one-year, three-year, five-year, and ten-year periods, respectively. Portfolios are managed according to their respective strategies which may differ significantly in terms of security holdings, industry weightings, and asset allocation from those of the benchmark(s). Portfolio performance, characteristics and volatility may differ from the benchmark(s) shown. Upside downside capture versus S&P 500 Index. Average net exposure is on a cash basis, not delta adjusted basis. Net equity exposure is on cash basis, not delta-adjusted basis. Largest Positions (cash Basis), Long and Short as of 3/31/26 (% of net Assets) Holdings and weightings are subject to change daily. Holdings are provided for informational purposes only and should not be deemed as a recommendation to buy or sell the securities mentioned. Exposures for Holdings Not Included in Largest Positions as of 3/31/26 (% of net Assets) Analog Devices Inc., Sold; BAE Systems PLC, 1.6%; Baker Hughes Co., 1.6%; Boeing Co. (BA), 2.6%; Booz Allen Hamilton Holding Corp., 3.2%; CACI International Inc., 1.5%; Canadian Pacific Kansas City Ltd., 0.1%; Carrier Global, Sold; Chevron Corp., Sold; Citigroup Inc., 1.1%; D.R. Horton Inc., 2.9%; Datadog Inc., 1.6%; Deutsche Bank AG, Sold; DoorDash Inc., 2.5%; Emerson Electric Co., 2.4%; Ferguson Enterprises Inc., 1.0%; Flowserve Corp., 1.2%; Freeport-McMoRan Inc., 2.7%; Halozyme Therapeutics Inc., 1.8%; HubSpot Inc., Sold; ICON PLC, Sold; Infineon Technologies AG, 2.3%; Intel Corp., Closed; Intuit Inc., 2.8%; Jacobs Solutions Inc., 1.9%; Johnson Controls International PLC, 2.0%; Linde PLC, Closed; Lowe's Companies Inc., 2.1%; L3Harris Technologies Inc., 3.3%; Lufthansa Cargo AG, 1.9%; Marriott International Inc., 2.0%; Medtronic PLC, 1.5%; Merck & Co. Inc., 0.2%; Microchip Technology Inc., Closed; Morgan Stanley, 3.4%; Netflix Inc., Sold; Oracle Corp., 1.0%; Pfizer Inc., Closed; Pinterest Inc., Sold; Reddit Inc., 1.0%; Regal Rexnord Corp., 2.3%; Schneider Electric SE, 2.2%; Sherwin-Williams Co., 2.5%; Southwest Airlines Co., 1.3%; Spotify Technology SA, 2.0%; Synopsys Inc., 2.2%; Tesla Inc., Closed; Thermo Fisher Scientific Inc., Closed; Toast Inc., >0.1%; Uber Technologies Inc., Closed; Union Pacific Corp., 1.7%; United Airlines Holdings Inc., 3.1%; Wells Fargo & Co., 3.3%. Average Annual Total Return as of 3/31/26 Performance data quoted represents past performance, which is no guarantee of future results. Current performance may be lower or higher than the performance quoted. Please refer to Important Risk Information. The principal value and return of an investment will fluctuate so that your shares, when redeemed, may be worth more or less than their original cost. You can obtain performance data current to the most recent month end by visiting Investment Funds, Equities, & Strategies. The Fund's gross expense ratios as of the prospectus dated 2/27/2026 are as follows: A Shares 2.30%, C Shares 3.05% and I Shares 2.05%. The total expense ratio is inclusive of the 1.23% management fee; dividend and interest expense on short sales (Class A: 0.74%, Class C: 0.74%, Class I: 0.74%); 12b-1 fees (Class A: 0.25%, Class C: 1.00%); and other expenses (Class A: 0.16%, Class C: 0.16%, Class I: 0.16%). The Adjusted Expense Ratio, which reflects the total expense ratio excluding the dividend and interest expense on short sales, is as follows: : Class A: 1.65%, Class C: 2.40% and Class I: 1.40%. "Dividend and Interest Expense on Short Sales" reflect interest expense and dividends paid on borrowed securities. Interest expenses result from the Fund's use of prime brokerage arrangements to execute short sales. Dividends paid on borrowed securities are an expense of short sales. Such expenses are required to be treated as a Fund expense for accounting purposes and are not payable to Calamos Advisors LLC. Any interest expense amount or dividends paid on securities sold short will vary based on the Fund's use of those investments as an investment strategy best suited to seek the objective of the Fund. The performance shown for periods prior to 4/6/16 is the performance of a predecessor investment vehicle (the “Predecessor Fund”). The Predecessor Fund was reorganized into the Fund on 4/6/16, the date upon which the Fund commenced operations. On 10/1/15 the parent company of Calamos Advisors, purchased Phineus Partners LP, the prior investment adviser to the Predecessor Fund (“Phineus”), and Calamos Advisors served as the Predecessor Fund’s investment adviser between 10/1/15 until it was reorganized into the Fund. Phineus and Calamos Advisors managed the Predecessor Fund using investment policies, objectives, guidelines and restrictions that were in all material respects equivalent to those of the Fund. Phineus and Calamos Advisors managed the Predecessor Fund in this manner either directly or indirectly by investing all the Predecessor Fund’s assets in a master fund structure. The Predecessor Fund performance information has been adjusted to reflect Class A and I shares expenses. However, the Predecessor Fund was not a registered mutual fund and, thus, was not subject to the same investment and tax restrictions as the Fund. If it had been, the Predecessor Fund’s performance may have been lower. Index Definitions: The S&P 500 Index is considered generally representative of the US large cap stock market and is capitalization weighted. The MSCI World Index is a free float-adjusted market capitalization weighted index that is designed to measure the equity market performance of developed markets. The MSCI World ex USA Index captures large and mid cap representation across 22 of 23 Developed Markets (DM) countries excluding the United States. The Bloomberg US Aggregate Bond Index is a broad-based flagship benchmark that measures the investment grade, US dollar-denominated, fixed-rate taxable bond market. The index includes Treasuries, government related and corporate securities, MBS (agency fixed-rate and hybrid ARM pass-throughs), ABS and CMBS (agency and non-agency). The MSCI ACWI ex USA Index represents performance of large and mid cap stocks across developed and emerging markets excluding the United States. The Nasdaq Composite measures the performance of companies on the Nasdaq, technology and growth companies are well represented. The Russell 2000 Index is a measure of small cap US equity performance. The MSCI Emerging Markets Index is a measure of emerging market equity performance. The MSCI Europe Index is a measure of European developed market equity performance. Non-US single country equity markets are represented by the indexes listed parenthetically. The STOXX Global 1800 Index is the combination of three regional benchmark indices (STOXX Europe 600 Index, STOXX North America 600 Index and STOXX Asia/Pacific 600 Index). Morningstar Long-Short Equity Category funds hold sizeable stakes in both long and short positions in equities, exchange traded funds, and related derivatives. Unmanaged index returns assume reinvestment of any and all distributions and, unlike fund returns, do not reflect fees, expenses or sales charges. Investors cannot invest directly in an index. Compound annual growth rate (CAGR) is a metric that measures the average annual rate of return or growth over multiple time periods, assuming the growth compounds each year. Delta-adjusted basis exposure is calculated by Calamos Advisors LLC and is specific only to a point in time since a security’s delta changes continuously with market activity. EBITDA stands for earnings before interest, taxes, depreciation, and amortization; it reflects a firm’s short-term operational efficiency and determines operating profitability. EV/EBITDA ratio compares the value of a company, including debt, to the company’s cash earnings less non-cash expenses. EV/EBITDAR ratio is similar to EV/EBITDA but adds back rent expense. Free cash flow per share indicates how much cash a company generates per share after accounting for operating costs and investments. Gross exposure refers to the sum of the absolute value of a fund’s long positions and short positions. Growth at a Reasonable Price (GARP) investors look for companies showing consistent earnings growth above broad market levels while excluding companies with very high valuations. Net exposure is the difference between a fund’s long positions and its short positions. When the portfolio management team evaluates the fund’s exposures and related risks, they include calculations based on a delta-adjusted basis, which measures the price sensitivity of an option or portfolio to changes in the price of an underlying security. Price/earnings ((P/E)) ratio is the current stock price over trailing 12-month earnings per share. Price/sales ratio is a stock’s capitalization divided by its sales over the trailing 12 months. Sortino ratio is an excess return over the risk-free rate divided by the downside semi-variance, and so it measures the return to “bad” volatility. (Volatility caused by negative returns is considered bad or undesirable by an investor, while volatility caused by positive returns is good or acceptable.) Source for stock performance: Bloomberg. Before investing carefully consider the Fund’s investment objectives, risks, charges and expenses. Please see the prospectus and summary prospectus containing this and other information which can be obtained by calling 1-866-363-9219. Read it carefully before investing. Important Risk Information. An investment in the Fund is subject to risks, and you could lose money on your investment in the Fund. There can be no assurance that the Fund will achieve its investment objective. Your investment in the Fund is not a deposit in a bank and is not insured or guaranteed by the Federal Deposit Insurance Corporation (FDIC) or any other government agency. The risks associated with an investment in the Fund can increase during times of significant market volatility. The Fund also has specific principal risks, which are described below. More detailed information regarding these risks can be found in the Fund’s prospectus. The principal risks of investing in the Calamos Phineus Long/Short Fund include: equity securities risk consisting of market prices declining in general, short sale risk consisting of the potential for unlimited losses, leverage risk, and foreign securities risk. As a result of political or economic instability in foreign countries, there can be special risks associated with investing in foreign securities, including fluctuations in currency exchange rates, increased price volatility and difficulty obtaining information. In addition, emerging markets may present additional risk due to the potential for greater economic and political instability in less-developed countries. Alternative investments may not be suitable for all investors. The Fund takes long positions in companies that are expected to outperform the equity markets, while taking short positions in companies that are expected to underperform the equity markets and for hedging purposes. The Fund may lose money should the securities the Fund is long decline in value or if the securities the Fund has shorted increase in value, but the ultimate goal is to realize returns in both rising and falling equity markets while providing a degree of insulation from increased market volatility. This material is distributed for informational purposes only. The information contained herein is based on internal research derived from various sources and does not purport to be statements of all material facts relating to the information mentioned and, while not guaranteed as to the accuracy or completeness, has been obtained from sources we believe to be reliable. The portfolio is actively managed. Holdings, sector weightings, net exposures and geographic weightings subject to change daily. CALAMOS®TODAY FOR TOMORROW Calamos Financial Services LLC, Distributor2020 Calamos Court | Naperville, IL 60563-2787866.363.9219 | Investment Funds, Equities, & Strategies | caminfo@calamos.com ©2026 Calamos Investments LLC. All Rights Reserved.Calamos® and Calamos Investments® are registered trademarks of Calamos Investments LLC.
Amazon.com, Inc. Long 5.1% Broadcom, Inc. Long 4.2% Microsoft Corp. Long 4.1% 3M Company Long 4.0% NVIDIA Corp. (NVDA) Long 3.9% State Street SPDR S&P 500 ETF Trust Short -42.1% Invesco QQQ Trust Series 1 Short -32.8% Ciena Corp. Short -0.8% Coherent Corp. Short -0.8% Invesco QQQ Trust Series 1 Short -0.2%
Q1 2026 1 YEAR 3 YEAR 5 YEAR 10 YEAR SINCE INCEPTION(5/1/2002) CPLIX -3.56% 5.00% 6.84% 3.37% 6.79% 9.52%
Editor's Note: The summary bullets for this article were chosen by Seeking Alpha editors.
Editor's Note: This article covers one or more microcap stocks. Please be aware of the risks associated with these stocks.
此内容由惯性聚合(RSS阅读器)自动聚合整理,仅供阅读参考。 原文来自 — 版权归原作者所有。