





mohd izzuan/iStock via Getty Images
US equity markets broadened in the first quarter of 2026 as investors shifted from mega-cap technology stocks toward a wider cast of winners.
This fundamental trend met a sudden intermission in March as conflict in Iran triggered a rotation into speculative names and commodity linked-industries. This backdrop mirrored the 2022 disruption which initially favored near-term narratives over fundamentals, creating a temporary headwind for quality-oriented portfolios.
Our Large Cap and Income Equity strategies successfully navigated the tech sell-off, while our Down Cap & International strategies trailed due largely to a structural underweight to Energy.
We view this period as a brief pause in a multi-year broadening cycle rather than a permanent change in the script. We continue to prioritize high-quality companies with the pricing power and financial flexibility required to deliver long-term compounding regardless of geopolitical plot twists.
Every compelling story has an intermission. The broadening that began in late 2025 carried encouraging signs into the first quarter of 2026 as leadership widened beyond a small cast of mega-cap technology companies. Then, the house lights came up in March. The conflict in Iran served as the intermission nobody expected and few wanted. The net effect of these cross currents resulted in 4.3% decline for the S&P 500—its worst quarterly return since 2022.
Broad Market Performance Q1 Russell 3000 -4.0%
For several years, the Magnificent 7 stocks effectively owned the stage, but the spotlight began to shift in late 2025. The Magnificent 7 group declined roughly 11% on a weighted average basis in Q1, more than 2x worse than the S&P 500's total return. Beyond these mega-caps, software companies saw their valuations compress as investors worried that rapid advancements in Artificial Intelligence might erode the moats of established firms. This retreat by large cap growth stocks allowed a much larger cast of winners to emerge.
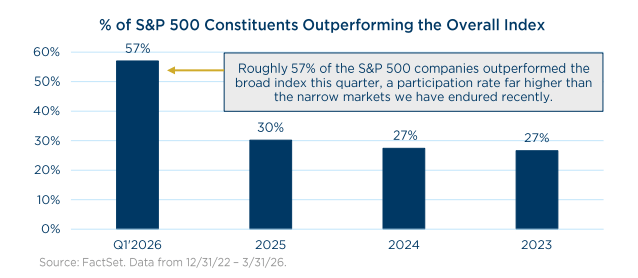
Broadening also occurred down the market cap spectrum. The S&P 500 Equal Weight index outperformed the market-cap weighted S&P 500 by 5%, a feat only achieved a handful of times over the last two decades, including early 2020/2021 and mid/late 2009. In addition, down cap indexes like the Russell Midcap, Russell 2500 and Russell 2000 all eked out modest positive returns for the quarter.
Then, in March, the broadening performance was interrupted by noise from overseas. As the conflict in Iran escalated, investors temporarily cared less about business fundamentals and more about near-term beneficiaries in energy, agriculture, and other hard-asset corners of the market. Early 2022 offered a similar lesson after Russia invaded Ukraine. In the initial aftermath, investors rushed into energy names. But beginning in Q2 2022, markets started pricing in a more dire economic situation while also refocusing on higher quality companies with greater resiliency and stronger balance sheets. We do not pretend to know the course of geopolitical events. We do know that markets often react first and think later.
Our relative results were mixed to start the year. Our Large Cap and Income Equity strategies thrived as the spotlight moved away from mega-cap tech. Both produced positive absolute returns, while the Core benchmarks were in negative territory, and Income Equity led the Russell 1000 Value index, exceeding expectations. Our Mid, SMID & Small Cap portfolios had a tougher quarter as speculation remained stubbornly alive and our structural underweight to Energy became a headwind. That underweight is not an accident. We prefer businesses with durable competitive advantages rather than those whose fate is tied to the price of a commodity. While this creates a headwind when energy shocks occur, we have seen this script before. In 2022, we struggled initially only to handily outperform later in the year as the market refocused on resiliency and balance sheets.
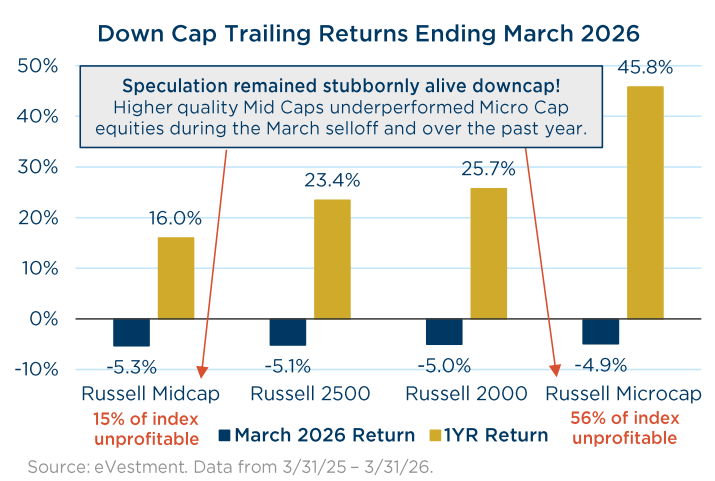
The first quarter was another reminder that markets can move in ways that overwhelm fundamentals in the short run. What had appeared to be healthy high-beta mean reversion in late 2025 was largely put on pause, particularly in March. Even as high beta modestly underperformed during the selloff, lower-quality, more speculative corners of the market proved surprisingly defensive. Consider that roughly 56% of Russell Microcap constituents were unprofitable over the trailing twelve months, yet the index held up better than the higher-quality Russell Mid Cap, where only about 15% were unprofitable. Further, over the last year, Microcaps also outpaced more traditional Small Caps by nearly 2x and Mid Caps by nearly 3x. History suggests that is more sideshow than steady state.
Finally, our International Equity strategy outperformed its benchmark during the March selloff but trailed for the full quarter. This was due in part to having no exposure to Energy or Utilities, the MSCI EAFE index's two best-performing sectors.
History suggests that intermissions are temporary, and we believe the broadening story hasn't reached its final act. Prior broadening episodes have been choppy but prolonged, often lasting years rather than quarters. History also tells us that geopolitics and supply shocks, while capable of leaving a mark in the near term, rarely alter the long-term fundamentals of advantaged businesses.
We do not attempt to forecast the direction of geopolitics or the broader economy. Instead, we focus on what we can control. We find comfort in companies with durable competitive advantages, strong returns on capital, and flexible balance sheets. These are the qualities that allow a business to navigate a wide range of economic scenarios. We believe this broadening story has paused—not ended—and fundamentals will eventually return to center stage.
As always, we appreciate and highly value the trust you have placed in us.
We believe this broadening story has paused—not ended—and fundamentals will eventually return to center stage.
Performance is preliminary and subject to change. Past performance is no guarantee of future results. This report is for informational purposes only. The statements contained herein are solely based upon the opinions of The London Company and the data available at the time of publication of this report, and there is no assurance that any predicted results will actually occur. Information was obtained from third-party sources which we believe to be reliable but are not guaranteed as to their accuracy or completeness. This report contains no recommendations to buy or sell any specific securities and should not be considered investment advice of any kind. An investment in a London Company strategy is subject to risks, including loss of principal. Referenced strategies may not be suitable for all investors. The appropriateness of a certain strategy will depend on individual circumstances and objectives. In making an investment decision, individuals should utilize other information sources and the advice of their investment advisor. All data references are as of March 31, 2026 unless noted otherwise.
The London Company of Virginia is a registered investment advisor. More information about the advisor, including its investment strategies, fees and objectives, are fully described in the firm's Form ADV Part 2, which is available by calling 804.775.0317, or can be found by visiting The London Company | Quality Value Asset Management .
Inclusion of these indices is for illustrative purposes only. Indices are not available for direct investment. Any investor who attempts to mimic the performance of an index would incur fees and expenses which would reduce returns. The Russell 3000 Index measures the performance of the 3,000 largest U.S.-traded stocks which represent about 98% of all U.S. incorporated equity securities. The Russell 3000 Index serves as the basis for a broad range of market indices, such as the Russell 1000 and the Russell 2000 index. The S&P 500 Index is an unmanaged index of 500 widely held stocks that is generally considered representative of the U.S. stock market. The S&P 500 Equal Weight Index (EWI) is the equal-weight version of the widely-used S&P 500. The index includes the same constituents as the capitalization weighted S&P 500, but each company in the S&P 500 EWI is allocated a fixed weight - or 0.2% of the index total at each quarterly rebalance. Russell Midcap Index measures the performance of the mid-cap segment of the U.S. equity universe. The Russell Midcap is a subset of the Russell 1000 Index. It includes approximately 800 of the smallest securities based on a combination of their market cap and current index membership. Russell 2500 Index measures the performance of the small to mid-cap segment of the U.S. equity universe, commonly referred to as "smid" cap. Russell 2500 is a subset of the Russell 3000 Index. It includes approximately 2,500 of the smallest securities based on a combination of their market cap and current index membership. Russell 2000 Index measures the performance of the small-cap segment of the U.S. equity universe. Russell 2000 is a subset of the Russell 3000 Index representing approximately 10% of the total market capitalization of that index. It includes approximately 2000 of the smallest securities based on a combination of their market cap and current index membership. Russell Microcap Index measures the performance of the microcap segment of the US equity market. Microcap stocks make up less than 2% of the US equity market (by market cap, as of the most recent reconstitution) and consist of the smallest 1,000 securities in the small-cap Russell 2000® Index, plus the next 1,000 smallest eligible securities by market cap.
此内容由惯性聚合(RSS阅读器)自动聚合整理,仅供阅读参考。 原文来自 — 版权归原作者所有。