


JHVEPhoto/iStock Editorial via Getty Images
REX NVDA Growth & Income ETF (NVII) is an actively managed ETF launched on 05/28/2025 with a primary objective of weekly income and a secondary objective of leveraged exposure to the common stock of NVIDIA Corporation (NVDA) with a daily factor between 1.05 and 1.5. NVII has a total expense ratio of 1.49% and an extremely high distribution rate: 48.12%. Distributions are paid on a weekly basis. NVII is a small but quite liquid ETF, with $102 million in assets under management and an average daily trading volume of $3.6 million. The fund’s issuer, REX Shares, specializes in alternative strategy ETFs and ETNs, in particular thematic, leveraged, and options income products.
As described in the prospectus by REX Shares, the fund maintains notional exposure to the common stock of Nvidia between 105% and 150% of NAV using derivatives such as options, swap agreements, and leveraged ETFs on Nvidia, and may also hold the stock itself. The exact leverage factor may change based on real-time technical analysis. The portfolio is rebalanced on a daily basis to attain the targeted exposure every single day.
Additionally, the fund writes covered call options to generate income from premiums. These options may limit participation in the upside potential of the underlying stock. The fund also holds treasuries and cash equivalents as collateral for derivatives.
The fund may use a synthetic covered call strategy, with exposure in Nvidia obtained by a “synthetic long” using a combination of options designed to replicate the asset’s price return. A synthetic long consists of buying call options and selling put options on the underlying asset with the same expiration date and strike price.
There is no guarantee that the objectives of exposure and weekly distributions will be met. Distributions may have a high rate of ROC (return of capital), reducing NAV and therefore the amount of future distributions. Moreover, the daily rebalancing generates leveraged drift (“beta-slippage”), making unpredictable the leverage factor measured on a period longer than one day.
NVII has a 1.25 leverage factor, 120% of net asset value in cash equivalents and treasuries, and three positions in NVDA options, which currently are:
This is an example from 6/12/2026. Portfolio constituents and leverage may have changed by the time you read this and will, of course, change over time.
Nvidia is the publicly traded company with the largest market capitalization in the world at the time of writing (about $5 trillion) and is classified by GICS in the Information Technology sector and in the Semiconductors industry. Its share price has been multiplied by 13 since January 2023, propelled by the company’s leadership in AI chips and market sentiment. Based on Seeking Alpha’s quantitative factor grades, NVDA has excellent growth and profitability characteristics, but stretched valuation.
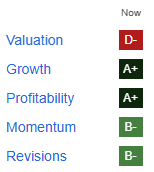
NVDA quantitative factor grades (Seeking Alpha)
Seeking Alpha’s aggregate quantitative ranking puts NVDA in 28th position in its industry among 69 companies, with Micron Technology, Inc. (MU), Intel Corporation (INTC), and Advanced Micro Devices, Inc. (AMD) in the top ranks. As the tech environment changes, so can these rankings.
Currently, NVII is 9% ahead of Nvidia in total return between its inception and 6/12/2026. It is encouraging, but the fund has a short history, and this gap may not be representative of its long-term potential.
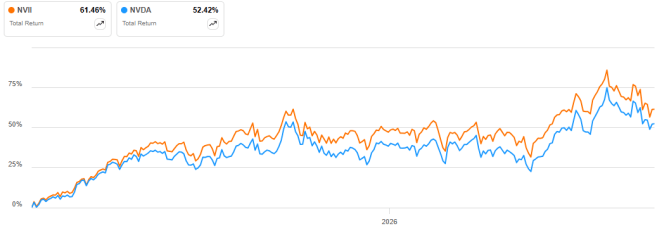
NVII vs. NVDA total return (Seeking Alpha)
In this time frame, the share price is close to flat, all the gains coming from distributions.
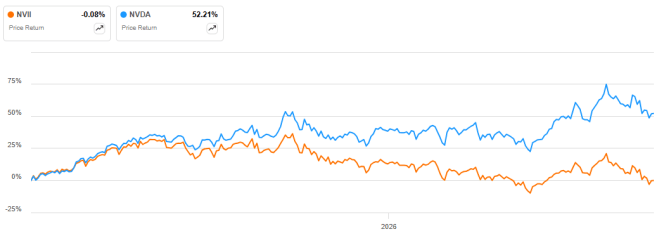
NVII price return (Seeking Alpha)
The weekly distributions have been very variable, with an average of $0.26 per share, as plotted below.
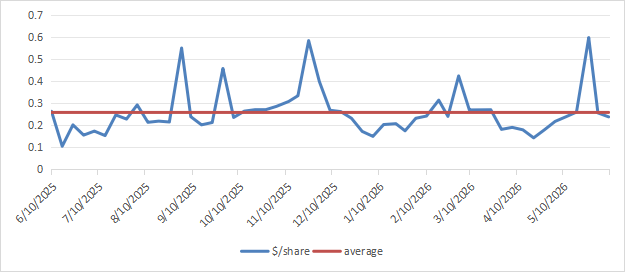
Distribution history (Chart: author; data: REX Shares)
For 2026 until 6/12, distributions have been classified as 97.7% return of capital ("ROC"). High ROC may have a negative impact on a shareholder’s tax. For example, non-resident aliens (“NRA accounts”) may be initially submitted to withholding tax, with an adjustment at year-end that is not always automatic, depending on the broker. High return of capital over time can also indicate potential NAV decay.
The next table compares characteristics of NVII and four derivative income ETFs based on NVDA:
NVII NVDY NVDW NVYY ANV Inception 05/27/2025 05/10/2023 02/18/2025 05/12/2025 02/02/2026 Expense Ratio 1.49% 1.09% 0.99% 1.07% 1.07% AUM $102.09 million $1.43 billion $119.03 million $47.07 million $2.49 million Avg Daily Volume $3.60 million $57.86 million $3.50 million $1.35 million $48.02 thousand Yield TTM 52.65% 61.71% 57.64% 135.48% - Div. Frequency Weekly Weekly Weekly Weekly Monthly 1Y Price Return -7.78% -21.77% -15.19% -52.15% - 1Y Total return 47.56% 36.80% 43.63% 23.97% -
NVII has the highest expense ratio and the lowest yield, but the best total return.
The fund had a solid start in asset growth and investor interest, represented by outstanding shares and average volume on the next chart. As the popularity of the underlying (Nvidia) changes, this ETF could be affected. Waning investor interest would hurt NVII in terms of asset growth, and AUM could shrink. If implied volatility falls, this would diminish its income generation potential. Additionally, due to the leverage factor, price drops in Nvidia would be magnified.
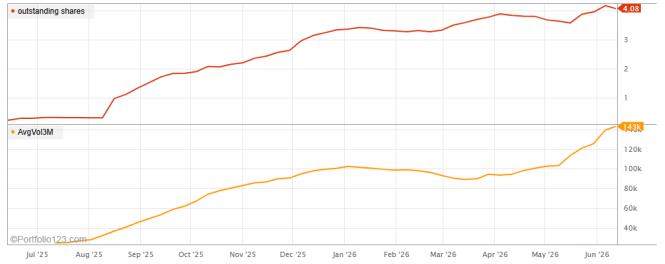
Outstanding shares in million and 3-month average daily volume (Portfolio123)
The strengths of NVII are:
The risk factors of investing in the fund include:
NVII is best suited for investors who are bullish on Nvidia and seek to combine income and capital appreciation. The latter may only be achieved by reinvesting a part of distributions. Due to the risk factors listed above, this ETF is better used as a satellite rather than a core holding.
This article answers these three main questions about NVII:
Editor's note: This article is intended to provide a general overview of the ETF for educational purposes only and, unlike other articles on Seeking Alpha, does not offer an investment opinion about the ETF.
此内容由惯性聚合(RSS阅读器)自动聚合整理,仅供阅读参考。 原文来自 — 版权归原作者所有。