









tadamichi/iStock via Getty Images
The aggregate market cap of AI companies is extremely large relative to the total addressable market (TAM). Valuation of any given AI company might be appropriate if it can individually secure a large market share. However, the same TAM is being sought by so many different companies. They can’t all capture a large market share.
In brief, the aggregate market cap of AI companies implies that they will collectively capture far more than 100% of the TAM or that TAM will be unrealistically large.
Let us begin by estimating the TAM and follow by summing up the collective market cap of AI companies. There is a substantial mismatch in the numbers, and, in my opinion, bubble level overvaluation.
AI is a blanket term often used to refer to any company throughout the vertical. In looking at the market cap and TAM we want to be careful to isolate a specific section of the vertical: The providers of AI services.
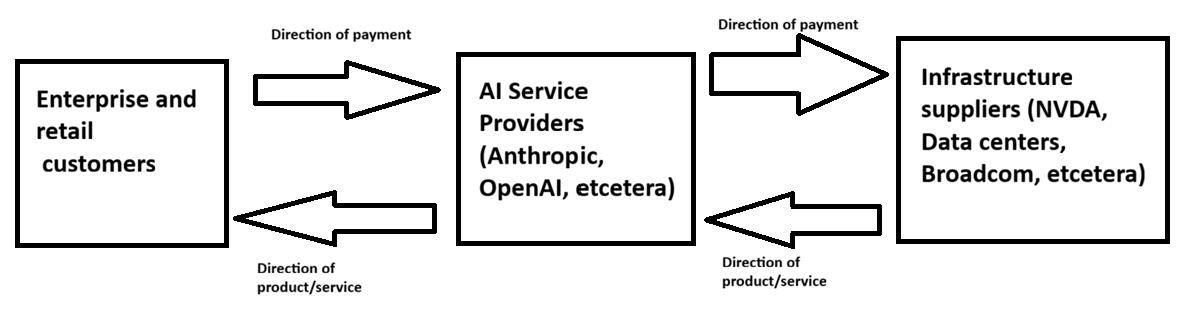
Nvidia (NVDA) and its peers are absolutely AI companies, but they do not derive their revenues from AI services. They are suppliers to the AI service providers. Consider the following flowchart:
2MC
That middle box is the one for which we will be examining the TAM and the market cap. Thus, chip revenues are not part of the TAM and chip makers are not part of the market cap.
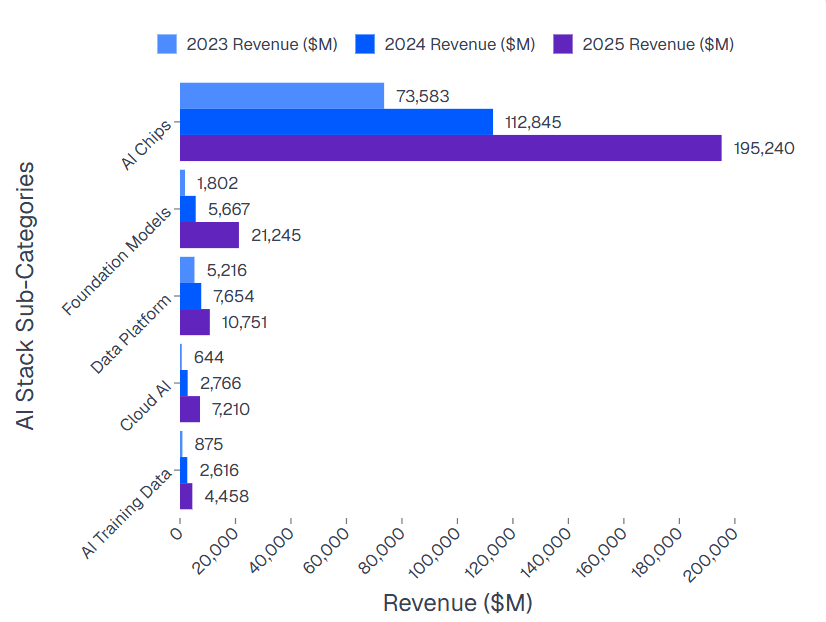
To get a sense for the TAM we can first look at overall AI revenues in 2025.
AIMultiple
Source: AIMultiple.
The $195B of revenues in AI chips is an expense line for AI service providers. AI service revenues fall into the other 4 categories listed above as Foundation Models, Data Platform, Cloud AI and AI Training Data. These revenues summed to $43.7B in 2025.
AI service revenues have been growing quickly and are expected to continue to grow. The market is clearly not valuing these companies on 2025 revenues. It is looking at a TAM that is many times larger than existing revenues.
The point I am wanting to draw attention to is that however large this TAM gets, it is going to be split between the AI players rather than available to each. With that in mind, let us examine the magnitude of market cap splitting the TAM.
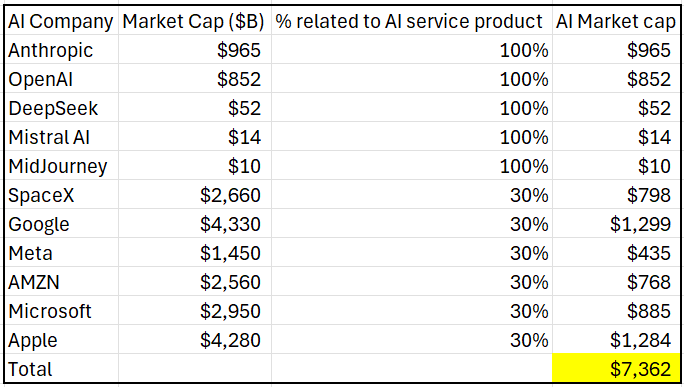
Just as NVDA and its peers were not included in the TAM estimate, we are not including them in the market cap. The list below consists only of those who derive their revenues from selling AI services.
The pure-plays are the easiest to value. We can use the valuation of their latest funding rounds.
From there it gets slightly harder as the following companies have AI services as part of a larger whole.
It is unclear exactly what portion of the valuation of each of these companies is attributable to their AI services versus the rest of their business. So as to get hard numbers, I’m going to assume 30% of their market caps are attributable to AI services or the prospects of future success in the area. Based on the market price movements of these stocks it is likely much higher than that, but I prefer to err on the side of conservative estimation. We sum the market caps in the table below:
2MC
There has been an ongoing narrative in financial media that despite the strong market price moves, AI is not in a bubble. Pundits point to P/E multiples that are somewhat high but still in a normal range of maybe 20X-35X for many of the AI players individually or as a basket.
I find these sorts of multiples to be too broad in what is included. The earnings power that is making the multiple reasonable overwhelmingly comes from 2 sources:
Valuation looks quite different if we isolate AI service revenues and AI service market cap as we broke out earlier.
Isolating just the AI service revenues and market cap we get the following numbers.
That is a trailing revenue multiple of 162X. Most of these AI segments have negative margins at this point in time, so the earnings multiple is infinite or n/a.
One could reasonably argue that these are startups or at least the AI service divisions of these companies are in early stages so traditional P/E multiple or revenue multiple may not be a fair metric.
We can instead value them on TAM.
It seems a near certainty that TAM will expand from the 2025 number. 2026 is already coming in well ahead of that. Popular projections show an exponential growth curve through 2035, but let’s put some numbers to that.
2025 GDP was $30.7T.
It would require AI subscription and token revenue to be a high percentage of GDP to justify $7.3T in market cap. $7.3T is just the AI services market. It would require another massive chunk of the economy for data centers and chip manufacturing.
Valuation of any given AI company might be appropriate for the anticipated total addressable market of AI services if it can capture the lion’s share. However, the aspect the market seems to be missing is that the TAM of each company has significant overlap. They can’t all capture disproportionate share.
The aggregate $7.3T market cap can only be justified by a TAM that is, in my opinion, unrealistic.
此内容由惯性聚合(RSS阅读器)自动聚合整理,仅供阅读参考。 原文来自 — 版权归原作者所有。