







champc/iStock via Getty Images
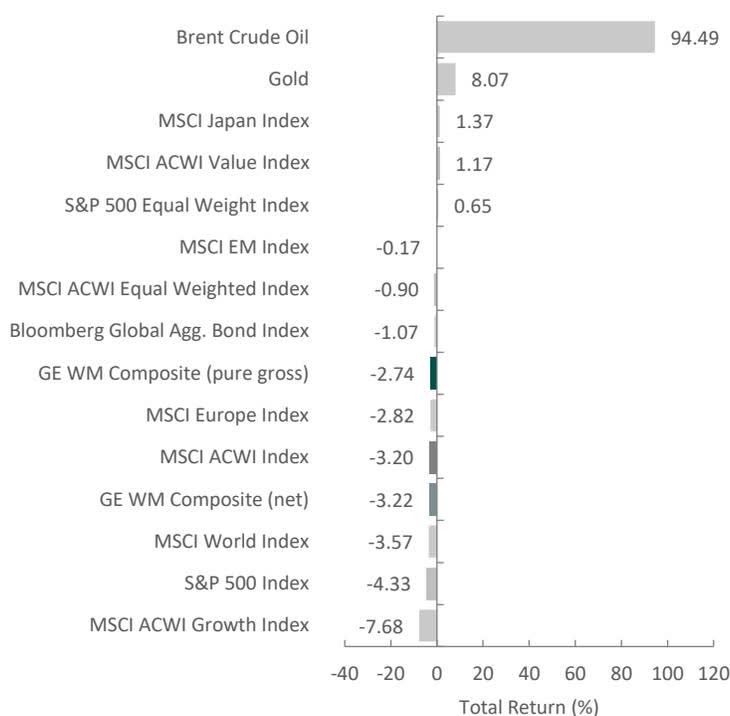
Global equity markets pulled back in the first quarter, with the MSCI ACWI Index falling 3.20% during the period. Global fixed income markets also weakened, as the Bloomberg Global Aggregate Bond Index decreased 1.07%. From a style perspective, value stocks outperformed growth, with the MSCI ACWI Value Index exceeding the MSCI ACWI Growth Index by 8.85%.
Performance across global equity markets was mixed during the period, with gains in Latin America and Japan, while North America and Europe declined. On a sector basis, five out of the eleven sectors within the MSCI ACWI Index advanced, led by Energy, Utilities and Materials. Alternatively, Consumer Discretionary, Communication Services and Information Technology were the worst performers.
Geopolitical developments contributed to increased volatility during the quarter. Trade policy uncertainty persisted, as a Supreme Court ruling limited the U.S. government's ability to impose certain tariffs, adding complexity for businesses navigating global supply chains. In addition, escalating conflict in the Middle East disrupted shipping activity through the Strait of Hormuz, a key route for global energy supply. The resulting supply uncertainty led to a significant increase in oil prices and heightened volatility across energy markets. In a March report, the OECD noted that the Middle East conflict was testing the resilience of the global economy but held its forecast for 2026 global growth at 2.9%.
In the U.S., macroeconomic conditions reflected a moderation in growth alongside continued inflationary pressures. The government reported a slowdown in real GDP growth, while inflation remained above the Federal Reserve's 2% target.
Against this backdrop, the Fed maintained its federal funds target range, citing elevated uncertainty surrounding the economic outlook.
Despite these headwinds, corporate earnings remained resilient, with S&P 500 companies reporting double-digit earnings growth for the fifth consecutive quarter. Information Technology led earnings growth, supported by continued investment in artificial intelligence. However, equity performance within the sector was mixed. Software was a notable area of weakness amid concerns regarding competitive dynamics and the potential impact of AI on traditional business models. More broadly, concerns around labor displacement, increased scrutiny of capital expenditures, resource constraints and private credit risk weighed on sentiment and tempered equity market performance during the period.
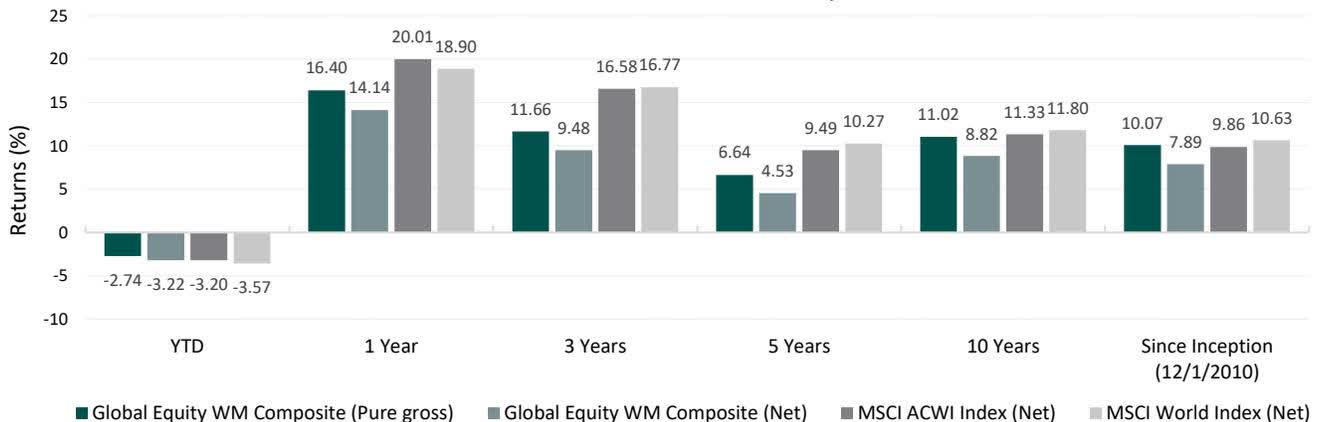
For the first quarter of 2026, Aristotle Capital’s Global Equity WM Composite posted a total return of -2.74% pure gross of fees (-3.22% net of fees), underperforming the MSCI ACWI Index, which returned -3.20%, and outperforming the MSCI World Index, which returned -3.57%. Please refer to the table below for detailed performance.
Performance (%) 1Q26 1 Year 3 Years 5 Years 10 Years Since Inception* Global Equity WM Composite ((pure gross)) -2.74 16.40 11.66 6.64 11.02 10.07 Global Equity WM Composite (NET) -3.22 14.14 9.48 4.53 8.82 7.89 MSCI ACWI Index (NET) -3.20 20.01 16.58 9.49 11.33 9.86 MSCI World Index (NET) -3.57 18.90 16.77 10.27 11.80 10.63
From a sector perspective, the portfolio’s underperformance relative to the MSCI ACWI Index can be attributed to security selection while allocation effects contributed. Security selection in Industrials, Information Technology and Materials detracted the most from the portfolio’s relative performance. Conversely, security selection in Health Care and Financials, as well as an overweight in Energy, contributed the most to relative performance.
Regionally, security selection was responsible for the portfolio’s underperformance relative to the MSCI ACWI Index, while allocation effects contributed. Security selection in Japan detracted the most from relative performance, while security selection in Asia/Pacific ex-Japan was the largest contributor.
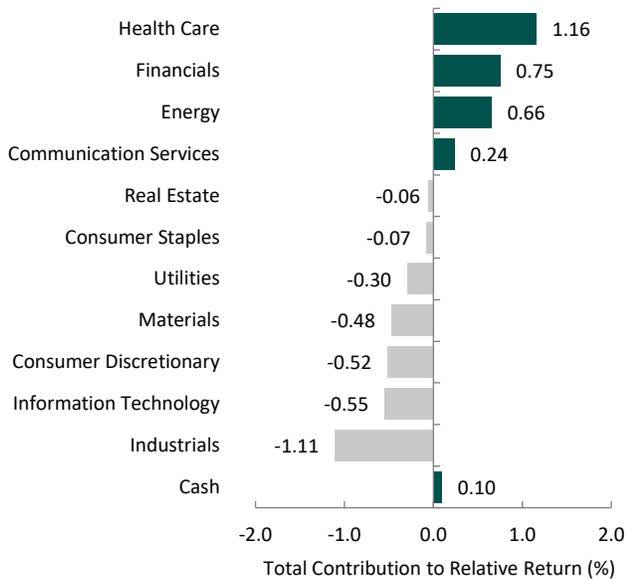
Source: FactSet
Past performance is not indicative of future results. Sector attribution shows how much of a portfolio's overall return is directly attributable to stock selection and asset allocation decisions within the portfolio, highlighting which sectors contributed or detracted to the total return. Attribution includes the reinvestment of income. Attribution is presented pure gross of fees and does not include the deduction of all fees and expenses that a client or investor has paid or would have paid. Please refer to the gross and net composite returns included within to understand the overall impact of fees.
Relative Contributors Relative Detractors TotalEnergies (TTE) MonotaRO (MONOY) Cameco (CCJ) Nemetschek (NEMTF) FirstCash (FCFS) Capital One Financial (COF) Otsuka Holdings (OTSKY) Sony (SONY) Oshkosh (OSK) Qualcomm (QCOM)
Relative contributors and detractors are based on attribution total effect and exclude benchmark securities not held in the portfolio.
MonotaRO, the Japanese business-to-business (B2B) e-commerce platform, was the largest detractor during the quarter. While results remained strong, the stock price was pressured by softer order trends in the enterprise business and a moderation in new customer additions following a period of unusually strong growth. Sentiment was also pressured by the company's exposure to small and medium-sized enterprises in manufacturing and construction, cyclical and cost-sensitive end markets, particularly amid elevated input costs. Despite these near-term headwinds, profitability remained stable, with margin expansion supported by procurement efficiencies, reduced promotional discounting and higher royalty income. Enterprise business also grew more than 20% through newly connected corporations, expanding to approximately one-third of sales, highlighting its increasing importance within the business and reinforcing a key catalyst we originally identified. Management also announced a ¥10 billion share repurchase program, supporting shareholder returns and reflecting continued discipline in capital allocation. Over the longer term, we believe MonotaRO remains well-positioned to continue gaining share in Japan's fragmented and underpenetrated MRO market. The company's broad assortment, operating scale and growing enterprise presence, in our view, support a business that is becoming more embedded in customer procurement workflows over time.
Qualcomm, a leading semiconductor and communications technology company, was one of the largest detractors for the quarter. Despite delivering record revenues during the period, the company guided to lower near-term results due to memory-related supply constraints. Results were impacted by higher memory prices, driven in part by strong demand for AI-related data center applications. This is constraining smartphone production despite otherwise healthy underlying demand and leading handset manufacturers to adopt more cautious production and inventory strategies, reducing near-term chip orders for Qualcomm. We view these headwinds as cyclical rather than structural. Qualcomm has retained its high market share in handsets, even as large clients (most notably Apple (AAPL)) continue to pursue insourcing initiatives, which we believe is a testament to its history of productive R&D spending and technological leadership. Qualcomm also continues to execute on its long-term strategy of evolving from a handset-centric company into a broader connected computing platform. Automotive, Internet of Things (IOT) and newer initiatives, such as AI-enabled PCs and edge inference processors, represent a growing portion of the company, with management targeting roughly half of chip revenue from non-handset applications by the end of the decade. We believe Qualcomm's technologies will continue to benefit as connectivity expands across devices and as AI workloads increasingly shift from the cloud to on-device (the edge), supporting its ability to generate strong FREE cash flow over time.
TotalEnergies, one of the world's largest energy companies, was the top contributor for the quarter. While oil prices increased during the period, driven by geopolitical tensions in the Middle East and disruptions to supply through the Strait of Hormuz, our focus remains on the company's underlying operational execution across its diversified energy platform. As the fourth-largest major energy player in the world, the company operates across upstream, downstream, liquefied natural gas (LNG), and integrated power and renewable energy businesses. Within its upstream segment, TotalEnergies continues to deliver accretive growth, with new projects generating higher cash flow per barrel than its legacy portfolio, supporting both production growth and improving profitability. In the LNG segment, the company has started production in Angola, which will supply Europe and Asia with roughly two million tons of LNG per year, and has also signed an agreement with Glenfarne, the lead developer of the Alaska LNG project, to offtake two million tons of LNG annually for the next 20 years. We view LNG as a key structural driver of long-term growth, particularly given increasing demand for energy security in Asia and Europe. Lastly, within renewables, TotalEnergies and Masdar, an Abu Dhabi clean energy leader, formed a joint venture to accelerate renewable energy growth through onshore solar, wind and battery storage projects across Asia. In the U.S., the company has signed a long-term Power Purchase Agreement to provide 1 GW of solar capacity to power Google (GOOGL)'s data centers in Texas for 15 years. These initiatives reflect the company's strategy to build a more diversified and resilient energy platform over time. Overall, we believe TotalEnergies' combination of disciplined capital allocation, low-cost operations and integrated business model positions it to generate attractive FREE cash flow across commodity cycles, with recent operational progress reinforcing its long-term investment case.
Otsuka Holdings, a leading Japanese healthcare company, was also a top contributor to performance during the quarter. We have long admired the company's robust and diversified product portfolio, which we believe is well-positioned to gain market share in various applications such as depression, schizophrenia and oncology. As awareness of major depressive disorders has continued to increase, Otsuka's leading products, including Rexulti and Abilify Maintena, have exhibited strong prescription growth. In oncology, the heightened attention around colorectal cancer, which has spiked in adults under 55, has led to gains for the company's leading cancer drug, Lonsurf. Furthermore, the company continues to invest in its "Next 8" pipeline, which complements its existing portfolio and supports its next phase of growth. Management has also continued to invest in external innovation, as demonstrated by its recently announced agreement to acquire Transcend Therapeutics, which strengthens its position in psychiatric and neurological disorders, including adding a late-stage candidate targeting PTSD. As the company continues to reinvest in innovation while simultaneously returning value to shareholders, as exemplified by its most recent ¥50 billion share buyback program, we remain confident that Otsuka will continue to deliver attractive long-term returns over time.
During the quarter, we trimmed our position in Cameco for risk management purposes, sold our position in Sony Financial and purchased Chevron (CVX).
Buys Sells Chevron Sony Financial
We received shares of Sony Financial Group following its spinoff from our long-term holding, Sony Group, in October 2025. Sony Financial is a Japan-based financial services company with operations in life insurance, banking and digital payments. While we view Sony Financial as an attractive, well-managed business, we already have meaningful exposure to the global insurance industry through holdings such as AIA Group (AAGIY) and Munich Re (MURGY). Given our existing positioning, we elected to sell the shares received in the spinoff.
Headquartered in Houston, Texas, Chevron is one of the world's largest integrated energy companies, with operations spanning upstream exploration and production, downstream refining and marketing, and chemicals. The company traces its roots back to the 1911 breakup of Standard Oil and today produces approximately four million barrels of oil equivalent per day.
While Chevron operates across the full value chain, roughly 85% of earnings are generated from upstream operations, reflecting its oil-leveraged portfolio. This upstream concentration is intentional and supported by a portfolio of low-cost, long-lived assets. The asset base includes deepwater production in the Gulf of America and Guyana, a large and advantaged Permian Basin position, long-lived conventional production in Kazakhstan, and liquefied natural gas projects in Australia. Chevron also maintains a presence in Venezuela, though it remains a relatively small part of the portfolio.
Under CEO Mike Wirth (appointed in 2018), Chevron has emphasized capital discipline, portfolio optimization and shareholder returns. This strategy has included both targeted acquisitions and meaningful divestitures to high-grade the portfolio. Consistent with this approach, Chevron completed the acquisition of Hess in 2025, increasing its exposure to the Stabroek block offshore Guyana—one of the lowest-cost and highest-return oil developments globally. This transaction enhances Chevron's long-term production visibility and strengthens the quality of its upstream portfolio with a high-margin, long-duration asset base.
Some of the quality characteristics we have identified for Chevron include:
At current levels, we believe shares reflect conservative commodity assumptions and do not fully capture the company's normalized earnings power and strengthening FREE cash flow profile as major capital projects transition from investment to production and capital spending moderates. Combined with a competitive dividend yield and ongoing share repurchases, we believe Chevron offers attractive total return potential over our three- to five-year investment horizon.
Catalysts we have identified for Chevron, which we believe could drive appreciation over our three- to five-year investment horizon, include:
The current investment environment presents a wide range of competing narratives. In such periods, the temptation to react to near-term developments can be significant. At Aristotle Capital, we remain focused on what we believe to be more analyzable and enduring: the long-term fundamentals of individual businesses. When market returns are driven by momentum or shorter-term dynamics, it can be difficult for investors to remain disciplined. We believe such environments create opportunities for patient investors as the gap between price and intrinsic value widens. While political and geopolitical uncertainty remains elevated, our focus is unchanged. We continue to study businesses and invest with a long-term perspective, as we believe fundamentals ultimately determine share price outcomes.
1Q 2026 Commentary (All MSCI index returns are shown net and in U.S. dollars unless otherwise noted.) Markets Review Year-to-Date Returns Sources: CAPS CompositeHub™, Bloomberg Past performance is not indicative of future results. Aristotle Global Equity WM Composite returns are presented pure gross and net of maximum wrap fee and include the reinvestment of income. Pure gross returns do not reflect the deduction of any trading costs or other fees and are supplemental to the net returns. Net returns are calculated by subtracting the highest applicable wrap/SMA fee, which includes trading costs and custodial fees, from the pure gross composite return. The highest applicable wrap/SMA fee is 2.00% on an annual basis, or 0.50% quarterly from inception to 12/31/2023 and 0.17% monthly from 1/1/2024 to present. Please see important disclosures at the end of this document. Aristotle Global Equity WM Composite Performance All Periods Ended March 31, 2026 Sources: CAPS CompositeHub™, MSCI The Aristotle Global Equity WM Composite has an inception date of December 1, 2010. As of 1/1/2024, the composite was renamed from the Global Equity Advisory Composite. Past performance is not indicative of future results. The information provided should not be considered financial advice or a recommendation to purchase or sell any particular security or product. Performance results for periods greater than one year have been annualized. Composite returns are presented pure gross and net of the maximum wrap fee and include the reinvestment of all income. Pure gross returns do not reflect the deduction of any trading costs or other fees and are supplemental to the net returns. Net returns are calculated by subtracting the highest applicable wrap/SMA fee, which includes trading costs and custodial fees, from the pure gross composite return. The highest applicable wrap/SMA fee is 2.00% on an annual basis, or 0.50% quarterly from inception to 12/31/2023 and 0.17% monthly from 1/1/2024 to present. DISCLOSURES: The opinions expressed herein are those of Aristotle Capital Management, LLC (Aristotle Capital) and are subject to change without notice. Past performance is not a guarantee or indicator of future results. This material is not financial advice or an offer to buy or sell any product. You should not assume that any of the securities transactions, sectors or holdings discussed in this report were or will be profitable, or that recommendations Aristotle Capital makes in the future will be profitable or equal the performance of the securities listed in this report. The portfolio characteristics shown relate to the Aristotle Global Equity Advisory strategy. Not every client's account will have these characteristics. Aristotle Capital reserves the right to modify its current investment strategies and techniques based on changing market dynamics or client needs. There is no assurance that any securities discussed herein will remain in an account's portfolio at the time you receive this report or that securities sold have not been repurchased. The securities discussed may not represent an account's entire portfolio and, in the aggregate, may represent only a small percentage of an account's portfolio holdings. The performance attribution presented is of a representative account from Aristotle Capital's Global Equity WM Composite. The representative account is a discretionary client account which was chosen to most closely reflect the investment style of the strategy. The criteria used for representative account selection is based on the account's period of time under management and its similarity of holdings in relation to the strategy. Recommendations made in the last 12 months are available upon request. Composite returns are presented pure gross and net of the maximum wrap fee and include the reinvestment of all income. Pure gross returns do not reflect the deduction of any trading costs or other fees and are supplemental to the net returns. Net returns are calculated by subtracting the highest applicable wrap/SMA fee, which includes trading costs and custodial fees, from the pure gross composite return. The highest applicable wrap/SMA fee is 2.00% on an annual basis, or 0.50% quarterly from inception to 12/31/2023 and 0.17% monthly from 1/1/2024 to present. All investments carry a certain degree of risk, including the possible loss of principal. Investments are also subject to political, market, currency and regulatory risks or economic developments. International investments involve special risks that may in particular cause a loss in principal, including currency fluctuation, lower liquidity, different accounting methods and economic and political systems, and higher transaction costs. These risks typically are greater in emerging markets. While Large-capitalization companies may have more stable prices than smaller, less established companies, they are still subject to equity securities risk. In addition, large-capitalization equity security prices may not rise as much as prices of equity securities of small-capitalization companies. Securities of small- and medium-sized companies tend to have a shorter history of operations and be more volatile and less liquid. Value stocks can perform differently from the market as a whole and other types of stocks. The material is provided for informational and/or educational purposes only and is not intended to be and should not be construed as investment, legal or tax advice and/or a legal opinion. Investors should consult their financial and tax adviser before making investments. The opinions referenced are as of the date of publication, may be modified due to changes in the market or economic conditions, and may not necessarily come to pass. Information and data presented has been developed internally and/or obtained from sources believed to be reliable. Aristotle Capital does not guarantee the accuracy, adequacy or completeness of such information. MSCI ACWI (NET) was stated as the primary benchmark on June 1, 2024 and MSCI World (NET) became the secondary benchmark. The MSCI ACWI captures large and mid-cap representation across 23 developed markets and 24 emerging markets countries. With approximately 2,500 constituents, the Index covers approximately 85% of the global investable equity opportunity set. The MSCI ACWI Equal Weighted Index represents an alternative weighting scheme to its market capitalization-weighted parent index, the MSCI ACWI. The Index includes the same constituents as its parent (large and mid-cap securities from 23 developed markets and 24 emerging markets countries). However, at each quarterly rebalance date, all index constituents are weighted equally, effectively removing the influence of each constituent's current price (high or low). The MSCI World Index is a free float-adjusted market capitalization-weighted index that is designed to measure the equity market performance of developed markets. The MSCI World Index consists of the following 23 developed market country indexes: Australia, Austria, Belgium, Canada, Denmark, Finland, France, Germany, Hong Kong, Ireland, Israel, Italy, Japan, Netherlands, New Zealand, Norway, Portugal, Singapore, Spain, Sweden, Switzerland, the United Kingdom and the United States. The MSCI Emerging Markets Index is a free float-adjusted market capitalization-weighted index that is designed to measure equity market performance of emerging markets. The MSCI Emerging Markets Index consists of the following 24 emerging market country indexes: Brazil, Chile, China, Colombia, Czech Republic, Egypt, Greece, Hungary, India, Indonesia, Korea, Kuwait, Malaysia, Mexico, Peru, Philippines, Poland, Qatar, Saudi Arabia, South Africa, Taiwan, Thailand, Turkey and United Arab Emirates. The MSCI ACWI Growth Index captures large and mid-cap securities exhibiting overall growth style characteristics across 23 developed markets countries and 24 emerging markets countries. The MSCI ACWI Value Index captures large and mid-cap securities exhibiting overall value style characteristics across 23 developed markets countries and 24 emerging markets countries. The MSCI Europe Index captures large and mid-cap representation across 15 developed markets countries in Europe. With approximately 400 constituents, the Index covers approximately 85% of the free float-adjusted market capitalization across the European developed markets equity universe. The MSCI Japan Index is designed to measure the performance of the large and mid-cap segments of the Japanese market. With approximately 200 constituents, the Index covers approximately 85% of the free float-adjusted market capitalization in Japan. The S&P 500® Index is the Standard & Poor's Composite Index of 500 stocks and is a widely recognized, unmanaged index of common stock prices. The S&P 500® Equal Weight Index is designed to be the size-neutral version of the S&P 500. It includes the same constituents as the market capitalization-weighted S&P 500, but each company in the S&P 500 Equal Weight Index is allocated the same weight at each quarterly rebalance. The Bloomberg Global Aggregate Bond Index is a flagship measure of global investment grade debt from 27 local currency markets. This multi-currency benchmark includes Treasury, government-related, corporate and securitized fixed rate bonds from both developed and emerging markets issuers. The Brent Crude Oil Index is a major trading classification of sweet light crude oil that serves as a major benchmark price for purchases of oil worldwide. The volatility (BETA) of the Composite may be greater or less than the benchmarks. It is not possible to invest directly in these indexes. Aristotle Capital Management, LLC is an independent investment adviser registered under the Investment Advisers Act of 1940, as amended. Registration does not imply a certain level of skill or training. More information about Aristotle Capital, including our investment strategies, fees and objectives, can be found in our Form ADV Part 2, which is available upon request.
Year Global Equity WM Composite (Pure Gross %) Global Equity WM Composite (Net %) MSCI ACWI Index (Net %) MSCI World Index (Net %) YTD 2026 -2.74 -3.22 -3.20 -3.57 2025 21.29 18.95 22.34 21.09 2024 4.29 2.25 17.49 18.67 2023 20.07 17.74 22.20 23.79 2022 -16.69 -18.43 -18.36 -18.14 2021 20.60 18.23 18.54 21.82 2020 17.91 15.52 16.25 15.90 2019 28.52 26.05 26.60 27.67 2018 -6.86 -8.75 -9.42 -8.71 2017 23.96 21.53 23.97 22.40 2016 10.77 8.61 7.86 7.51 2015 2.14 0.07 -2.36 -0.87 2014 2.90 0.85 4.16 4.94 2013 25.10 22.66 22.80 26.68 2012 16.93 14.67 16.13 15.83 2011 -6.91 -8.82 -7.35 -5.54 12/1/10 – 12/31/10 5.80 5.64 7.32 7.35
Editor's Note: The summary bullets for this article were chosen by Seeking Alpha editors.
Editor's Note: This article covers one or more microcap stocks. Please be aware of the risks associated with these stocks.
此内容由惯性聚合(RSS阅读器)自动聚合整理,仅供阅读参考。 原文来自 — 版权归原作者所有。