



Trevor Williams/DigitalVision via Getty Images
The iShares Global Tech ETF (IXN) is a $7.5B-sized financial product (by assets under management) that is issued by Blackrock, Inc. under their ‘iShares’ brand of ETFs. IXN, which initially got listed in November 2001, is priced at an expense ratio of 0.39%, and offers an annualized distribution yield of less than 1% (distributions are made twice a year).
IXN is a passively managed ETF that attempts to track the performance of an index crafted by another independent party (S&P Global) called the S&P Global 1200 Information Technology 4.5/22.5/45 Capped Index [SG1IT]. SG1IT, in turn, is a subset of the S&P Global 1200 index [SG1], and seeks to pick out stocks from the latter which are defined as “information technology”. Note that SG1 captures the top 70% of the overall global market cap (making it tilt mainly to giant and large-caps, while it also weights its constituents on the basis of their free float market-cap) and picks up stocks from specific regions such as the US (represented by the S&P 500), Europe (S&P Europe 350), Japan (S&P TOPIX 150), Canada (S&P TSX 60), Australia (S&P/ASX All Australian 50), Asia (S&P Asia 50), and Latin America (S&P Latin America 40). Based on the indices mentioned above, it looks like SG1IT attempts to source tech stocks from all global regions except Africa, and the Middle East.
SG1IT, which rebalances its constituents four times per year, also seeks to impose certain caps on individual holdings to ameliorate concentration effects. For instance, during each quarterly rebalance, no single stock is permitted to account for more than 22.5% of the entire index, and all stocks with individual weights of over 4.5% are not permitted to “jointly aggregate” to 45% of the total index.
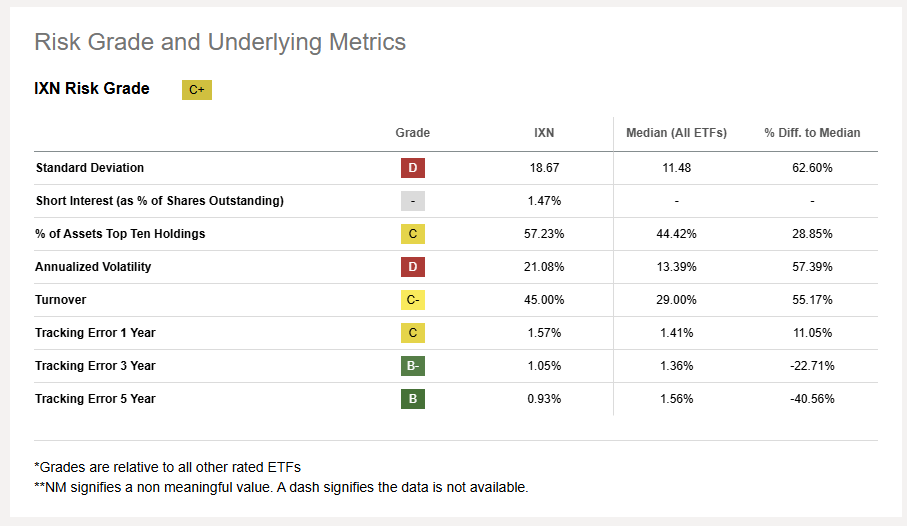
It appears that IXN, which covers 127 stocks in total, does an acceptable job of tracking its target index, as its tracking errors across different time periods are in line with the median ETF levels.
Seeking Apha
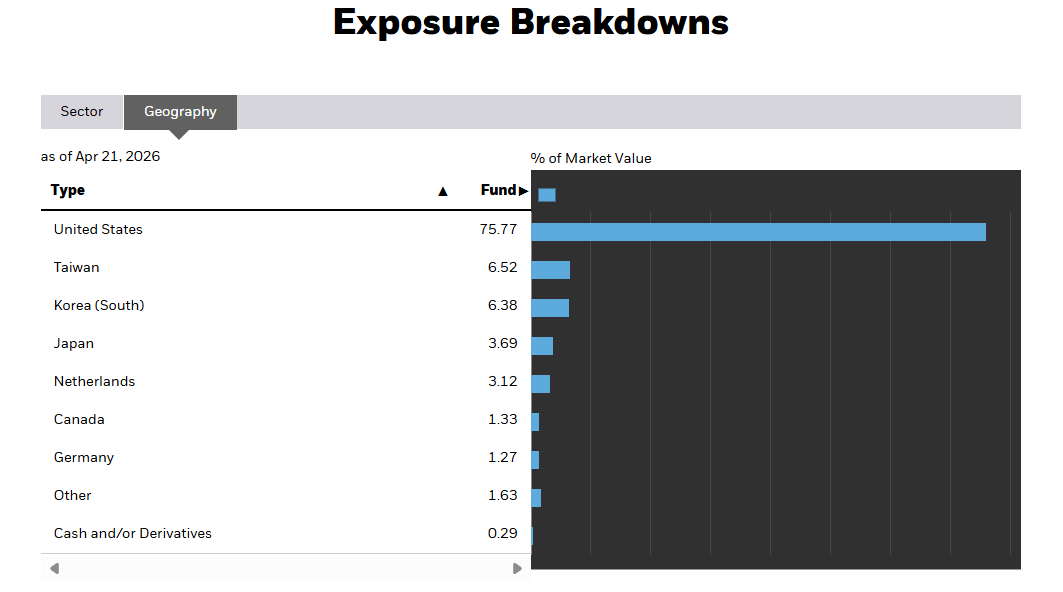
IXN may have the word “global” in its nomenclature, and while it certainly does dabble with stocks from at least six different foreign countries across the world, at the end of the day, this is still very much a US-centric product, with 75% of the portfolio domiciled domestically.
IXN
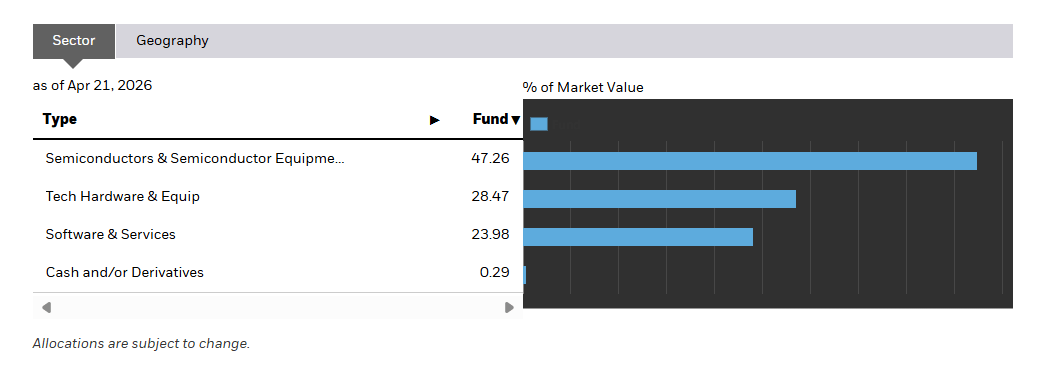
Then, IXN covers businesses from across the technology spectrum, but broadly they can be bracketed into three buckets:
Of these categories, nearly half the portfolio comes from the first bucket.
IXN
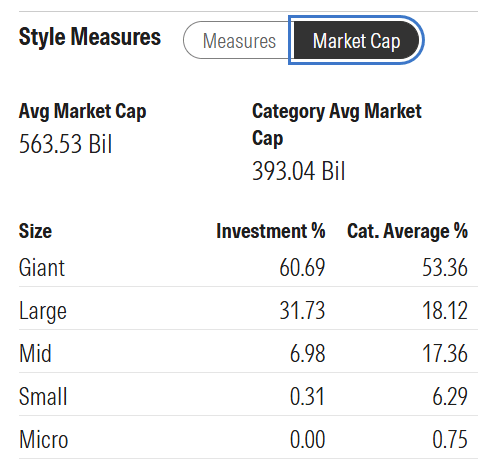
Since IXN’s tracking index is a float-adjusted market-cap weighted index (put simply, stocks with a higher market-cap receive a higher weight in the index), there’s little surprise to note that this is a product that is overwhelmingly dominated by giant and large-caps which account for over 90% of the portfolio. Meanwhile, the average market-cap of over half a trillion dollars only reiterates the strong giant-cap positioning of IXN.
Morningstar
Then, even though IXN covers 127 global tech stocks and seeks to impose certain caps on its individual holdings, that doesn’t take away from the fact that this is a top-heavy portfolio with just the top 5 (or the top 4% of the holdings by number)- Nvidia (NVDA), Apple Inc. (AAPL), Microsoft (MSFT), Broadcom (AVGO), and Taiwan Semiconductor Manufacturing (TSM) jointly accounting for a mammoth 43% of the entire portfolio by value.
Morningstar
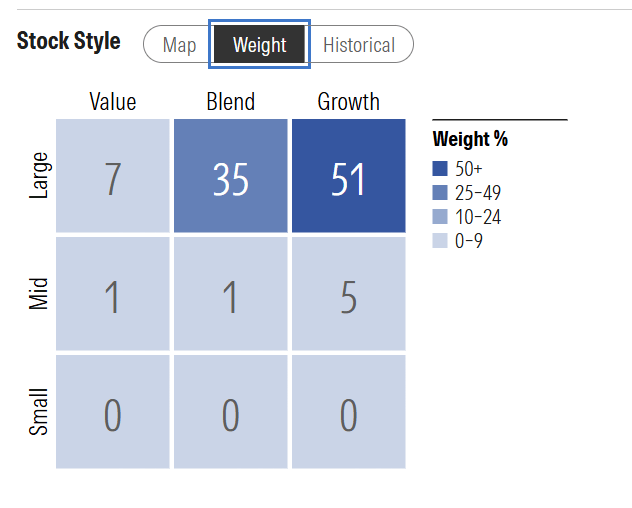
Stylistically, over half of this portfolio consists of growth-style stocks (stocks characterized by strong sales and earnings growth, price momentum over months, those that reinvest excess cash into the business rather than reward shareholders by way of dividends or share repurchases, etc.), although there’s also a useful component (over one-third of the portfolio) of blended stocks which don’t just have the typical growth characteristics, but also some value traits such as relatively cheap valuation multiples, strong dividend payouts, etc.
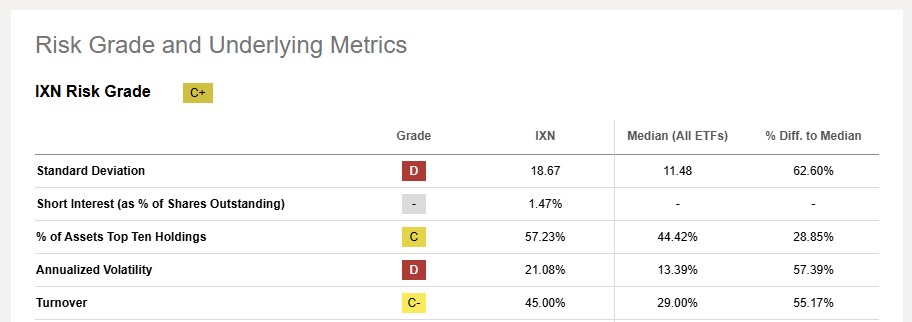
Investors who like to see steady consistent returns from their portfolio holdings, may not take comfort from the erratic nature of IXN’s return profile. To elaborate, while your typical ETF tends to see annualized volatility of 13% in a year, IXN’s volatility profile is considerably higher at over 21%.
Seeking Apha
For further insight, take a look at the image below which shows how divergent IXN’s tracking index's annual returns have been over the last decade. Even over a span of just two years (2022/2023), we’ve seen wild swings from a -30% drawdown in the first year, to a +54% profit in the following year!

S&P Global
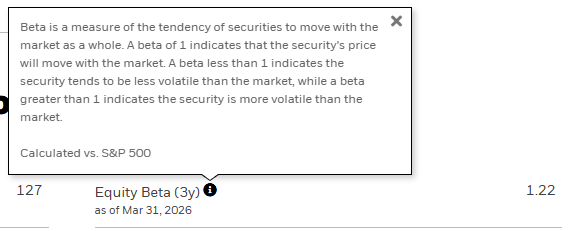
Also take note of IXN’s relatively high sensitivity to the movements of the S&P 500. Over the past three years, IXN’s beta over the prime equity benchmark has worked out to 1.22x, so this tells us that for every 1% movement in the latter, the former can be expected to move by 1.22%. This could prove to be lucrative during a bull run, but the reverse is true during a bear market, making IXN something of a concern, when risk aversion in the markets are on the wane.
IXN
Given the caps that IXN seeks to put in place every quarter, and given the strong interest for US tech mega caps (which could end up expanding their market-caps and relative exposure within IXN’s portfolio), this is an ETF that is going to be susceptible to plenty of transaction activity, which won’t be particularly efficient, if you own it in a taxable brokerage account. To provide further context, while the median annual turnover ratio for an ETF is less than 30%, IXN’s annual turnover ratio is 1.5x more at 45%, and the constant rebalancing is likely to ramp the transaction costs which could also end up eating into the returns.
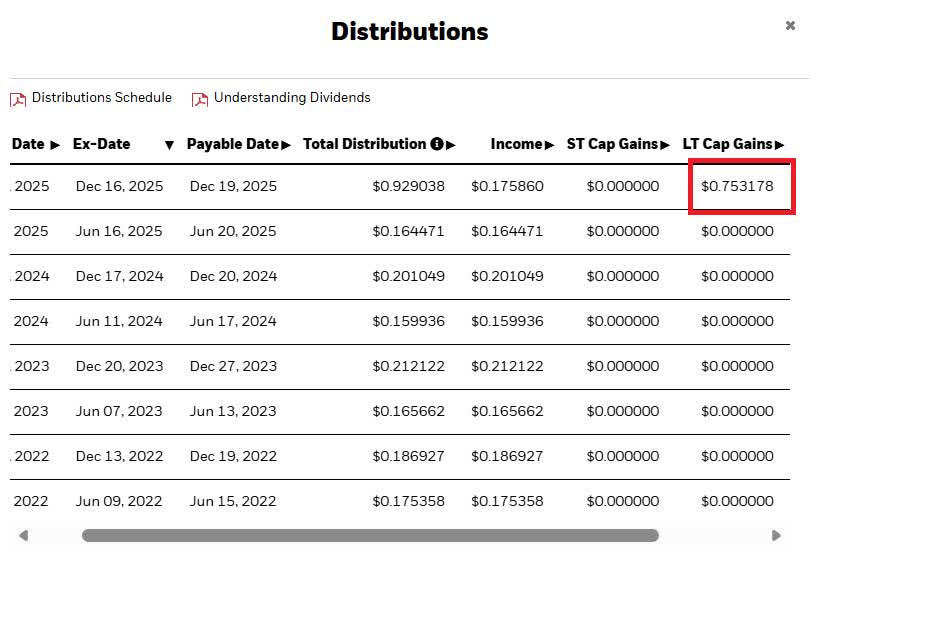
Technology stocks are typically not known for being generous with their distributions to shareholders, and investors of IXN should not be under the impression of assuming that this ETF (which focuses on these tech stocks) is embarking on a new path of distribution largesse. To shed more clarity, note that in December last year, IXN’s total distributions (recall, it makes these distributions twice a year) spiked by a massive 360% YoY at $0.93 per share. However, if investors breakdown that distribution, they will note that it was not because IXN’s holdings decided to distribute higher dividends (in fact, relative to December 2024, the income component actually contracted by -13%), but rather because they saw a substantial capital gain of $0.75 per share. Since, IXN tracks an index that imposes caps on its holdings, it will be forced to sell its holdings once those caps are breached resulting in a long-term capital gain. All, in all, if one just looks at the annualized dividend income (excluding capital gains) facet of IXN, which is more representative of its dividend profile, it only equates to a yield of less than 0.3% (well below the median ETF yield of 2.74%).
IXN
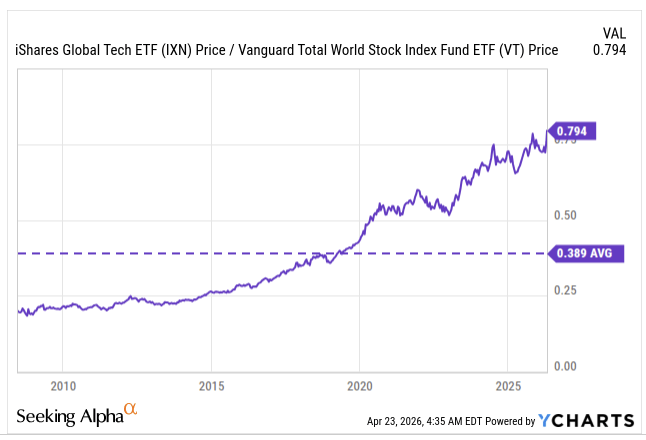
Investors who are mindful of themes of mean reversion in the financial markets, may be troubled to note that global “tech” stocks, look like one of the most overextended counters within global equity markets (the current relative strength ratio of IXN to a more diversified basket of global stocks is more than double its long-term mean of 0.39x and may be vulnerable to some downward mean reversion pressure going forward.
YCharts
Since IXN is still largely dominated by US-domiciled technology stocks, it’s fair to say that this product would be suitable for those who appreciate a strong tilt towards the US technology bucket (which is still largely seen as the hub of the global innovation), without getting entirely wedged to that pocket (25% of IXN’s portfolio consists of global technology stocks which offers some element of diversification). These investors also recognize that the technology supply chain, particularly with the rapid penetration of artificial intelligence is no longer primarily centered in the US, and is also gradually picking up steam in other regions across the world, and want to also gradually profit from that movement.
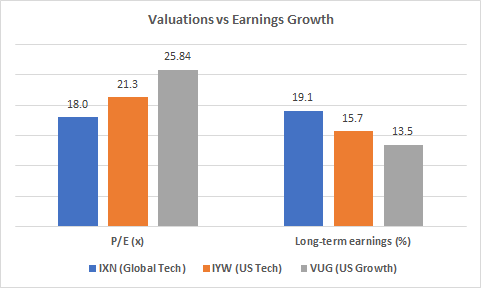
Investors who want a pool of high growth stocks that are not necessarily the priciest from a valuation angle (more commonly known as GARP-style stocks, or those offering growth-at-a-reasonable-price) will likely also fancy a portfolio like IXN. Compared to its sister product- the iShares US Technology ETF (IYW), which covers 139 domestic technology stocks or the most popular growth ETF- the Vanguard Growth ETF (VUG), IXN’s holdings are poised to deliver the most favorable long-term earnings growth (19%). Higher growth usually translates to higher valuation multiples, but in this case, IXN is the cheapest out of the lot, priced at an earnings multiple of 18x which implies a 15% discount over US tech, and a 30% discount over US growth.
Morningstar
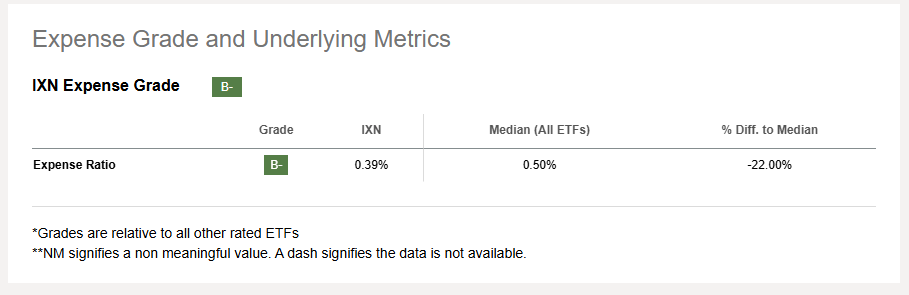
IXN will also appeal to investors who like cost-efficient ETFs; despite having to fish for stocks from across the world, which is not particularly straightforward and easy to procure, IXN is priced at a reasonable expense ratio of only 0.39%, which is around 11bps cheaper than the median ETF expense rate of 0.5%.
Seeking Alpha
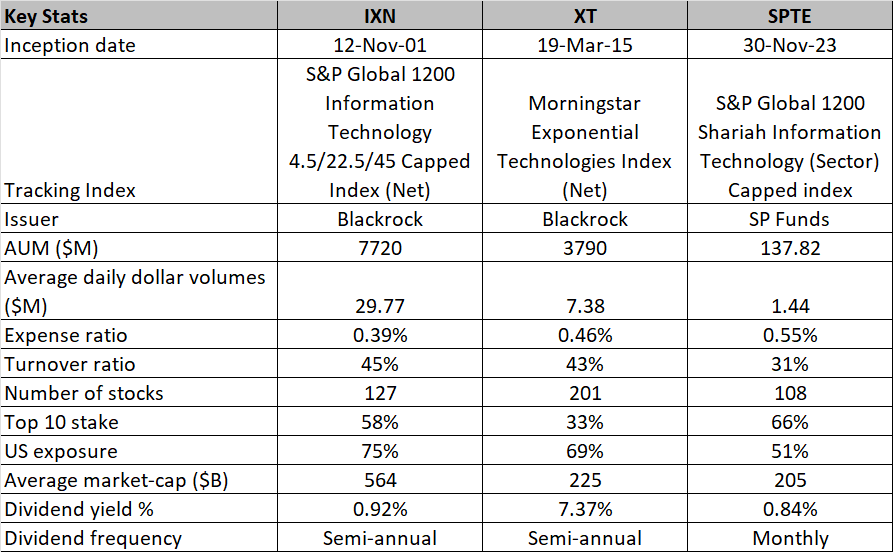
Besides IXN, two other ETF alternatives focusing on the global tech landscape are the iShares Future Exponential Technologies ETF (XT), and the The SP Funds S&P Global Technology ETF (SPTE).
XT is also issued by Blackrock and looks like a more futuristic product as it covers both developed and EM businesses involved in the development of exponential technologies that will likely displace older technologies (the coverage of XT is wider than IXN, but its average market-cap suggests that it is a mega-cap focused fund). Like IXN, XT while global in scope, still mainly tilts to the US (69% exposure), and is also prone to the same degree of churn. XT also offers a stellar trailing yield, but like IXN the most recent distribution isn’t driven by income, but by capital gains (in XT’s case, it isn’t just long-term capital gains, but short-term capital gains as well.
SPTE, which is relatively new (set-up only in 2023), and issued by Shariah funds, tracks a global tech index (only half the portfolio is US-based, offering solid diversification) that is Shariah-compliant (composed in accordance with Islamic law). SPTE, which doesn’t witness as much of churn as the other two, also offers the useful feature of monthly distributions, however when those distributions are annualized, it isn’t too compelling. Note however that SPTE is relatively more expensive to own, suffers from weak daily liquidity, offers the lowest coverage, and is heavily concentrated in its top 10 holdings.
Seeking Alpha, Morningstar
IXN, covers 127 technology stocks, with a lion’s share of the portfolio based in the US. This product comes across as reasonably priced (both from an expense ratio angle, as well as the valuations of its holdings), offering solid earnings growth potential. Investors should be mindful of IXN’s relative high volatility, turnover, and heightened sensitivity to the key US equity benchmark.
This article answers three main questions about IXN:
Editor's note: This article is intended to provide a general overview of the ETF for educational purposes only and, unlike other articles on Seeking Alpha, does not offer an investment opinion about the ETF.
此内容由惯性聚合(RSS阅读器)自动聚合整理,仅供阅读参考。 原文来自 — 版权归原作者所有。