




Schroptschop/iStock via Getty Images
The iShares MSCI Eurozone ETF (EZU), which got listed in July 2000, has managed to accumulate a total AUM of +$9 billion over its lifetime at the time of writing. EZU, which is issued under the ‘iShares’ brand of ETFs by Blackrock, Inc. (BLK), is priced at an expense ratio of 0.5% (in line with the median ETF’s expense rate) and offers an annualized dividend yield of 2.67% (also roughly in line with the median ETF yield). Distributions from this ETF are made twice a year.
EZU’s raison d'être is to offer coverage to stocks from 10 different developed markets within the European Union (EU) alone. To get more specific, the markets in focus are Austria, Belgium, Finland, France, Germany, Ireland, Italy, the Netherlands, Portugal, and Spain.
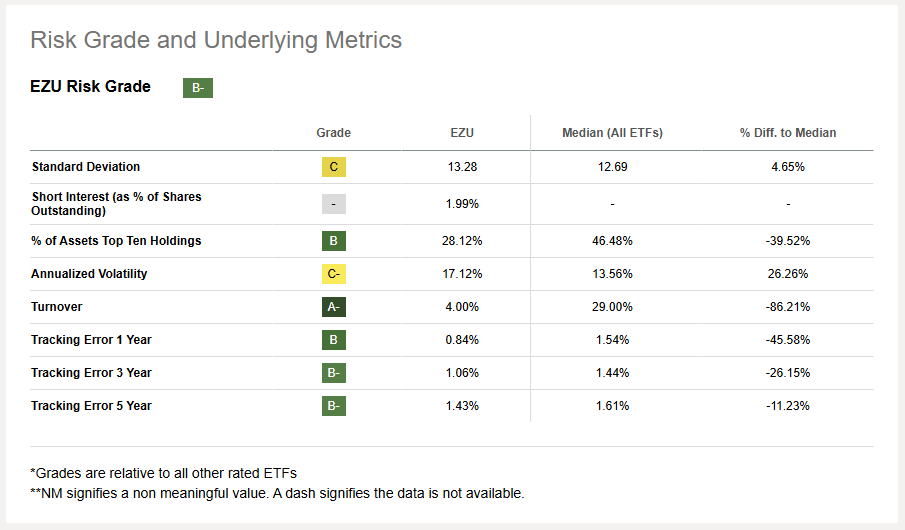
Note that EZU doesn’t rely on a fund manager or a proprietary methodology to pick stocks from these 10 different markets, but rather, it chooses to passively track an index that is built and maintained by another entity (MSCI) called the MSCI EMU Index (MEI). One could say that EZU does a reasonably good job of tracking MEI because the tracking errors it has experienced (across various time durations) have been consistently lower than the tracking errors that are witnessed by the median ETF.
Seeking Alpha
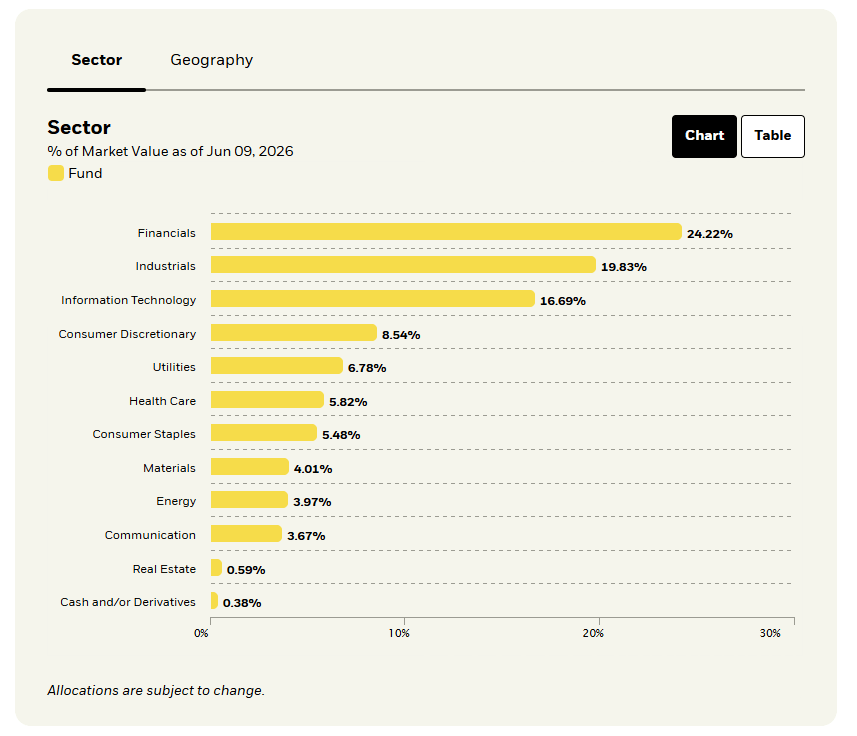
EZU covers 220 stocks in total, and they are sourced from 11 different sectors. However, note that there are 3 sectors (in isolation) that exhibit a double-digit stake in this portfolio, with the top two consisting of cyclical sectors such as financials and industrials (these two sectors alone almost account for half the portfolio).
iShares
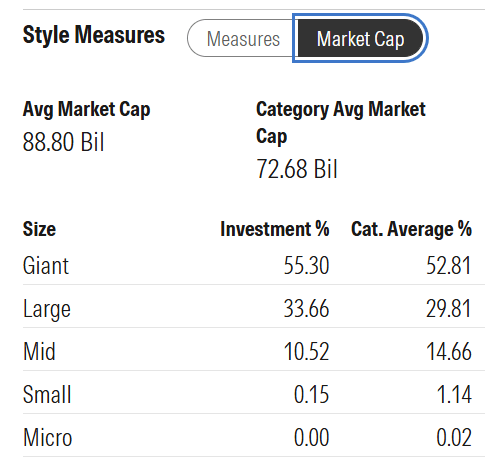
As noted earlier, EZU’s tracking index only focuses on the top 85% of the free-float market-capitalization spectrum from the European Union; this would imply that EZU is unlikely to get hold of small caps. To shed more insight into the respective categories, note that close to 90% of this portfolio consists of giant and large caps, with mid caps just about accounting for a double-digit stake.
Morningstar
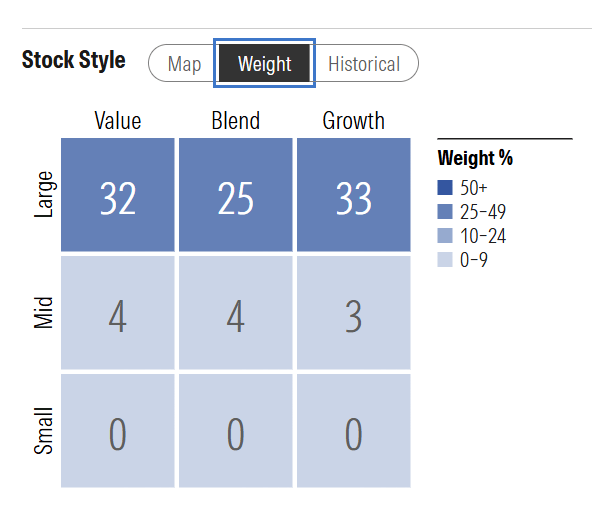
From a stylistic angle, EZU is well balanced, offering equal exposure to both value-style stocks (stocks characterized by low valuation multiples, high payouts, meaningful cash on the balance sheet, etc.) as well as growth-style stocks (stocks with strong sales/earnings growth profiles, strong price momentum over months, etc.), as well as a healthy blended component (stocks that comprise the best of both the value and growth worlds).
Morningstar
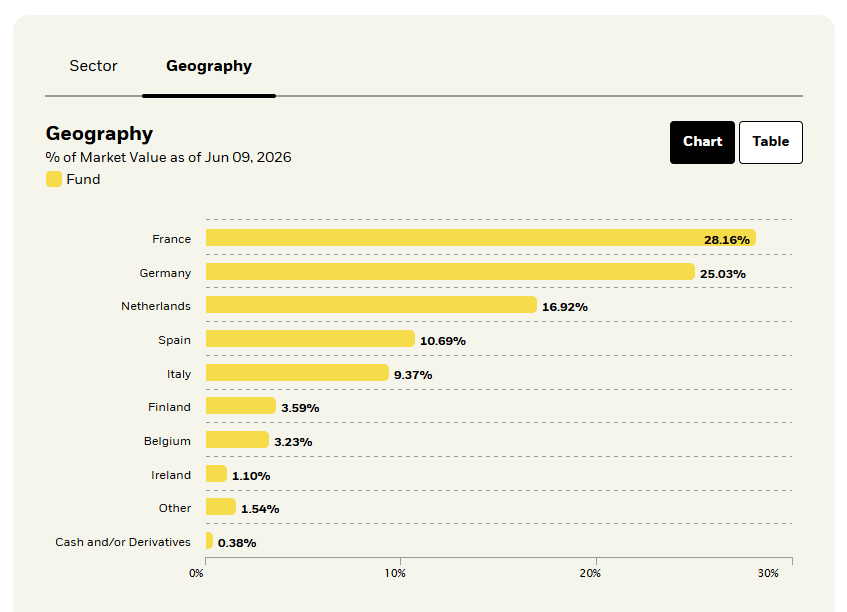
From a geographic perspective, we know that EZU attempts to source its constituents from 10 different developed markets in the EU but note that over 53% of the entire portfolio comes from just two regions (France and Germany).
iShares
EZU target market stocks may be denominated in the EURO currency, but this ETF’s NAV is denominated in USD, and it doesn’t hedge its foreign currency exposure. This means, even if these stocks don’t move in local currency terms, a potential depreciation of the euro against the dollar could end up adversely impacting net returns.
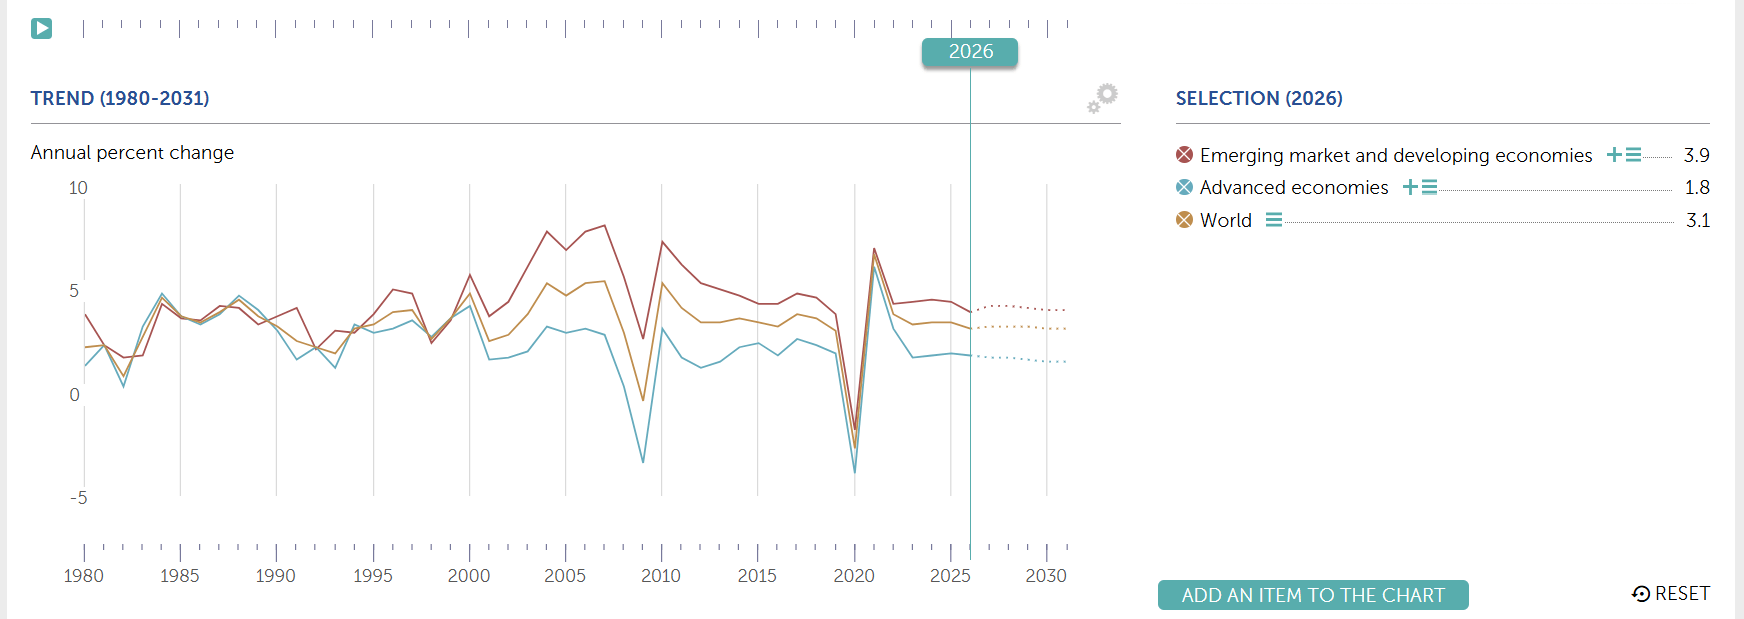
Since EZU is a developed market-focused product, investors should be mindful that GDP growth conditions here are likely to be lower than the globe. As can be gleaned from the image below, since the turn of the millennium, annual real GDP growth p.a. for advanced economies (another moniker for developed markets) has largely lagged that of the globe, as well as EMs and developing economies, and going forward, the gap is only expected to widen (also, at least through 2030, advanced economies are not expected to post annual real GDP growth that will cross the 1.8% mark). Relatively subdued economic growth could also likely reflect unfavorably on a portfolio like EZU that is dominated by cyclical sectors, which tend to be very sensitive to GDP growth. Of course, the positive and negative catalysts around EZU will change over time.
IMF
Most other ETFs that offer diversified coverage to stocks from across Europe typically include stocks from the UK as well. In that regard, EZU could represent a suitable product for European-focused investors who want to bypass the UK equity universe entirely.
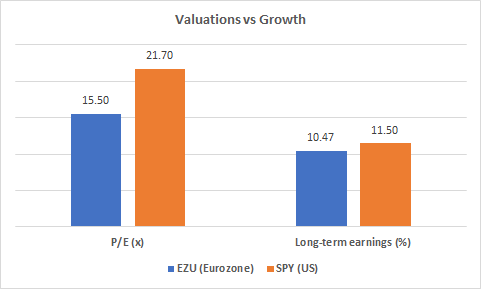
As noted earlier, EZU offers something for both value-style and growth-style investors; put another way, it comes across as an ideal representative of the GARP (growth-at-a-reasonable-price) cohort. To shed more insight, if one is to compare it to US large and mid-caps (as represented by the S&P 500), note that it too offers long-term earnings growth within the early double-digit percentage bracket (like the SPY, which tracks the S&P 500), although a slight differential of roughly 1%. However, at a roughly similar earnings growth profile, EZU currently offers better value, as it is priced at an earnings multiple of only 15.5x (which translates to a meaningful relative discount of 30% to the corresponding multiple of the SPY). Needless to say, these differentials will not remain static over time.
Morningstar
Investors who dislike frequent portfolio churn and like to see some consistency in their holdings will also appreciate a product like EZU, which turns over less than 5% of its portfolio on an annual basis (in contrast, most ETFs tend to engage in annual churn that is at least 7x higher). Lower portfolio churn also means lower transaction costs (which also impacts net returns).
Two interesting ETF alternatives to EZU that could be taken note of are the Vanguard Europe ETF (VGK), which tracks the FTSE Developed Europe All Cap Index, and the iShares Currency Hedged MSCI Eurozone ETF (HEZU), which tracks the MSCI EMU 100% Hedged to USD Index.
VGK is suggested simply because of its remarkable cost-efficiency (it is priced at a best-in-class expense ratio of just 6bps whereas EZU’s price is over 8x more) and its scale and liquidity (which is over 3x more than EZU's, and the most amongst any diversified European ETF). VGK also offers more frequent distributions (4 times a year) than EZU, which only pays twice, and its coverage of total stocks is far wider (almost 5.5 more). However, what’s key to note is that VGK is more European-focused, rather than Eurozone-focused, and this means it’s stocks from the UK that account for the largest share of the portfolio (interestingly, Europe’s largest economy—Germany—isn't even part of the top 3 regions that VGK covers). Like EZU, VGK too is not prone to a great deal of churn (annual turnover of just 5%), while its average market cap is a bit lower.
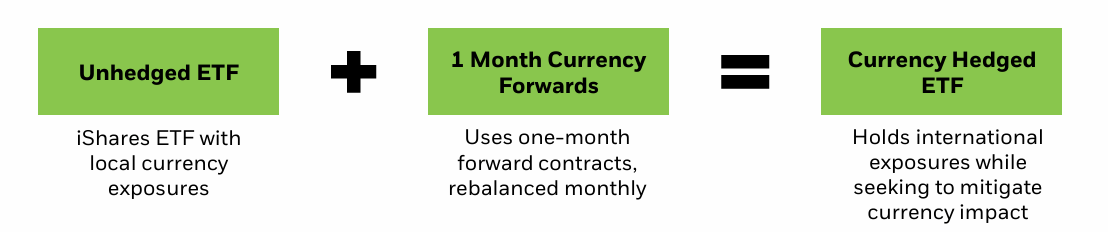
HEZU, which can be construed to be EZU’s sister product, shares a lot of similarities with our ETF in focus (note the stock coverage, sector exposure, geographic exposure, dividend frequency, and yield) and can be seen as an ideal alternative for those who want to mitigate the currency fluctuations that are likely to crop up with investing in these Euro-denominated assets. What HEZU does is that it holds EZU (to get the necessary stock coverage) and also sells one-month forward contracts of the EUR/USD pair (these positions are rebalanced every month).
iShares
Investors may also want to note that HEZU, which isn’t very popular as EZU or VGK (both in terms of AUM or daily dollar volumes), is priced at a slightly higher expense ratio (than EZU) of 0.53%.
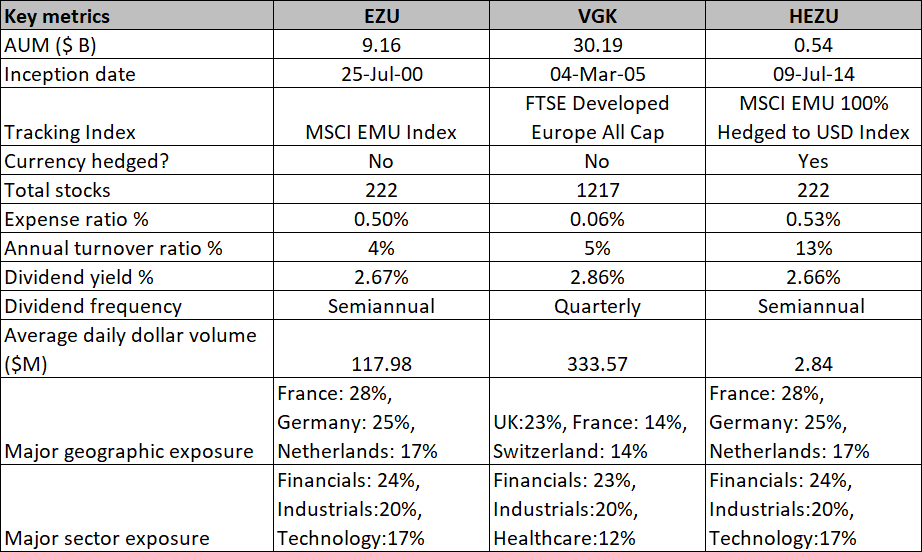
Seeking Alpha, Morningstar
EZU, which covers 222 stocks from 10 developed markets across the Eurozone, comes across as a suitable vehicle for those who want exposure to GARP-type stocks from Europe (while bypassing the UK). EZU has a cyclical heavy portfolio that could be vulnerable to the subdued GDP growth prospects of developed markets through this decade.
This article answers these three main questions about EZU:
Editor's note: This article is intended to provide a general overview of the ETF for educational purposes only and, unlike other articles on Seeking Alpha, does not offer an investment opinion about the ETF.
此内容由惯性聚合(RSS阅读器)自动聚合整理,仅供阅读参考。 原文来自 — 版权归原作者所有。