









AlexSecret/E+ via Getty Images
For the first quarter, 1 Main Capital Partners, L.P. (“1MC” or the “Fund”) returned (4.6)%, compared to (4.4)% and 0.9% for the S&P 500 and Russell 2000, respectively. 1
2026 YTD Inception Cumulative Annualized 1 Main Capital Partners - net -4.6% 326.3% 19.4% S&P 500 -4.4% 163.9% 12.6% Russell 2000 0.9% 76.2% 7.2% ITD is from the Fund's inception, February 1, 2018.
IWG declined by approximately 25% in the quarter, costing the Fund more than 4%. Investors were spooked by a Citrini Research report "The 2028 Global Intelligence Crisis," which triggered a cascading selloff of many service companies perceived to be at risk from AI disruption. Operation Epic Fury and the resulting rise in oil prices, as well as IWG's Q4'25 earnings call which tempered 2026 FCF expectations, contributed further to the pullback.
While the market reacted with its customary "shoot first ask questions later" mentality, I continue to believe that our investment in IWG will yield strong results in the years ahead. With respect to management's FCF commentary, some 2026 FCF was instead pulled into 2025, which came ahead of expectations. More importantly, IWG's medium-term business outlook remains compelling. The company expects at least 4% top-line growth this year, with significant operating leverage driving low-teens EBITDA growth. It also continues to target $1 billion of EBITDA over the medium term, which I believe is conservative. If achieved, the stock is currently trading at less than 3x 2030 free cash flow, after accounting for the ongoing share count reduction driven by an aggressive buyback program.
As for AI, I believe that IWG is a stealthy winner . On the demand side, AI should drive startup formation and push enterprises to accelerate their adoption of short-term leases. On the supply side, rising office vacancies created by shrinking demand for long-term leases should generate a growing pipeline of landlords open to partnering with IWG under its asset-light managed partnership model. This combination should result in more short-term supply for IWG to fill and more short-term demand to fill it with — and all of it coming from locations where IWG manages the operations in exchange for a management fee of approximately 15% of revenues with none of the associated costs.
Additionally, while higher oil prices may cause a near-term economic slowdown and impact occupancy in IWG's owned centers, a temporary slowdown should have no meaningful bearing on the long-term value of the business. As a reminder, I dynamically underwrite all the Fund's holdings with a focus on the long-term fundamentals rather than geopolitical headlines of any given quarter and continue to remain excited about the prospects of our portfolio.
At quarter-end, the Fund's top five positions were Basic-Fit (BSFFF) (BFIT NA), International Workplace Group (IWGFF) (IWG), KKR & Co (KKR), Limbach (LMB) and MasterCraft (MCFT). Together, these accounted for approximately 65% of capital.
During the quarter, the Fund reinitiated a core position in KKR after it declined more than 30%, caught up in a private credit scare that was exacerbated by the previously mentioned Citrini report. As a reminder, the Fund profitably owned KKR from 2019 to 2024, with the view that alternative asset managers ("alts") would take share from traditional asset managers, and that KKR was one of the top-tier firms ("mega-alts") positioned to take share within the alts.
Since we initially invested, KKR's AUM has more than tripled from $200 billion to $700 billion. In 2026, the firm should generate over $5 billion of annual management fees at 70% operating margins, split roughly evenly across private equity (37%), real assets (33%), and credit (30%). PE, the most mature of the three, continues to grow AUM and fees at a double-digit pace. Real assets AUM has grown 8x to $200 billion since 2019, the Asia platform has grown 4x to $80 billion, and its K-Series retail platform more than doubled AUM to $34 billion in 2025 alone.
Despite this growth, the runway ahead remains long. Management anticipates exceeding $1 trillion in AUM by 2030 — a target I believe will prove conservative. For context, Blackstone already manages $1.3 trillion today, while BlackRock manages over $10 trillion. In addition to management fees, KKR generates performance income, investment income on firm capital co-invested alongside clients, and profits from Global Atlantic, its wholly owned insurance subsidiary. At its 2024 investor day, KKR guided to 2026 adjusted net income per share of more than $7.
The market is mainly concerned about two things, however: a private credit bubble and AI's impact on service companies. I believe both fears are overblown, particularly as they relate to KKR. The firm's credit business accounts for just 30% of total fees and a smaller percentage of profits. Within that 30%, roughly half is in leveraged credit — liquid bonds and loans with externally validated marks — and roughly a third is in asset-based finance backed by hard assets. Direct lending, where the bubble fears are most concentrated, represents less than 20% of the credit book and just 5% of total AUM.
Meanwhile, software companies account for only 7% of AUM, a smaller share than many competitors and even the broad public equity and credit indices. KKR's team has been aware of AI risks and incorporating them into underwriting for years. Even if there are losses, I expect KKR to shine on a relative basis — and I believe the coming years will see a shakeout among mid-sized alt managers, with mega-alts like KKR taking further share as allocators gravitate toward blue-chip names with the longest track records and the least career risk. Additionally, after four years during which many institutions were overallocated and overcommitted to alts, allocations finally appear to be getting back into balance making it easier for new commitments.
It is also worth noting that KKR just closed its flagship Americas NAX4 fund at $23 billion, meaningfully reducing near-term fundraising risk. And the firm has already notched several high-profile exits this year, including the $5 billion sale of CoolIT to Ecolab (ECL) — a 15x return in three years. Near-term market volatility may weigh on additional exits and performance income, but KKR remains an exceptionally high-quality business poised to grow earnings at a double-digit rate for the foreseeable future. Insiders seem to agree, and despite already owning nearly a third of the company, they spent $50 million on open market purchases as the stock pulled back. At a low double-digit multiple of 2026 owner's earnings, the risk/reward looks compelling.
Small caps entered 2026 with significant momentum and continued to lead through the quarter. The broader macro backdrop is supportive: a strong labor market, resilient consumer spending, and early signs of a broadening economic expansion beyond the narrow set of mega-cap technology names that dominated the last few years.
However, the Iran conflict has introduced a meaningful wildcard. If the Strait of Hormuz reopens and the situation de-escalates, the economy appears poised to accelerate — and the environment for small, high-quality, undervalued businesses looks particularly attractive.
If the Strait remains closed, we should prepare for persistently higher oil prices, renewed inflation pressure, and a Fed in an uncomfortable position. 1MC is not in the business of trying to predict geopolitical outcomes, but I am confident our portfolio is well-positioned for either scenario. Our core holdings are well-capitalized, generate significant free cash flow, and have limited direct exposure to commodity prices or the AI displacement fears that rattled markets this quarter. If anything, periods of indiscriminate selling are exactly when 1MC's strategy is designed to add value — they create entry points and repositioning opportunities that patient, analytical, fundamental investors can exploit.
More broadly, I see a market that remains bifurcated: expensive growth assets on one side, and a collection of high-quality, cash-generative businesses on the other that continue to be ignored. We are firmly planted in the second camp. Similar to our investment approach, the management teams running our businesses use downturns to acquire competitors, buy back shares, and widen their moats. This formula has served 1MC well since inception. Timing is always uncertain, but I remain confident that we are positioned for strong prospective performance.
The Fund remains open to capital from existing and new like-minded partners; notably, the Founder's Class has less than $10 million of capacity remaining and I expect that it will be filled during the second quarter. Additionally, I will be attending several cap intro events in the coming months and would welcome the chance to meet in person.
Please reach out if you would like to connect at or around any of the above, or with any other thoughts or questions.
Sincerely,
Yaron Naymark
Performance Summary The chart displays the cumulative performance of three investment options from February 2018 to February 2026. The y-axis represents the value in percentage terms, ranging from 50% to 500% in 50% increments. The x-axis shows dates from Feb-18 to Feb-26 in approximately 8-month intervals. The blue line represents '1 Main, net', the orange line represents the 'S&P 500', and the grey line represents the 'Russell 2000'. All three lines start at 100% in Feb-18. The blue line shows the highest growth, ending at approximately 425% in Feb-26. The orange line ends at approximately 275%, and the grey line ends at approximately 180%. Line chart comparing 1 Main, net (blue), S&P 500 (orange), and Russell 2000 (grey) from Feb-18 to Feb-26. The y-axis shows percentage values from 50% to 500%. Important Disclosures In general. This disclaimer applies to this document and the verbal or written comments of any person presenting it (collectively, the “ Report ”). The information contained in this Report is provided for informational purposes only and does not contain certain material information about 1 Main Capital Partners, L.P. (the “ Fund ”), including important disclosures and risk factors associated with an investment in the Fund, and no representation or warranty is made concerning the completeness or accuracy of this information. To the extent that you rely on the Report in connection with an investment decision, you do so at your own risk. Certain information contained herein was obtained from or provided by third-party sources; although such information is believed to be accurate, it has not been independently verified. The information in the Report is provided to you as of the dates indicated and 1 Main Capital Management, LLC and its affiliates (collectively, the “ Manager ”) do not intend to update the information after its distribution, even in the event the information becomes materially inaccurate. No offer to purchase or sell securities. This Report does not constitute an offer to sell, or the solicitation of an offer to buy, and may not be relied upon in connection with the purchase of any security, including an interest in the Fund or any other fund managed by the Manager. Any such offer would only be made by means of such Fund’s formal private placement documents, the terms of which shall govern in all respects. Performance Information. Unless otherwise noted, any performance numbers used in the Report are for the Fund’s Class A Interests, and are net of any accrued incentive allocation, management fees and other applicable expenses, include the reinvestment of dividends, interest and capital gains, and assume an investment from inception of such Class. As such, the performance numbers do not reflect the performance of any particular investor’s interest and you should not rely on it as a statement of your actual return. Past performance. In all cases where historical performance is presented, please note that past performance is not a reliable indicator of future results and should not be relied upon as the basis for making an investment decision. Risk of loss. An investment in the Fund will be highly speculative, and there can be no assurance that the Fund’s investment objective will be achieved. Investors must be prepared to bear the risk of a total loss of their invested capital. Portfolio Guidelines/Construction. Information contained in this Report, especially as it pertains to portfolio characteristics, construction, profiles or investment strategies or objectives, reflects the Manager’s current thinking based on normal market conditions, and may be modified in response to the Manager’s perception of changing market conditions, opportunities or otherwise, in the Manager’s sole discretion, without further notice to you. Any target strategies, objectives or parameters are not projections or predictions and are presented solely for your information. No assurance is given that the Fund will achieve its investment strategies, objectives or parameters. Index Performance. The index comparisons are provided for informational purposes only. The S&P 500 Total Return Index (SPXT) is a capitalization weighted index that is designed to measure the performance of the broad U.S. economy through changes in the aggregate market value of 500 stocks representing all major industries. There are significant differences between the Fund and the index referenced, including, but not limited to, risk profile, liquidity, volatility and asset composition. The index reflects the reinvestment of dividends and other income, are unmanaged, and do not reflect a deduction for advisory fees. An investor may not invest directly into an index. For the foregoing and other reasons, the performance of the index may not be comparable to the Fund’s and should not be relied upon in making an investment decision with respect to the Fund. No tax, legal, accounting or investment advice. The Report is not intended to provide, and should not be relied upon for, tax, legal, accounting or investment advice. Logos, trade names, trademarks and copyrights. Certain logos, trade names, trademarks and/or copyrights (collectively, “ Marks ”) contained herein are included for identification and informational purposes only. Such Marks may be owned by companies or persons that are not affiliated with the Manager or any of the funds managed by the Manager and no claim is made that any such company or person has sponsored or endorsed the use of such Marks in the Report. Confidentiality/Distribution of the Report. The information in this Report is confidential. By accepting any portion of the Report, you agree that you will treat the Report confidentially. It is intended only for the use of the person to whom it is given and the Manager expressly prohibits its redistribution without the Manager’s prior written consent. The Report is not intended for distribution to, or use by, any person or entity in any jurisdiction or country where such distribution or use is contrary to law, regulation or rule.
2026 Jan Feb Mar Apr May Jun Jul Aug Sep Oct Nov Dec YTD 1 Main Capital Partners - Gross 8.2% -6.0% -5.9% -4.3% 1 Main Capital Partners - Net 6.6% -4.9% -5.9% -4.6% S&P 500 index - incl dividends 1.4% -0.8% -5.0% -4.4% Russell 2000 - incl dividends 5.4% 0.8% -5.0% 0.9%
One Year Three Year Five Year Since Inception Inception Annualized 1 Main Capital Partners - Gross 24.4% 22.7% 20.1% 517.7% 25.0% 1 Main Capital Partners - Net 18.8% 18.0% 15.5% 326.3% 19.4% S&P 500 index - incl dividends 17.8% 18.3% 12.0% 163.9% 12.6% Russell 2000 - incl dividends 25.8% 13.0% 3.7% 76.2% 7.2% 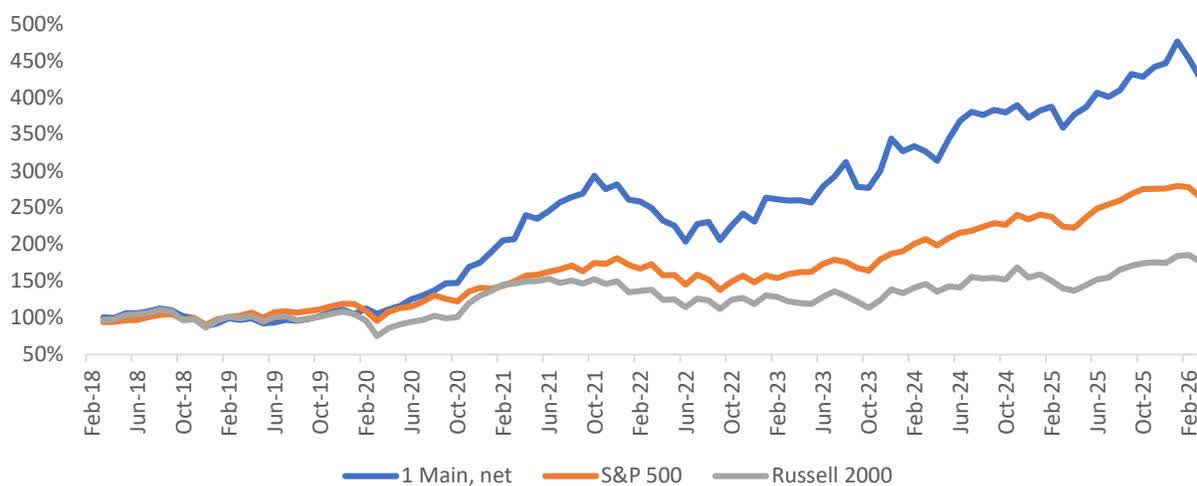
Editor's Note: The summary bullets for this article were chosen by Seeking Alpha editors.
此内容由惯性聚合(RSS阅读器)自动聚合整理,仅供阅读参考。 原文来自 — 版权归原作者所有。