






wing-wing/iStock via Getty Images
The estimated year-to-date first quarter of 2026 and historical net performance for Silver Beech Capital, LP ((“the Fund” or “Silver Beech”)) are presented below.
Performance Summary*:
SilverBeech S&P500 Russell2000 2021 Track Record 32.6% 28.7% 14.8% 2022 6.9% (18.1%) (20.4%) 2023 Silver Beech 27.7% 23.7% 13.0% 2024 23.9% 25.0% 11.5% 2025 0.4% 17.9% 12.8% 2026 (((3/31 YTD))) -2.0% -4.3% 0.9%
January 1, 2021 – March 31, 2026
Compound Annual Return 16.4% 12.4% 5.3% Value of $100 Invested $221 $184 $131
Performance Comparison: Value of $100 Invested at Inception*
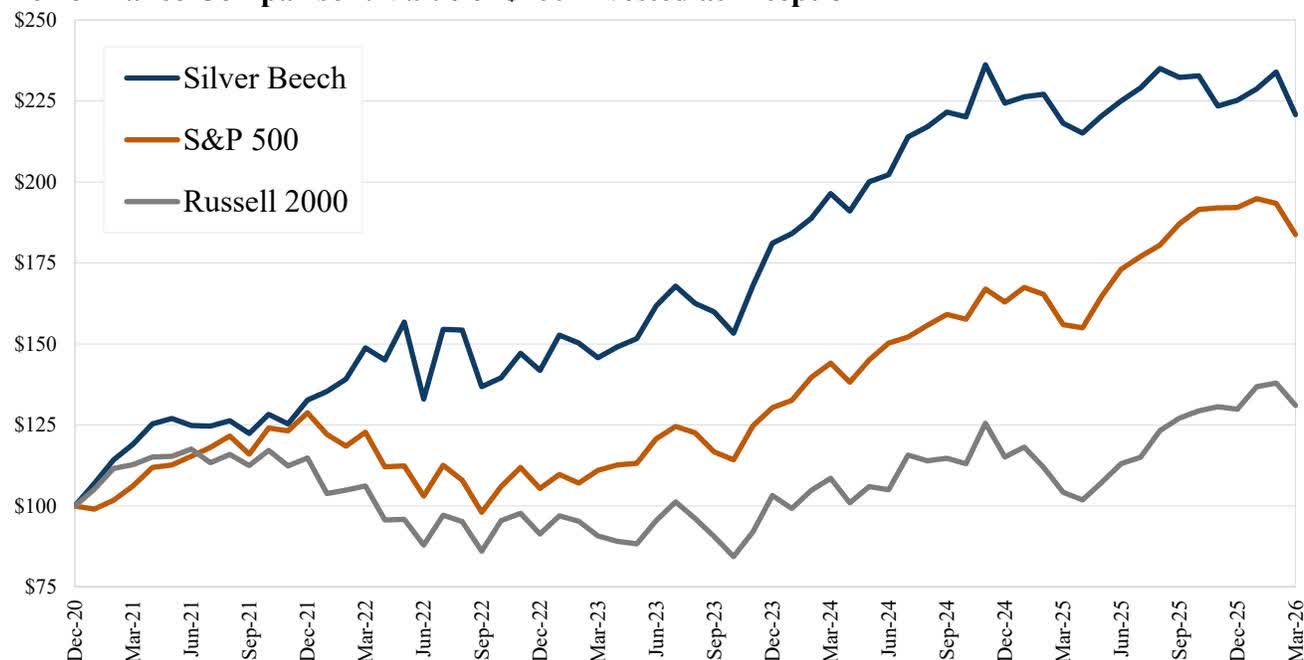
*Returns presented above for Silver Beech are net of 1% management fee and 20% incentive fee above a 6% hard hurdle as of March 31, 2026, and since inception (January 11, 2023). Actual performance will vary depending on the timing of contribution(s) and fees. Returns for the S&P 500 and Russell 2000 are total returns and include dividend reinvestment. 2023 returns begin January 11 to match Silver Beech’s inception. Please see additional disclosure.
Since track record inception, Silver Beech has generated 16.4% annualized returns, which equates to 4.0% annualized outperformance over the S&P 500. Through the first quarter of 2026, Silver Beech returned -2.0%, compared to the S&P 500’s -4.3% and the Russell 2000’s 0.9% year-to-date gains.
During the first quarter, the S&P 500's modest 4% decline masked sharp underlying dispersion. Two distinct themes drove this volatility: the perceived disruption of various business models by artificial intelligence (("AI")), and the abrupt disruption to global energy supply chains following the closure of the Strait of Hormuz.
Capital rotated into perceived beneficiaries and penalized industries the market deemed impaired. The repricing was stark: semiconductors appreciated by 28%, oil & gas exploration and production companies appreciated by 35%, and software drew down by 24%. Many equity prices have become untethered from fundamentals.
Silver Beech holds no positions in businesses we consider materially exposed to displacement by AI, and our two long-standing energy holdings, Greenfire Resources (GFR) and Energy Transfer (ET), directly benefited from the energy supply disruption. Our positions in these energy companies long predate this past quarter's events and reflect underwriting decisions based on business quality and price, not macroeconomic forecasting.
The current energy backdrop nevertheless warrants comment. Global crude prices exceed their January levels by more than 75% and inventories are drawing down at the fastest rate on record, but equity markets have thus far shrugged off both of these facts. A protracted disruption would re-accelerate inflation, sustain restrictive monetary policy, and meaningfully raise the probability of global recession. American and Canadian energy independence provides only partial insulation from an energy supply shock: consumer prices for gasoline, electricity, fertilizer, and hydrocarbon-derived inputs could rise sharply if the Strait does not reopen soon.
During the quarter, we initiated new positions amidst this volatility. Our underwriting standard is unchanged: we target undervalued companies whose success does not depend on favorable macroeconomic, geopolitical, or industry shifts that we are not positioned to forecast. Against that standard, the current opportunity set is among the more attractive we have seen.
In this quarter's letter, we have written about our new position in Apollo Global Management (APO).
In the first quarter, we initiated a large position in Apollo Global Management (("Apollo")). The market has penalized Apollo for its complexity, underappreciated the durability of its growth, and lumped it in with peers exposed to a wave of private credit anxieties from which we believe Apollo is largely insulated. The convergence of private capital and life insurance is one of the most consequential and durable themes in financial services today, and Apollo is its most structurally advantaged operator due to the pioneering combination of its asset manager and captive life insurer.
Apollo's operating model is best understood as three integrated engines:
• An alternative asset manager managing capital on behalf of Athene, third-party insurers, institutional investors, and private wealth clients across drawdown funds, perpetual capital vehicles, separately managed accounts, sidecars, and other structures.
• A fully integrated life insurer —largely Athene—that originates long-duration life and annuity liabilities, supplying captive, permanent capital.
• An origination machine producing credit assets through owned lending platforms ((corporate, real estate, asset-backed, consumer, specialty)), bilateral originations, and bank partnerships.
Each engine is a leader in its category. Apollo is a top alternative asset manager by assets under management ((“AUM”)). Athene is the largest issuer of U. S. retail annuities. And Apollo originated more than $300 billion of credit in 2025—a scale exceeded only by a handful of the largest banks. The mechanics: Athene earns spread-related earnings ((“SRE”)) on the gap between asset yields and liability costs, reinvested on its own balance sheet; the asset manager earns fee-related earnings ((“FRE”)) from its AUM, including on Athene's invested assets; and Apollo captures fees by syndicating originations it does not retain.
Apollo's credit pedigree traces back to its founders' work at Drexel Burnham Lambert, the now-defunct firm that effectively created the high-yield bond market in the 1980s. Apollo's three co-founders—Leon Black, who was head of M&A at Drexel and served as Apollo's first CEO until 2021, along with Marc Rowan, Apollo's CEO today, and Josh Harris, who both worked in Drexel's M&A group—launched the firm in 1990 in the wake of Drexel's collapse. Apollo's early focus blurred the line between credit and private equity, and its signature approach was "distressed-to-control" investing. Since inception, Apollo's private equity group has generated 24% net and 39% gross internal rates of return, the strongest track record among its peer group. ¹ That track record spans more than three decades, multiple recessions, the dotcom bubble, the 2008 financial crisis, the COVID dislocation, and a full rate cycle—an unusual demonstration of underwriting and leverage discipline through environments that humbled many investors.
Today, however, roughly 80% of Apollo's $1 trillion AUM is credit ((mostly investment grade)), anchored by Athene's balance sheet and fed by its distinctive collection of niche origination platforms. ² The same institutional muscle that produced Apollo's returns in private equity now sets investment policy at Athene, which is one reason Apollo's credit culture has been more disciplined than its peers.
Apollo's pivot into life insurance fueled its credit AUM growth from less than $30 billion in 2009 to over $750 billion today. In the aftermath of the Great Financial Crisis, Rowan saw that life insurers, burdened by capital regulation and lower interest rates, were divesting fixed annuity blocks at attractive prices. Rowan realized that these long-dated, sticky liabilities were a strong funding vehicle for illiquid credit assets with superior yield.
Apollo secured a first-mover advantage by seeding Athene as a de novo insurer in 2009 to acquire these blocks of annuities. It took competitors nearly a decade to make the same pivot towards life insurance. The compounded power of Apollo's head start is substantial: Athene surpassed $440 billion in assets by year-end 2025; peer life insurance-backed platforms started from materially smaller bases and are still building origination capacity that Apollo spent more than a decade assembling.
The durability of insurance funding underlines the case for Apollo's persistent growth. Life and annuity liabilities are long-duration and predictable, allowing insurers to capture the illiquidity premium available in private credit, infrastructure, and asset-backed finance. Unlike banks, insurers are not subject to Basel III liquidity-coverage rules, which gives them greater capacity to hold these assets. And annuity underwriting carries no catastrophe risk and requires less specialized claims infrastructure than property-and-casualty insurance. Historically, insurance capital funded major waves of American development—railroads in the 1880s, electrification in the 1920s, post-war suburban housing—and is similarly suited to help fund the next: digital infrastructure, the energy transition, and new-economy capex.
Since fully consolidating Athene in 2022, Apollo's AUM and Athene's invested assets have each grown at a ~20% compounded annual growth rate ((“CAGR”)). Nearly half of Apollo’s AUM sits on its own balance sheet at Athene. The integration is genuine, and it compounds:
• The asset manager platform originates private credit, generating attractive spreads and superior returns on equity ((“ROE”)) for Athene;
• Higher ROE allows Athene to price annuities more competitively, drawing more annuity inflows;
• Greater annuity inflows expand the AUM that the asset manager can originate against, deepening the origination machine and reinforcing scale economies.
Athene anchors the asset manager with permanent management fees, can absorb investment-grade credit tranches at scale, justifies substantial investment in origination capabilities, and has proven most adept at recycling equity capital through sidecars and reinsurance. Crucially, Apollo “eats its own cooking” at a scale and structural depth that distinguishes it from peers: Blackstone — and Apollo's peers generally — runs a different model, managing insurance assets through sub-advisory agreements rather than through consolidation. Apollo also manages over $125 billion for more than 25 third-party insurers, but we believe Athene structurally aligns the long-term performance of the credit Apollo originates to a degree that less integrated peers cannot match.
Some analysts, and Blackstone itself, may counter that Blackstone's sub-advisory model is superior: it is asset-light, generates higher reported ROEs, and avoids the regulatory drag and accounting complexity of owning an insurer. We think the market is mispricing the difference. Sub-advisory mandates, however long-dated, can be terminated or re-priced at the insurer's option, and the history of financial services offers ample precedent for counterparties switching advisors or building the capability in-house once scale justifies it. A sub-advisor negotiates from outside the capital structure; its economics are a fee, not a claim on the underlying spread, and its influence over origination, reinvestment, and asset allocation extends only as far as the next contract renewal. Apollo, by contrast, controls Athene's balance sheet directly: it sets reinvestment policy, sizes origination to the liability, and retains the spread rather than renting it. What looks like a balance-sheet drag is in fact how Apollo captures the economics that would otherwise flow to another insurer's policyholders and shareholders.
Another subtle consequence of Athene’s full integration: not all “permanent” capital is created equal. Recent redemption pressure in semi-liquid wealth vehicles reminds us that some sources of capital are only conditionally permanent. Athene's annuity liabilities, by contrast, are truly permanent, and through a full cycle, we believe the market will more fully appreciate this important distinction.
The market, in our view, has made two errors in pricing Apollo.
First, the market conflates private credit with leveraged lending. Leveraged lending comprises cash-flow loans to sponsor-backed LBOs, more than 65% of which are rated B- and below. Leveraged lending is more risky, particularly in software credits as AI-driven obsolescence concerns mount. However, Apollo's private credit business and Athene's balance sheet are predominantly investment-grade, directly originated, and asset-backed. There is a real debate occurring about the value of software credits and more speculative leveraged loans made during the zero-interest-rate policy era, and Apollo is mistakenly caught in the crossfire. Apollo's firm-wide software lending is ~2% of AUM (among the lowest in the industry), and Athene's exposure is effectively zero. Leveraged loans to sponsor-backed companies are a small minority of Apollo's AUM and origination capacity. Apollo's downside-oriented underwriting and credit DNA never aligned with riskier, high-multiple software credit. The one pocket of Apollo's concentrated software exposure is the Apollo Debt Solutions (("ADS")) BDC at approximately 12% of loans. ADS gated redemptions at 45% of requested withdrawals in Q1 2026, but it represents a small share of total firm AUM, and its software share of total loans is well below industry BDC averages of 20-30%. The episode also confirms our earlier point about conditionally permanent capital.
Second, complexity is mistaken for risk. Apollo is a more difficult company to underwrite than asset-light peers such as Blackstone, because it is fully integrated with a capital-intensive, more heavily regulated life insurance entity. We believe this surface-level complexity contributes to Apollo's undervaluation versus peers. However, Apollo's full integration with its life insurer is a structural advantage accretive to third-party AUM growth. Athene's role as Apollo's largest in-house credit buyer signals quality to outside institutional capital. Athene's balance sheet also justifies the sustained investment required to build proprietary origination platforms that no asset-light competitor could underwrite from a standing start; those platforms in turn produce more product than Athene alone can absorb, and Apollo earns additional fees by syndicating the surplus into third-party drawdown funds, SMAs, and perpetual capital vehicles. Today, Apollo's asset-light competitors cannot credibly replicate synergies across these three dynamics.
Beyond these two errors, the setup at Apollo rhymes with our historical investment in Brookfield Corporation. As we wrote in our fourth quarter 2023 investor letter, Brookfield was misunderstood along similar dimensions as Apollo is today: an asset-rich holdco discounted for complexity, non-recourse leverage that looks alarming, and negative headlines that obscure core earnings power and business quality. Brookfield's negative headlines faded, public markets came to reward the underlying quality, and Silver Beech earned a 53% gross IRR over a 16-month hold.
Beyond the points above, several additional features make Apollo an attractive investment:
• Strong balance sheet: Athene is approximately 97% investment grade, with under 0.5% of holdings in leveraged lending and the balance weighted toward collateralized real assets, low-LTV credit, and high-grade asset-backed finance. Leverage is lower than at peers, and fixed-income impairments have run below the industry average over the past decade.
• Life insurance tailwinds: Demographics, pension-risk transfer, and the ongoing migration of investment-grade credit from bank to insurance balance sheets drive durable growth on both sides of Athene's balance sheet. Each incremental liability dollar compounds Athene's book at attractive ROEs while generating permanent-capital FRE for Apollo.
• Structurally advantaged growth: The third-party asset management platform benefits from institutional consolidation toward scaled managers and from private wealth flows into alternatives. Athene's organic inflows anchor that growth and insulate Apollo from LP fundraising cycles, semi-liquid redemptions, and credit-market dislocations.
• Well-capitalized: Athene maintains 400%+ U. S. and Bermuda risk-based capital ((“RBC”)) ratios, supplemented by scaled sidecars and reinsurance vehicles. We monitor Bermuda and NAIC standards, but Athene has a meaningful cushion against evolving requirements.
• Aligned management: CEO Marc Rowan owns approximately 6% of Apollo's shares; co-founders Black and Harris remain large holders; and total insider ownership exceeds 20%. Rowan's compensation structure is unusual and instructive: a $100,000 base salary, an annual incentive targeted at $10 million tied to fund performance fees, and authority to direct philanthropic distributions from Apollo's $200 million donor-advised fund during his five-year employment contract. Rowan's annual compensation is less than 1% of his equity stake: he is overwhelmingly incentivized to compound the firm's value rather than extract it. That alignment matters because Apollo retains a meaningful share of the credit it originates on its own balance sheet.
We are focused on three primary risks. First, Bermuda and NAIC capital reform: regulators are reviewing capital treatment for insurance-backed alternative managers, and a tightening could compress Athene's RBC cushion and spread economics. Second, credit-cycle risk: while Apollo's underwriting is high-quality, the firm is not immune to a generalized private-credit downturn, and impairments on Athene's portfolio would degrade consolidated earnings. Third, peer convergence: KKR/Global Atlantic, Blackstone's life insurance partnerships, and Brookfield/American Equity have all narrowed the structural gap with Apollo/Athene since 2021, and this moat may be narrower in 2030, which could drive both fee and spread compression beyond our base case underwriting.
Over the past 10 years, Apollo has grown its fee-generating AUM at an 18% CAGR, earned average returns on equity of approximately 30%, and produced 29% compounded shareholder returns. Other listed peers (Blackstone, KKR, Ares, Brookfield) have done well too. The next leg of Apollo's outperformance, we believe, will come from the full integration with Athene that is also the source of most of its accounting complexity—the very feature peers do not share, and the feature for which Apollo is currently being penalized.
At Apollo's quarter-end share price of approximately $111, we believe the asset management business trades at roughly 25x after-tax FRE per share ³ . This spot multiple is optically high, but is still too low for a business compounding FRE per share in the teens over the medium term and normalizing to mid-single-digit growth in the long term. In our base case, we believe Apollo is worth approximately $160 per share, more than 40% above the quarter-end price. In an upside case where strong AUM growth proves persistent, we believe the shares are worth more than $210. Apollo has ample room to grow on both sides of the balance sheet: trillions of dollars of credit are still migrating off bank balance sheets, trillions more in new-economy capital expenditures remain to be financed, and life insurance annuities remain a growing, attractive source of funds.
Apollo is high-quality, fast-growing, and asset-rich, anchored by permanent capital that can organically grow when fundraising slows. As the durability and quality of Apollo's integrated model is validated through the cycle, we expect its valuation to expand both absolutely and relative to peers.
It is a privilege to manage your capital alongside our own. Thank you for your trust — please reach out anytime to discuss our strategy or with any questions you may have.
Sincerely,
James Hollier, Partner & Portfolio Manager,
James Kovacs, Partner
Silver Beech Capital, LP
Silver Beech Capital, LP – Fund Summary as of March 31, 2026 Returns presented above for Silver Beech are net of 1% management fee and 20% incentive fee above a 6% hard hurdle since inception (January 11, 2023). Each Limited Partner's actual performance will vary depending on the timing of their contribution(s) and fees. Returns for the S&P 500 include dividend reinvestment. Please see additional disclosure. Important Disclosures All performance results presented herein refers to the performance of an unrestricted investor in the Fund since its inception. Net performance is presented net of the highest performance allocation in effect at the time (20%) above a 6% hurdle rate, the highest actual management fees (1.0%) charged at the time, and net of other expenses, and includes the reinvestment of all dividends, interest, and capital gains. Performance for investors who subscribed on different dates, or who pay different fees would necessarily be different from the performance presented herein. The rate of return is calculated on a “time weighted” rate of return basis, which minimizes the effect of cash flows on the investment performance of the Fund. All monthly performance data presented herein reflects unaudited data, unless otherwise specified, and as such its accuracy cannot be guaranteed. Past performance is not necessarily indicative of future results. All securities transactions involve substantial risk of loss. The material presented is compiled from sources thought to be reliable, including in certain instances, from outside sources, but accuracy and completeness cannot be guaranteed. Any opinions expressed herein reflect the judgment of Silver Beech and are subject to change. The information in this letter is for discussion purposes only. Nothing contained herein should be construed as an offer to sell, or a solicitation of an offer to buy or sell any security or investment strategy or a recommendation as to the advisability of investing in, purchasing or selling any security or investment strategy, which may only be made in the Fund’s confidential offering memorandum and operative documents (collectively, the “Offering Documents”). Before making an investment decision with respect to the Fund, prospective investors are advised to read the Offering Documents carefully, which contain important information, including a description of the Fund’s risks, investment program, fees, expenses, redemption and withdrawal limitations, standard of care and exculpation, etc. Prospective investors should also consult with their tax and financial advisors as well as legal counsel. The Offering Documents are the sole documents on which a potential investor is entitled to rely in evaluating an investment in the Fund. The information in this letter does not take into account the particular investment objectives, restrictions, or financial, legal or tax situation of any specific prospective investor, and an investment in the Fund may not be suitable for many prospective investors. This letter is not intended to be, nor should it be construed or used as, investment, tax or legal advice. PAST PERFORMANCE IS NOT NECESSARILY INDICATIVE OF FUTURE RESULTS.
Fund Holdings: Name Ticker Sector Description Ameriprise Financial (AMP) AMP Asset Management Diversified financial services firm offering wealth management, asset management, and annuity solutions. Apollo Global Management APO Asset Management Leading global alternative asset manager in private credit, equity, and real assets, with Athene retirement services. Arthur J. Gallagher (AJG) AJG Insurance Brokerage Global insurance brokerage and risk management firm providing commercial, retail, and reinsurance services. Energy Transfer ET Energy (MidStream) Midstream company operating natural gas, NGL, crude oil, and refined products pipelines across North America. Fairfax Financial (FRFHF) FFH Insurance (P&C) Global property/casualty insurance & reinsurance holding company with value-oriented investment portfolio. Flagship Communities (MHCUF) MHC Real Estate Manufactured housing REIT owner and operator of 88 communities across the U. S. Midwest and South. Greenfire Resources GFR Energy (E&P) Canadian oil sands producer focused on steam-assisted gravity drainage operations in Alberta's Athabasca region. S&P Global (SPGI) SPGI Financial Data Leading global provider of credit ratings, financial data, indices, benchmarks, and analytics for capital markets. Southwest Gas (SWX) SWX Utilities (Regulated) Regulated natural gas utility serving residential and commercial customers in Arizona, Nevada, and California. Victory Capital (VCTR) VCTR Asset Management Multi-boutique asset manager offering active and passive equity, fixed income, and solutions strategies to investors.
Fund Composition By Market Capitalization: Weight Large Cap (greater than $12 billion) 62.1% Mid Cap (greater than $2 billion) 18.4% Small Cap (less than $2 billion) 19.6% Total 100.0%
Monthly Net Returns (%): Jan Feb Mar Apr May Jun Jul Aug Sept Oct Nov Dec Year S&P 500 2021 6.82 6.91 4.23 5.30 1.29 -1.67 -0.14 1.29 -3.13 4.88 -2.34 5.87 32.63 28.71 2022 2.06 2.80 6.92 -2.51 8.03 -15.17 16.20 -0.13 -11.30 2.01 5.38 -3.61 6.90 -18.11 2023 7.70 -1.62 -3.01 2.33 1.70 6.65 3.78 -3.15 -1.66 -4.09 9.59 7.81 27.75 23.66 2024 1.62 2.53 4.09 -2.76 4.75 1.06 5.80 1.45 2.10 -0.69 7.32 -5.01 23.86 25.02 2025 0.86 0.35 -3.91 -1.40 2.48 2.08 1.78 2.62 -1.17 0.22 -4.00 0.79 0.40 17.88 2026 1.57 2.24 -5.61 -1.98 -4.33 Silver Beech Capital Management, LLC (“Silver Beech”) is a New York limited liability company that serves as the investment manager to Silver Beech Capital, LP (the “Fund”), a Delaware limited partnership. The principals of Silver Beech are James Hollier, who serves as the portfolio manager and managing partner of the Fund, and James Kovacs, who serves as the managing partner of the Fund.
Editor's Note: The summary bullets for this article were chosen by Seeking Alpha editors.
此内容由惯性聚合(RSS阅读器)自动聚合整理,仅供阅读参考。 原文来自 — 版权归原作者所有。