


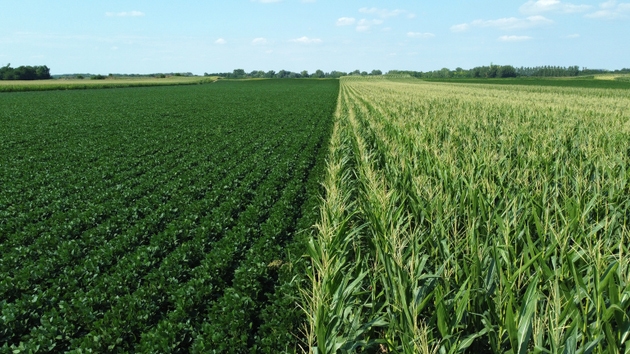
Jana Milin/iStock via Getty Images
By William McWilliams and Emily Balsamo
What is in store for this crop year? With the 2026 Acreage report to be released on June 30, 2026, the current state of the Bean/Corn ratio may provide some insight into the minds of the nation’s farmers.
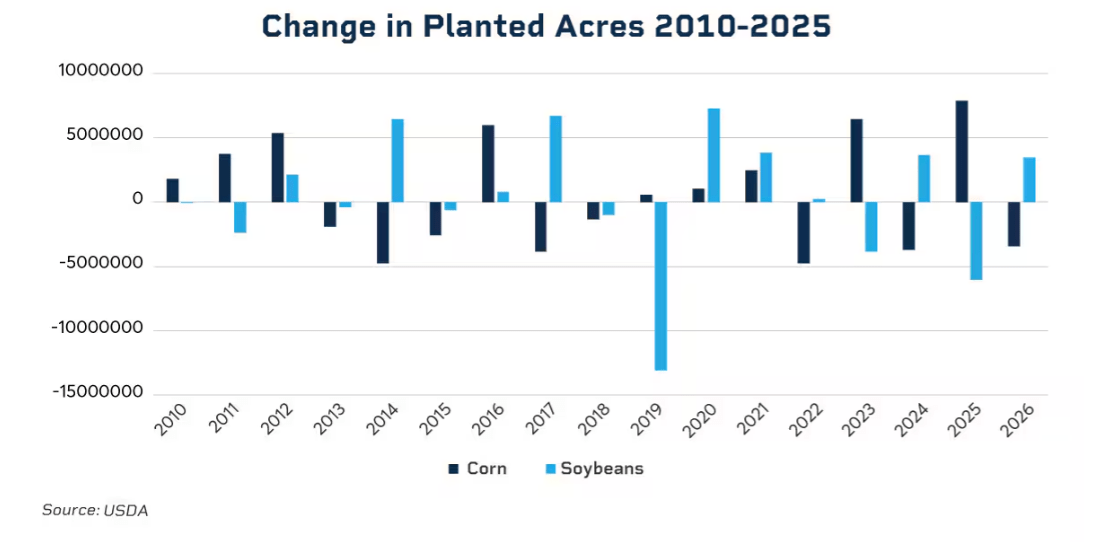
In the United States, corn and soybeans are grown in the same regions and by the same farmers, presenting producers in much of the country with the decision of how much of each to plant in the crop year. As illustrated in the below chart, there is a distinct inverse relationship between corn and soybean planting; when one crop’s acreage expands, the other frequently contracts. This trade-off is the market's mechanism for balancing supply in response to changing profitability expectations. Crop rotation is necessary to maintain soil quality and yield, but perfect annual rotation is not strictly necessary.
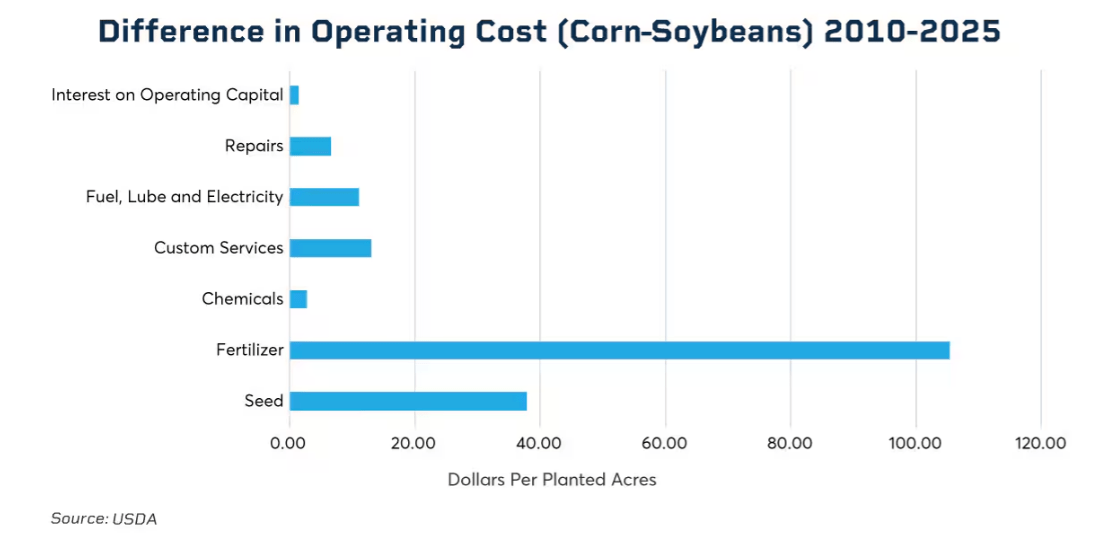
Farmers thus have a choice, year on year, of how much of which crop to plant, and profitability of each crop is often what sways farmers toward one or the other. This decision is underpinned by an inherent cost-profile disparity. Corn crops typically incur higher operational costs related to seed, nitrogen-based fertilizers and fuel, creating a higher cost-of-production threshold than that of soybeans. Thus, when input costs rise, the economic burden falls more heavily on corn, creating a natural incentive for producers to reallocate acreage toward the less input-intensive soybean, provided market pricing supports the shift.
While the core trade-off between corn and soybeans is perennial, the economic backdrop has been reshaped by structural shifts in input costs and demand-side drivers. The inflationary pressures that emerged in 2022 – driven in significant part by the Russian invasion of Ukraine, which strained fertilizer supplies and elevated fuel costs – have been further exacerbated as evolving geopolitics continue to disrupt global energy and fertilizer supply chains. Alongside these cost considerations, farmers also compare the expected future price per bushel for each crop prior to planting to maximize their profits.
The economic adage “the cure for high prices is high prices” in large part governs the soybean-corn relationship. When soybeans, for example, are priced high relative to corn, farmers will plant more soybeans in lieu of corn, driving the price of beans down with now-increased supply. The migration from corn to beans will then reduce corn supply, thus driving the price of corn up and restoring a historic price ratio between the two crops.
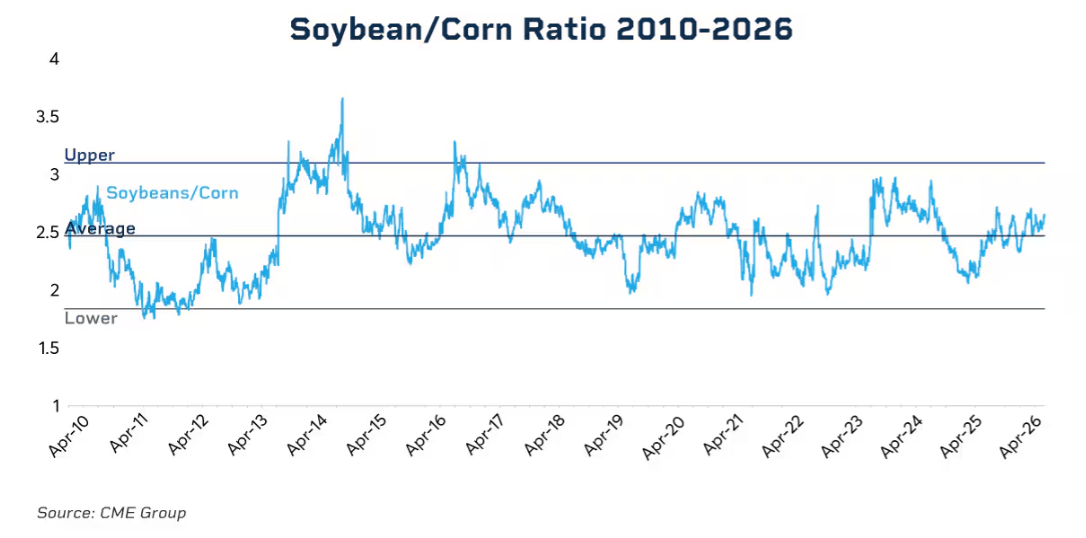
The chart below shows this relationship by taking the ratio of Soybean and Corn futures using historical front month contracts. The ratio clearly tends to revert toward a long-term average of soybeans being 2.5 times more valuable than corn. However, the inclusion of the upper and lower bands, representing two standard deviations from the average, in the chart reveals significant within-year variations that can diverge sharply from historical norms. These persistent deviations from the mean emphasize that while the ratio serves as a long-term anchor, it is an insufficient guide for managing seasonal price risk. The volatility inherent in these shifts is precisely why producers must look beyond simple historical averages when constructing their planting and marketing strategies.
With the 2026/27 planting season now underway, market participants are actively forming their own expectations regarding farmers' final acreage decisions. These projections are being shaped by recent trends in rising input costs, the current corn-to-soybean price ratio, and the broader implications for crop profitability. Against this backdrop, many are looking to the U.S. Department of Agriculture’s (USDA) planted acreage estimates as a benchmark to evaluate their own internal forecasts.
The March 2026 USDA Prospective Plantings report provided the first new-crop acreage estimates, with corn and soybeans predicted at 95.3 million acres (down 3% from the prior year) and 84.7 million acres (up 4% from the prior year), respectively. The USDA continues to monitor crop progress throughout the marketing year, revising estimates as needed, with the first significant revision typically occurring in the June Acreage report.
This report is historically one of the most significant USDA releases for corn and soybean futures markets, often triggering sharp volatility. If figures differ from market participants' expectations, the discrepancies between projections and final reports can necessitate rapid price adjustments.
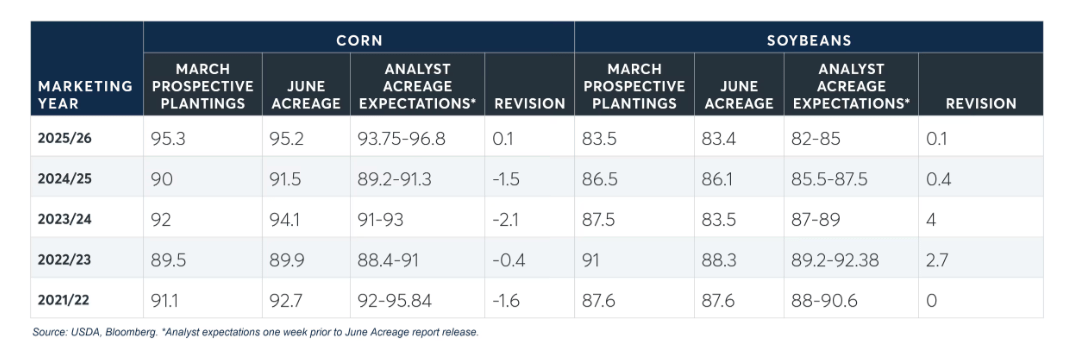
When large revisions occur, particularly when new estimates fall well outside analyst ranges, markets tend to react strongly. The 2023/24 marketing year exemplifies this dynamic. Toward the end of the prior year's harvest, the Soybean/Corn ratio was lower, signaling to farmers as they prepared for the current year's crop and inputs that a shift in acreage toward corn was economically favorable. However, analysts often miss the full scale of these shifts, failing to account for the collective tendency of farmers to "overshoot" on acres for the more profitable crop.
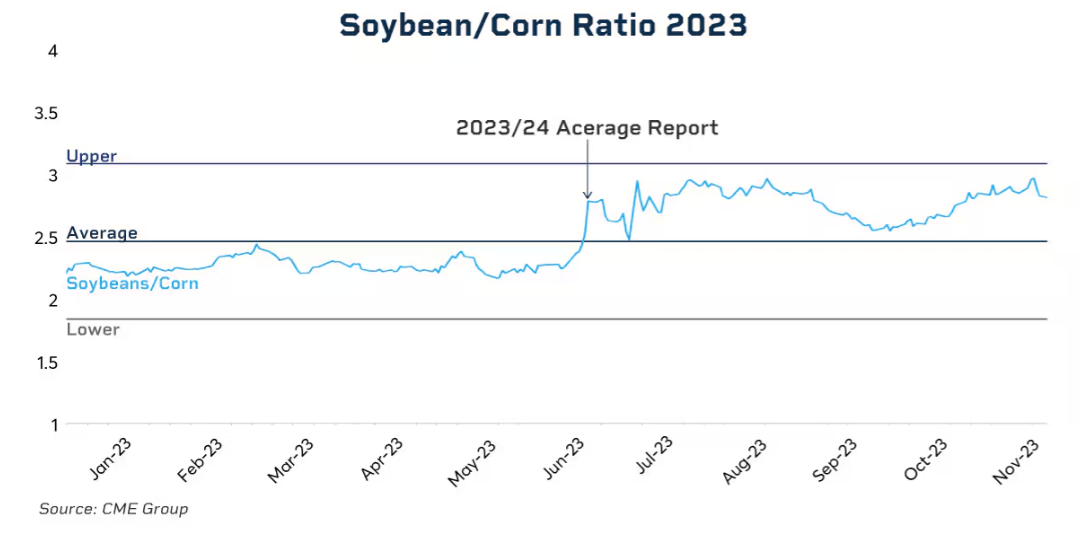
The chart below offers a closer look at this period. On the day before the report, the Soybean/Corn price ratio was 2.48 – just off the typical value. Immediately following the release, the ratio jumped to 2.8. This sharp increase reflects the market's realization that corn acreage was overestimated, which had placed downward pressure on corn prices, while soybean acreage was underestimated, placing upward pressure on soybean prices. This historical lesson remains highly relevant as market participants now look toward the upcoming Acreage report with heightened anticipation, since there’s always the potential for similar volatility should the new data challenge current assumptions.
Every spring, U.S. farmers face the question of what to plant, not just how much to plant. With corn and soybeans continually vying for dominance and the soil-nutrient needs of farmers demanding rotation, the question is not a light one and necessarily incurs risk. As this year’s planting season progresses, CME Group’s range of Agricultural Short-Term options offer one way to manage that risk.
此内容由惯性聚合(RSS阅读器)自动聚合整理,仅供阅读参考。 原文来自 — 版权归原作者所有。