












MicroStockHub/iStock via Getty Images
Chimera (CIM) Preferred A (CIM-A) has become highly opportunistic as the company reported a strong first quarter, making its fundamentals even more secure with respect to preferreds. Despite the underlying health, CIM-A has lagged in market price resulting in 16% capital gains potential on top of the 9.3% dividend yield.
We shall begin by discussing the market opportunity in mREIT preferreds and how it is even greater in CIM-A specifically. We will follow with analysis of the fundamental stability of Chimera. Our conclusion is that CIM-A offers a strong upside and yield relative to its risk level.
Sector level concept and how to trade it
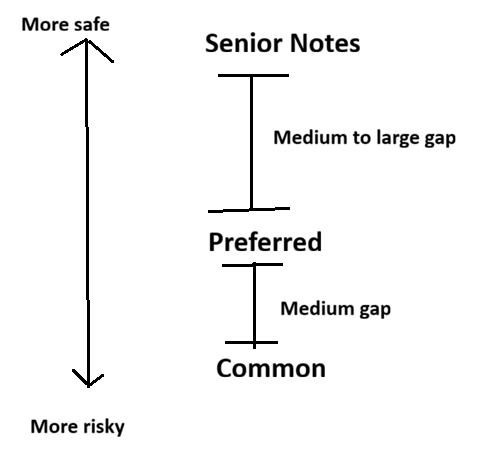
Most investors are familiar with the traditional waterfall in the capital stack: Debt is senior to preferreds, which are senior to common equity. Thus, almost by definition, the risk level of debt is lower than that of preferred, which is lower than that of common.
For the average company, the safety hierarchy is going to look like this.
2MC
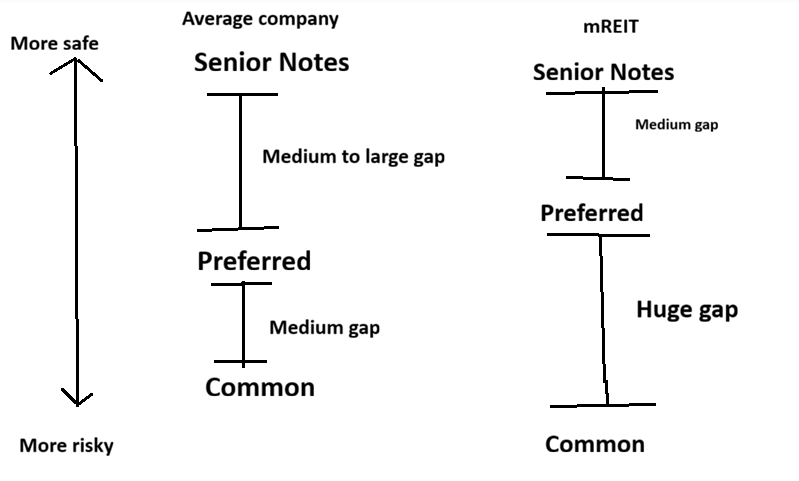
However, depending on how a company is run and how their capital stack is structured, the gaps between the tranches can vary greatly in size. Certain aspects of the way mREITs are structured and behave causes the waterfall to look more like this:
2MC
The crudely hand-drawn diagram illustrates that while common and preferred are normally somewhat close in risk level for most companies, there is a massive gap in the risk level between common and preferreds of mREITs specifically.
Why?
There are 2 specific factors that make mREIT preferreds substantially safer than their common counterparts.
The first factor is particularly true of agency backed RMBS. Market value of such instruments can fluctuate with interest rates, but since the par value is guaranteed by the government agencies, they can’t really go to zero. Losses are kept within a range and that range is small enough that losses can almost always be fully absorbed by the common while preferred and debt retain full liquidation value.
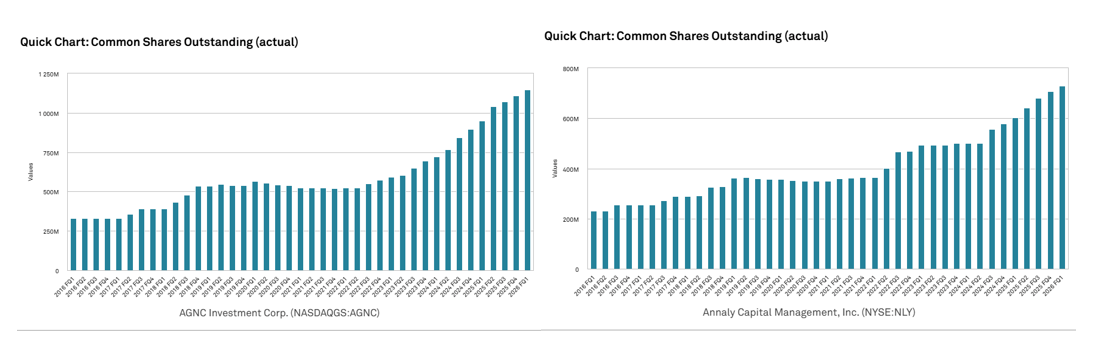
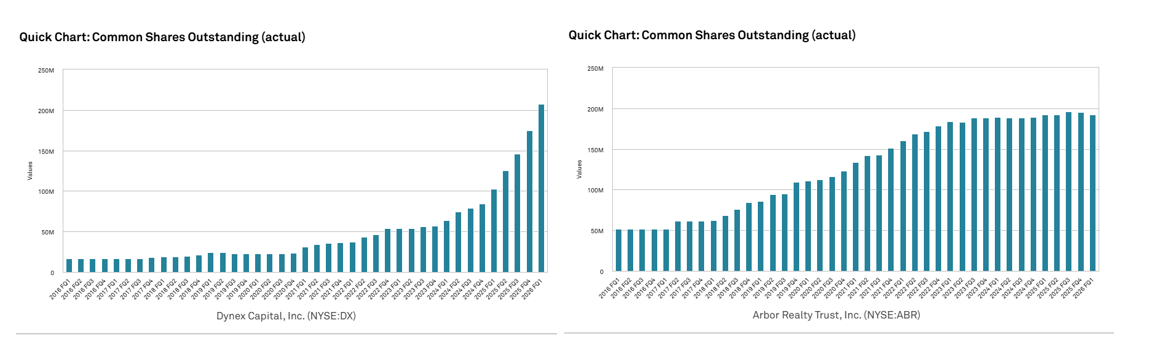
With enough losses potentially accruing over time, that common equity cushion would eventually get used up. However, mREITs continually refresh the equity cushion with seemingly non-stop equity issuance. The pattern of behavior is ubiquitous across the sector.
AGNC Investment Corp (AGNC), Annaly Capital (NLY), Dynex (DX) and Arbor Realty (ABR) have all more than tripled their sharecount in the last 10 years.
S&P Global Market Intelligence
S&P Global Market Intelligence
These are some of the biggest and best run mREITs. If you look at a junkier tier of mREITs the share issuance can be even more explosive.
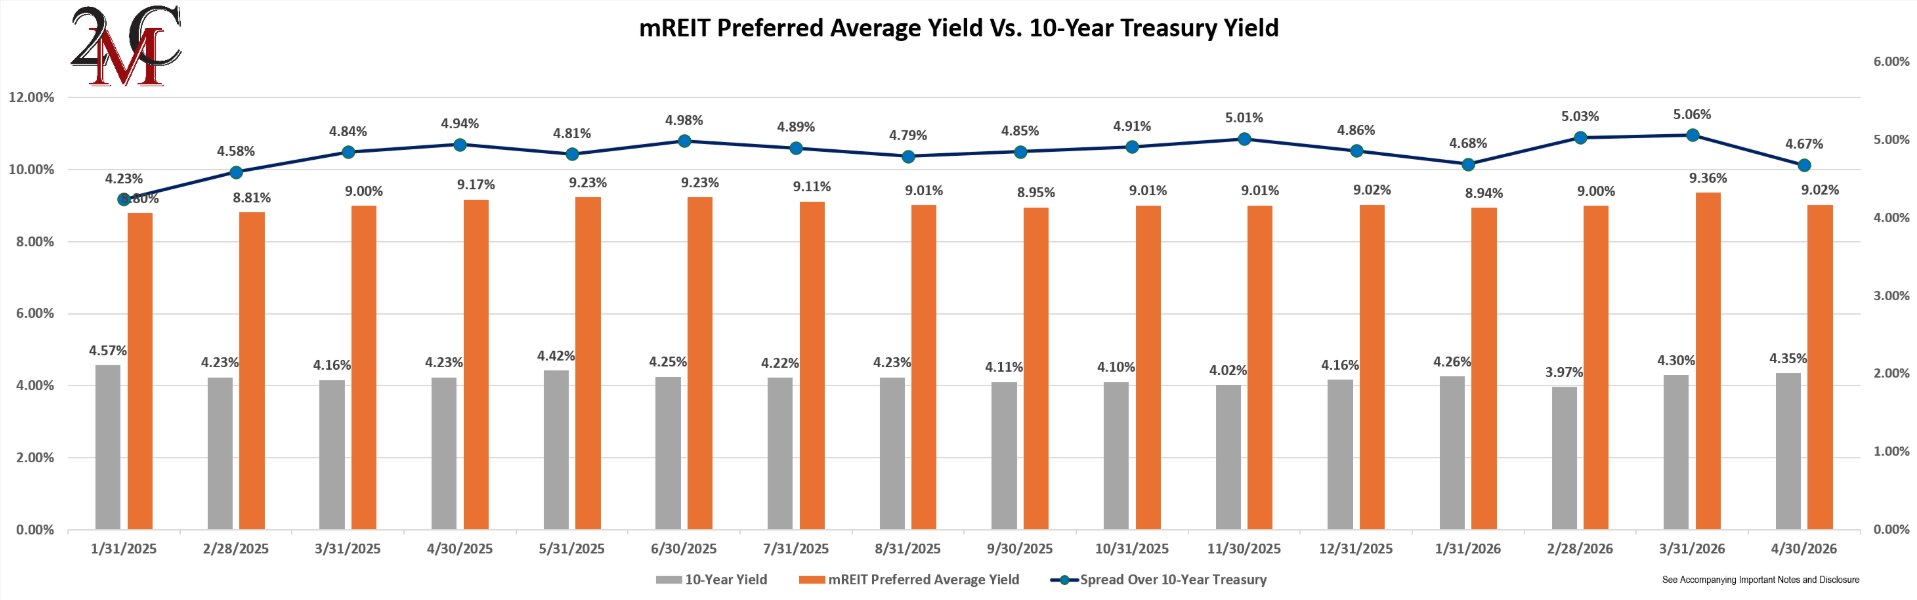
Combine the above phenomenon of mREIT preferreds being unusually safe relative to their common counterparts with the fact that mREIT preferreds trade at very high yields and the return proposition gets quite interesting. 2nd Market Capital’s mREIT Preferred Index shows the average mREIT preferred has a 9.02% yield as of the close of April, fully 467 basis points above the 10-year treasury.
2MC
We noted the superior positioning of mREIT preferreds as compared to their common counterparts back in 2022:
“I don’t really like the business from the perspective of the common equity as the net interest margin is small resulting in lackluster returns, but the stability of it is great for preferreds.”
In that article I was bullish on AGNCO, but the opportunity spanned much of the mREIT preferred universe. It played out in an interesting way over the years.
In 2022 a majority of mREIT preferreds were substantially discounted to par. We bought a fairly diversified basket and despite the underlying fundamentals being similar, the prices moved disparately. Some moved up toward par right away while others remained cheap. Each time a preferred approached par value there was an opportunity to swap into a preferred of similar risk/return profile that was still significantly below par.
It was as if the prices of the preferreds had very large noise factors such that each individual issue fluctuated seemingly randomly in a range of 15% below to 5% above its individual fair value. When looking at a spectrum of these issues, one could repeatedly sell those approximating fair value and buy those 10%-15% below fair value.
Chimera’s preferred stack is merely the latest example of this sort of noise-based fluctuation. Each of its preferreds are pari-passu, sharing essentially the exact same risk profile. As such, they should, in theory, move in unison with one another, but the real market is not efficient.
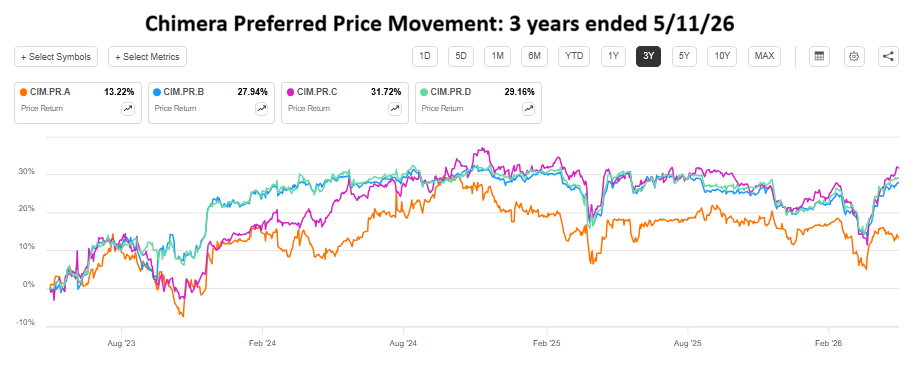
Low liquidity issues get jostled by the whims of individual buyers and sellers such that dispersion manifests where there should be uniformity. Note the divergent pricing of the CIM preferreds below:
SA
At the right-hand side of the chart you can see a huge rift open up in which CIM-A has traded far below the other preferreds from the same issuer.
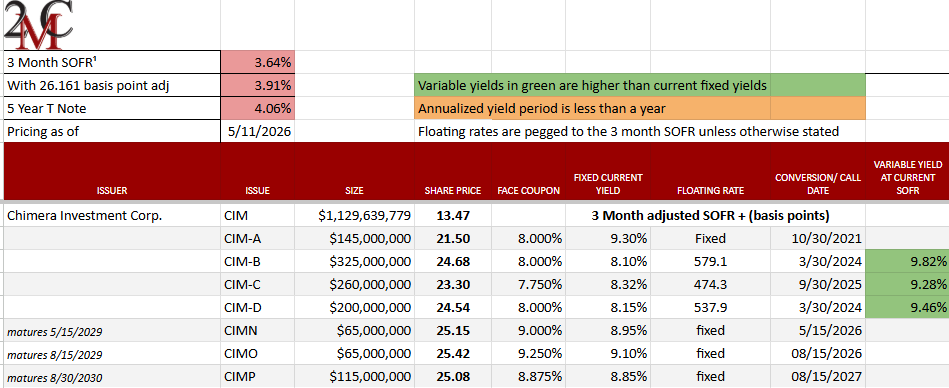
At its relatively discounted pricing it trades at a 9.3% current yield.
Portfolio Income Solutions
CIM-A is fixed rate while B, C and D are floating rate. Either fixed or floating could be advantageous depending on the direction of interest rates. At the present moment, the Fed has no clear expected path so I would consider both directions roughly equally likely. I would not pay a premium for either fixed or floating over the other type.
At current SOFR these floating rates translate to current yields of 9.82%, 9.28% and 9.46%, respectively.
At 9.3% yield, CIM-A might appear to be roughly in-line with its pari-passu peers. However, current yield is only a portion of the overall return of preferreds.
CIM-B and CIM-D which trade at yields slightly higher than that of A, each are trading very close to par. Since these issues can be redeemed by Chimera at $25 per share, their prices cannot reasonably go much over $25. Thus, these issues are limited to the strong yield as their total return with only very minor upside from capital gains.
CIM-A offers a similarly strong yield, but trades at just $21.50 so it has 16% upside to par which, in my opinion, gives it a substantially better overall expected return. The disparate pricing action afforded sale of CIM-C to buy CIM-A.
Assessing fundamental stability of Chimera
Chimera preferreds trade at higher yields than the average mREIT preferred. I suspect the main reason they are perceived as riskier is their large allocation to re-performing loans with somewhat low credit rating.
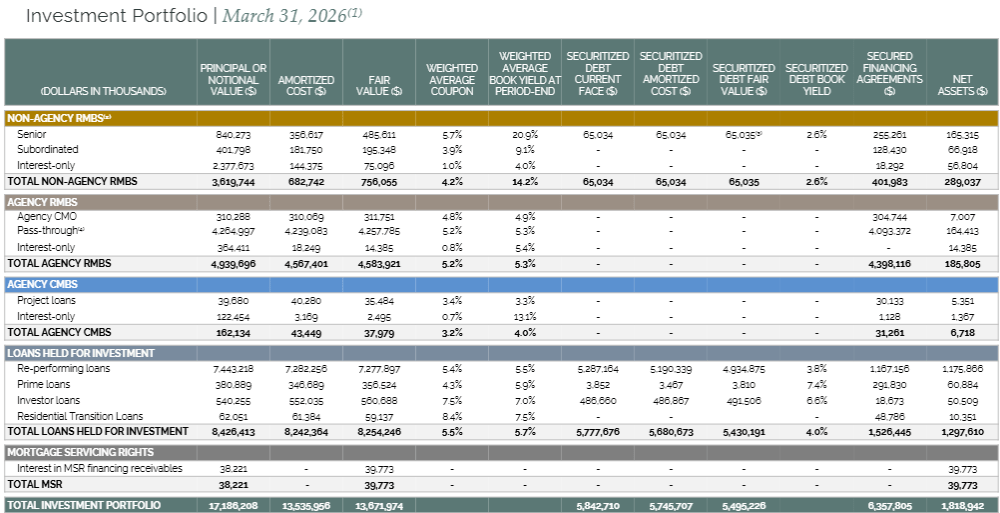
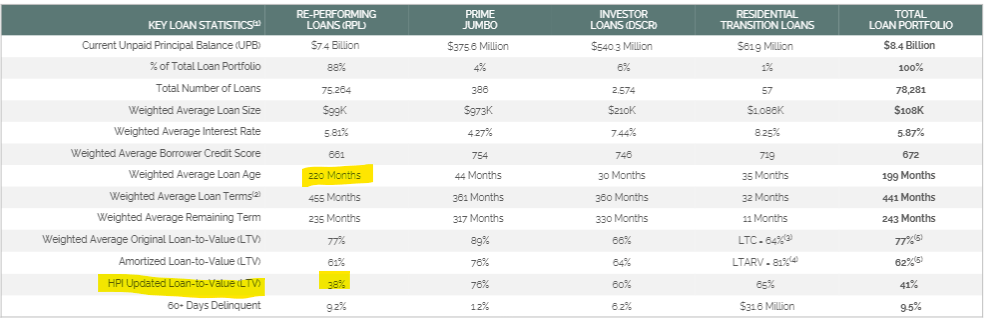
Specifically, CIM owns $7.4B of RPLs which is roughly half of their overall assets.
CIM
The rest of the assets are quite a bit safer instruments such as agency backed RMBS or even non-agency RMBS.
Data from the supplemental confirms that credit scores are lower in the RPLs and 60-day delinquency rate is fairly high at 9.2%.
CIM
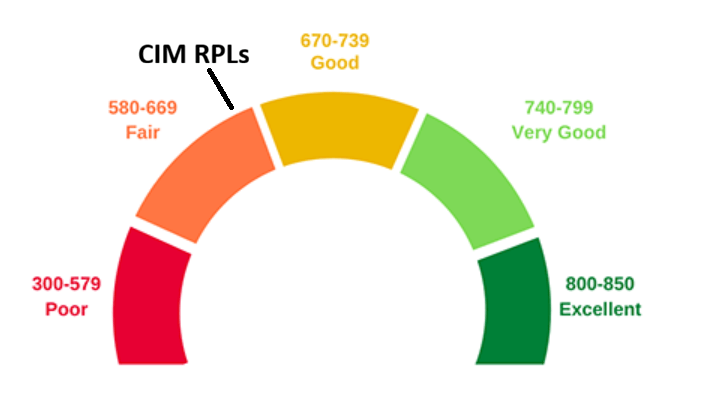
The counterparties of the RPLs have an average FICO score of 661 which is toward the lower end.
Equifax
Despite these metrics, I am not particularly worried about the RPL because of the massive overcollateralization.
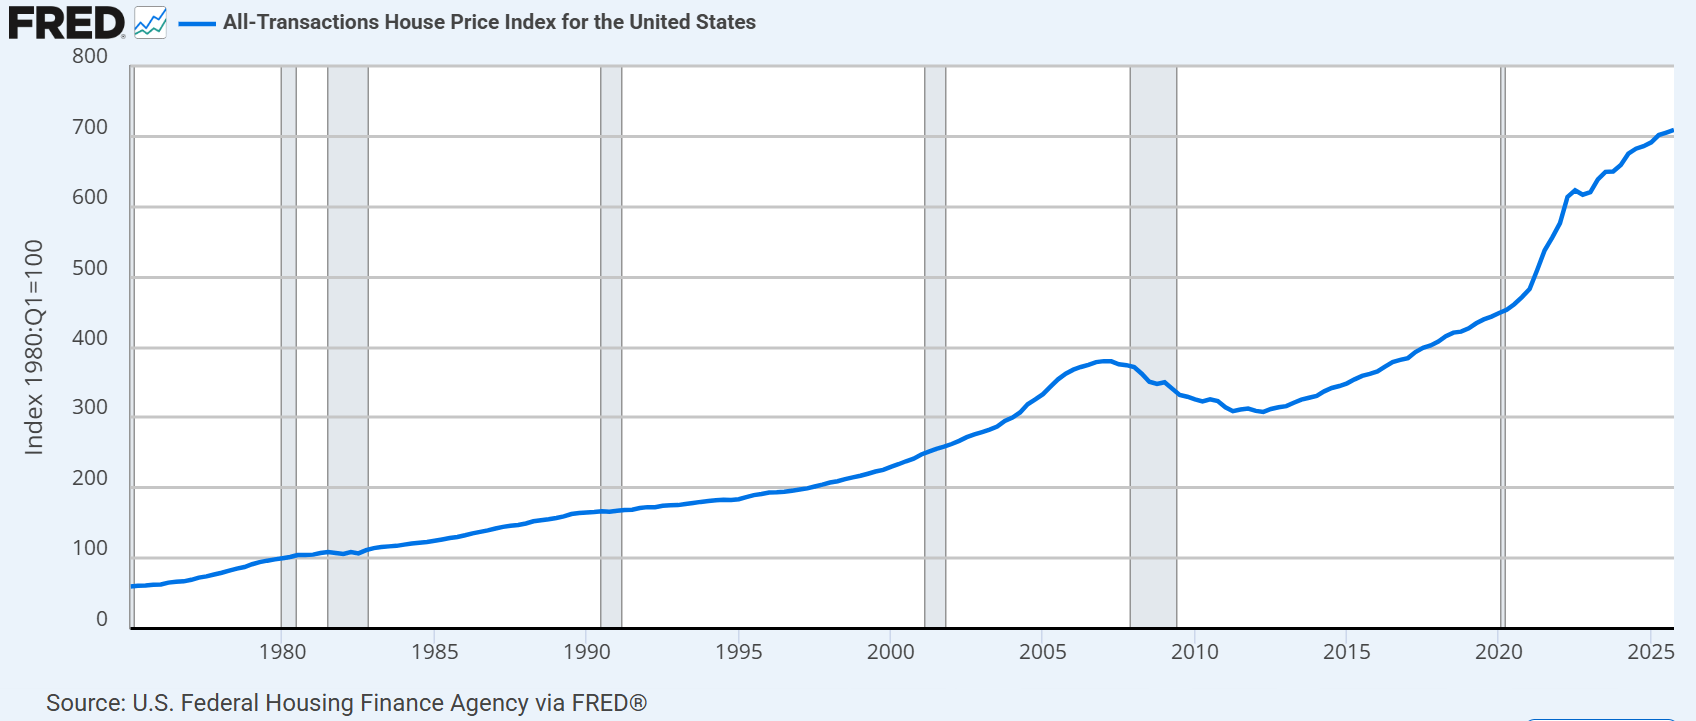
These loans were originated, on average, 220 months ago with loan-to-value ratios averaging 77%. In those 220 months, 2 things happened:
220 months ago, home prices were vastly lower.
FRED
The combination of mortgage paydown and home price appreciation means these RPLs are now sitting at 38% loan to value.
That is extraordinarily good collateral.
So if a counterparty fully defaults on a mortgage with a remaining balance of $152,000, CIM gets a $400,000 house.
It is fairly easy to sell a $400,000 house for more than $152,000. As such, I don’t view somewhat high delinquency rates as a major risk factor. The collateral is just too good.
In my opinion, this makes CIM preferreds well covered from an asset value perspective.
Cashflow coverage
CIM’s business is performing well. Chimera’s origination volume was excellent in 1Q26 despite national origination volume remaining weak due to high mortgage rates. Earnings are trending up with further growth anticipated through 2028. Below are the Wall Street consensus estimates:

S&P Global Market Intelligence
Common dividends are fully covered and CIM was one of few mREITs to actually raise the common dividend.
As a preferred investor I don’t actually like dividend raises. I would rather the company retain more cash, but raises are sometimes forced by tax reasons. As a REIT, CIM has to pay out a high percentage of its taxable earnings to maintain REIT status.
In recent quarters, CIM has increased its allocation to agency RMBS. We view this as a positive for preferreds as it is a stable asset class.
Overall risk assessment
CIM is high leverage and participates in some asset classes that are traditionally higher risk. This would normally place it in the high overall risk category which is where the market seems to be pricing the preferreds. However, I think the market is missing the collateral aspect.
Historically loan to value ratios have been much higher. 77% at origination is closer to a reasonable number and this particular time period has the added cushion caused by extreme home price appreciation. I think the market has not properly toned down its risk assessment given the overcollateralization. At a certain level of overcollateralization, default almost becomes an upside.
Adjusting for the low current LTVs, I view CIM preferreds as medium risk.
With 9.3% yield and 16% upside to par, CIM-A has outsized reward potential relative to medium risk. I think it is a strong opportunity.
Risks to investment in CIM-A
Beyond the fundamental risks we assessed above, I want to address interest rate risk.
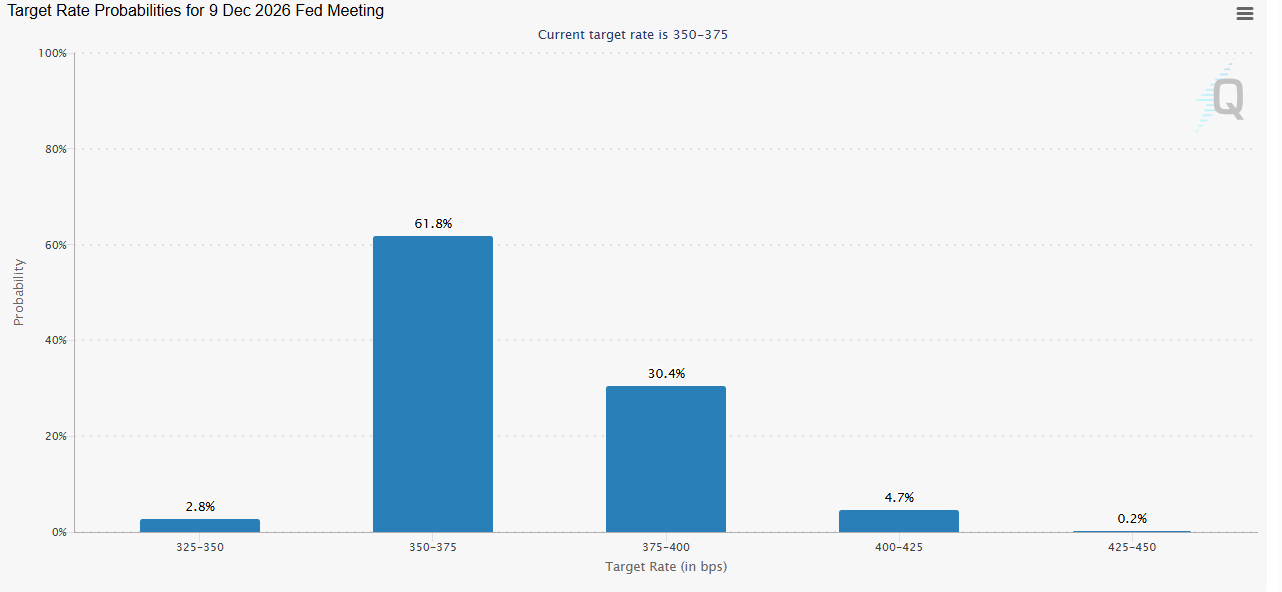
Fixed rate CIM A could underperform its floating counterparts (CIM-B, CIM-C, CIM-D) if interest rates rise materially. The high inflation numbers that came out on 5/12/26 nearly eliminated market projected chances of a rate cut in 2026 and introduced a 30% chance of 1 hike in 2026.
CME Group
Given how large the spread is between CIM-A’s yield and that of treasuries or SOFR I don’t see a 25 basis point hike as a material risk. If it starts to get closer to 100 basis points of hikes, fixed rate preferred will likely underperform.
If one is particularly concerned about hikes beyond what the market is projecting, CIM-C is the best alternative with the capital stack.
此内容由惯性聚合(RSS阅读器)自动聚合整理,仅供阅读参考。 原文来自 — 版权归原作者所有。