








AlexSecret/iStock via Getty Images
The focus of this two-part article is a very detailed analysis comparing Blackstone Secured Lending (BXSL) to some of the company’s business development company (“BDC”) peers (all sector peers I currently fully cover). I am writing this two-part article due to the continued requests that such an analysis be specifically performed on BXSL and some of the company’s BDC peers at periodic intervals. For readers who just want the summarized conclusions/results, I would suggest to scroll down to the “Conclusions Drawn” section at the bottom of each part of the article.
PART 1 of this article analyzed BXSL’s recent quarterly results and compared several of the company’s metrics to 11 BDC peers. PART 1 helps lead to a better understanding of the topics and analysis that will be discussed in PART 2.
PART 2 of this article compares BXSL’s recent dividend per share rates, yield percentages, and several other highly unique dividend sustainability metrics to 11 BDC peers. This analysis will show recent past data with supporting documentation within Table 11 below. This article will also provide BXSL’s dividend sustainability projection for calendar Q3 – Q4 2026 which is partially based on the metrics shown in Table 11 and several additional metrics shown in Table 12 below.
By analyzing these metrics, one will better understand which BDC generally has a safer dividend rate going forward versus other peers who have a higher risk for a dividend decrease or a higher probability of a dividend increase and/or a special periodic dividend being declared. This is not the only data that should be examined to initiate a position within a particular stock/sector or project future dividend per share rates. However, I believe this analysis would be a good “starting-point” to begin a discussion on the topic. At the end of this article, there will be a conclusion regarding various comparisons between BXSL and the 11 other BDC peers. In addition, I will provide my current BUY, SELL, or HOLD recommendation and price target on BXSL. Dividend projections for calendar Q3 2026 (or next set of dividend declarations) and excess taxable income balances for the other 11 BDC peers are exclusive to our Investing Group subscribers.
Side Note: As of 6/19/2026, Ares Capital Corp. (ARCC), Oaktree Specialty Lending Corp. (OCSL), FS KKR Capital Corp. (FSK), Golub Capital BDC Inc. (GBDC), SLR Investment Corp. (SLRC), Sixth Street Specialty Lending Inc. (TSLX), Capital Southwest Corp. (CSWC), and TriplePoint Venture Growth BDC Corp. (TPVG) had a stock price that “reset” lower regarding the company’s regular June 2026 monthly/quarterly dividend accrual. In other words, this company’s “ex-dividend date” has occurred. In addition, CSWC had a stock price that reset lower regarding each company’s special periodic dividend accrual. Gladstone Investment Corp. (GAIN), Main Street Capital Corp. (MAIN), Blue Owl Capital Corp. (OBDC) (formerly ORCC), and BXSL had a stock price that had not reset lower regarding each company’s regular June 2026 monthly/quarterly dividend accrual. In addition, MAIN had a stock price that had not reset lower regarding the company’s special periodic dividend accrual. Readers should take this into consideration as the analysis is presented below.
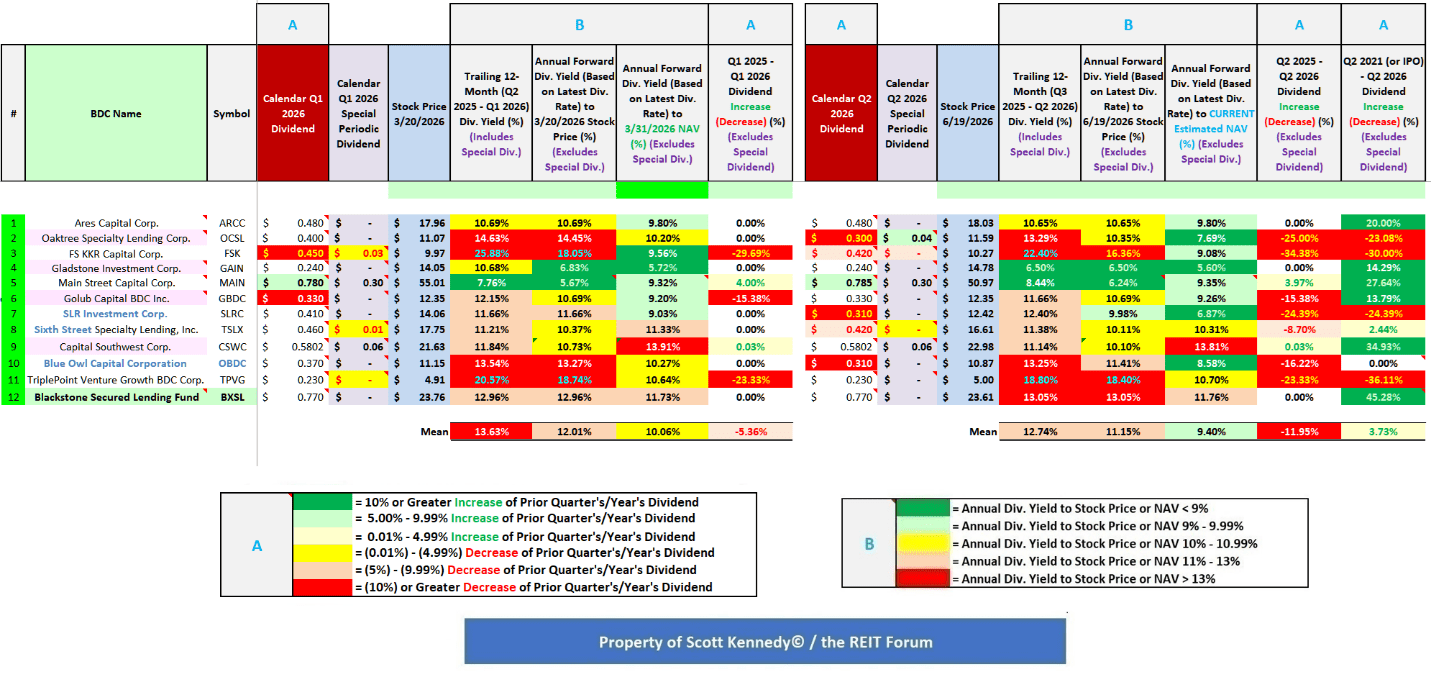
Let us start this analysis by first getting accustomed to the information provided in Table 11 below. This will be beneficial when comparing BXSL to the 11 other BDC peers regarding quarterly dividend per share rates and yield percentages.
Table 11 – Dividend Per Share Rates and Yield Percentages
The REIT Forum
(Source: Table created entirely by myself, obtaining historical stock prices from NASDAQ and each company’s dividend per share rates from the SEC’s EDGAR Database)
Using Table 11 above as a reference, the following information is presented in regards to BXSL and 11 other BDC peers (see each corresponding column): 1) dividend per share rate for calendar Q1 2026 (including any special periodic dividend); 2) stock price as of 3/20/2026; 3) trailing 12-month (“TTM”) dividend yield (dividend per share rate from calendar Q2 2025 – Q1 2026 [includes all special periodic dividends]); 4) annual forward dividend yield based on the dividend per share rate for calendar Q1 2026 using the stock price as of 3/20/2026 (for monthly dividend payers, the latest monthly dividend per share rate during the quarter); 5) annual forward dividend yield based on the dividend per share rate for calendar Q1 2026 using the NAV as of 3/31/2026 (for monthly dividend payers, the latest monthly dividend per share rate during the quarter); 6) TTM dividend increase (decrease) percentage (for monthly dividend payers, dividend per share rate fluctuation from March 2025 - March 2026); 7) dividend per share rate for calendar Q2 2026 (including any special periodic dividend); 8) stock price as of 6/19/2026; 9) TTM dividend yield (dividend per share rate from calendar Q3 2025 – Q2 2026 [includes all special periodic dividends]); 10) annual forward dividend yield based on the dividend per share rate for calendar Q2 2026 using the stock price as of 6/19/2026 (for monthly dividend payers, the latest monthly dividend per share rate during the quarter); 11) annual forward dividend yield based on the dividend per share rate for calendar Q2 2026 using my projected CURRENT NAV (NAV as of 6/19/2026; for monthly dividend payers, the latest monthly dividend per share rate during the quarter); 12) TTM dividend increase (decrease) percentage; and 13) 5-year dividend increase (decrease) percentage. Let us now begin the comparative analysis between BXSL and the 11 other BDC peers.
Using Table 11 above as a reference, BXSL declared a base dividend of $0.77 per share while not declaring a special periodic dividend for Q1 2026. BXSL’s stock price traded at $23.76 per share on 3/20/2026. When calculated, this was a TTM dividend yield (including special periodic dividends when applicable) of 12.96%, an annual forward yield (excluding special periodic dividends when applicable) to BXSL’s stock price as of 3/20/2026 of 12.96%, and an annual forward yield (excluding special periodic dividends when applicable) to the company’s NAV as of 3/31/2026 of 11.73%. When comparing each yield percentage to BXSL’s BDC peers within this analysis, the company’s TTM yield based on its stock price as of 3/20/2026 was slightly (at or greater than 0.50% but less than 1.00%) below average, its annual forward yield based on its stock price as of 3/20/2026 was slightly above average, and its annual forward yield to its NAV as of 3/31/2026 was modestly (at or greater than 1.00% but less than 2.00%) above average.
When combining this type of data with various other analytical metrics, I correctly projected BXSL had a very high (90%) probability of declaring a $0.70 - $0.77 per share dividend rate while not declaring a special periodic dividend for calendar Q2 2026 (which ultimately came to fruition).
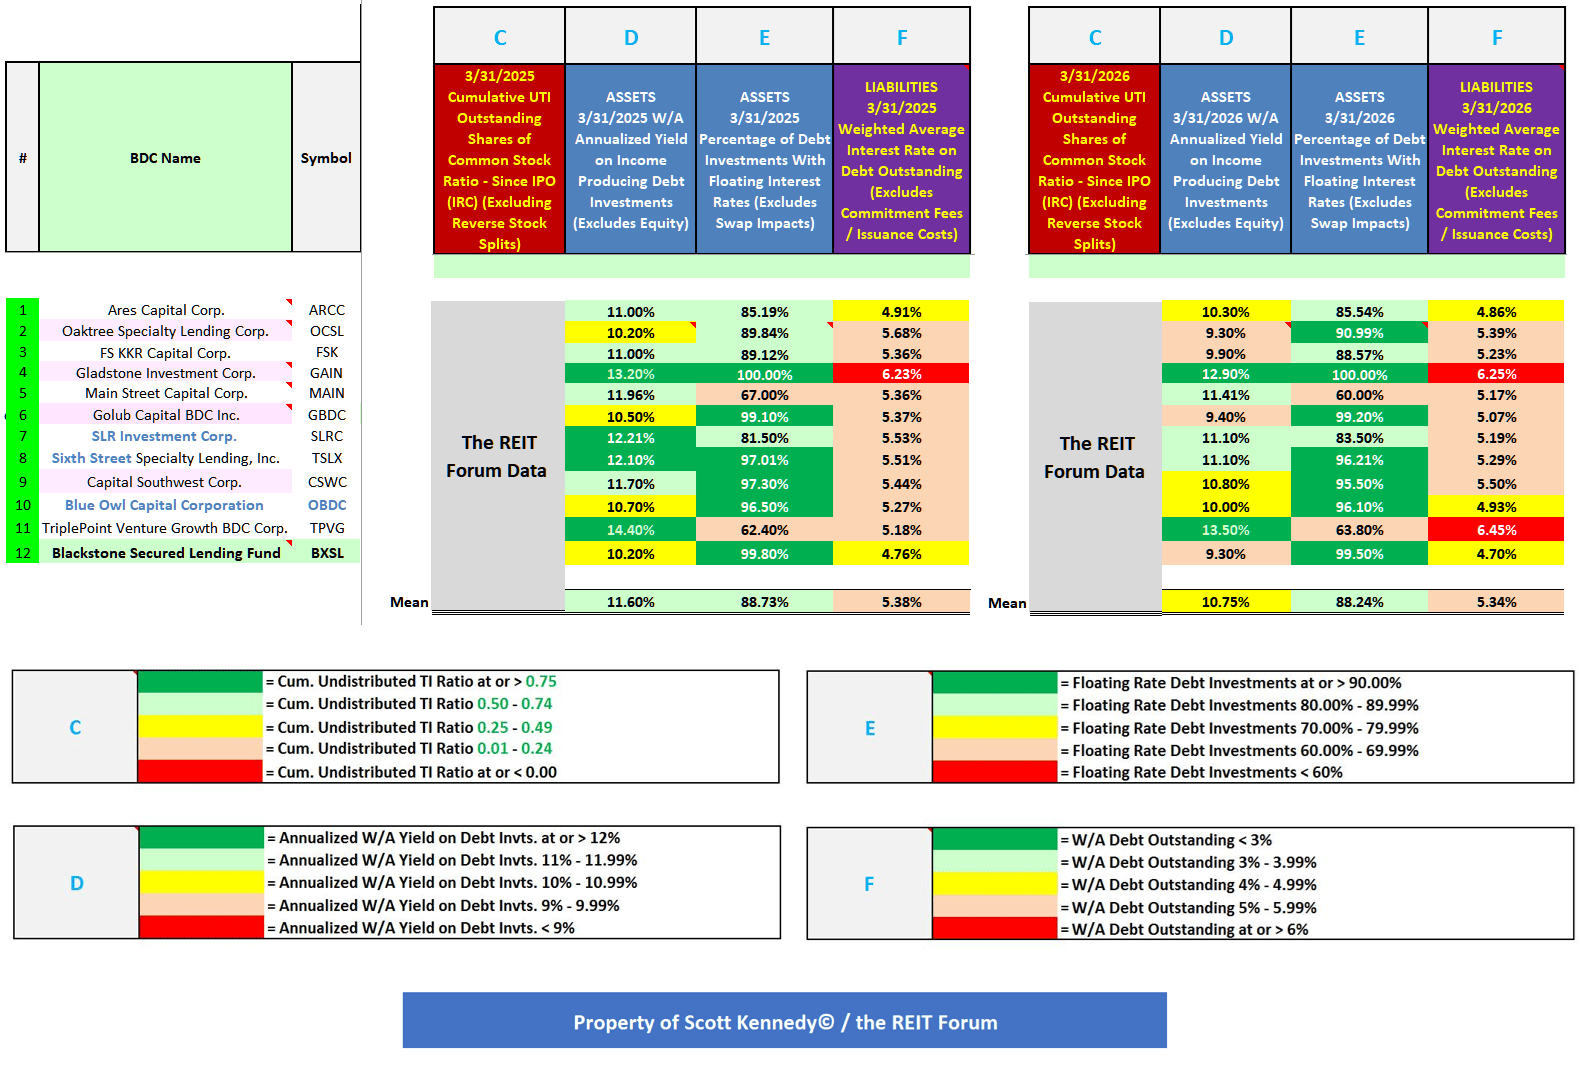
To provide readers several additional, important metrics to consider regarding each BDC’s dividend sustainability, Table 12 is provided below. Again, it should be noted there are additional dividend sustainability metrics that I perform for each company. However, those metrics are more elaborate in detail and require additional analysis/discussion which I believe is beyond the scope of this particular comparison article. That type of analysis would be better suited when analyzing each company on a “standalone” basis versus a sector comparison article. I have discussed some of these more elaborate metrics in prior ARCC, GAIN, MAIN, NEWTEK Business Services Corp. (NEWT), OCSL, Prospect Capital Corp. (PSEC), SLRC, and TSLX articles.
Table 12 – Several Additional Dividend Sustainability Metrics (3/31/2026 Versus 3/31/2025)
The REIT Forum
(Source: Table created entirely by myself, partially using data obtained from the SEC’s EDGAR Database [link provided below Table 11])
Using Table 12 above as a reference, an important metric to consider regarding a BDC’s long-term dividend sustainability is each company’s cumulative undistributable taxable income (“UTI”) outstanding shares of common stock ratio (highly valuable “forward-looking” data). Cumulative UTI is “built up”/retained net investment company taxable income (“ICTI”) in excess of previously paid dividend distributions since an entity’s initial public offering (“IPO”) or after the most recent tax year when an entity overdistributed its ICTI with no such surplus to offset the difference. This figure/metric has been covered, at length, in previous BDC dividend sustainability articles over the years. To calculate this ratio, I take a company’s cumulative UTI and divide this amount by its outstanding shares of common stock (with a caveat when it comes to past reverse stock splits; not applicable to BXSL). The higher this ratio is, the more positive the results regarding a company’s future dividend sustainability. Since most BDC peers have continued to gradually net increase their outstanding shares of common stock, this ratio shows if a company has been able to increase its cumulative UTI balance by a similar proportion.
BXSL had a cumulative UTI coverage of outstanding shares of common stock ratio of 1.80 as of 3/31/2026 (see blue reference “C”). When calculated, this was a (0.07) decrease during the TTM but an increase of 0.10 during the trailing 24 months. BXSL’s ratio as of 3/31/2025 and 3/31/2026 was notably more attractive versus the mean of 0.86 and 0.70 regarding the 12 BDC peers within this analysis, respectively. BXSL’s cumulative UTI ratio as of 3/31/2026 covers 2.33 quarters worth when based on the company’s Q2 2026 dividend rate of $0.77 per share.
I would point out BXSL has not decreased the company’s base dividend per share rate since the company’s initial public offering (“IPO”) in Q4 2021. Yes, BXSL has not reduced the company’s quarterly dividend per share rate for 5+ years (while periodically declaring minor - modest special periodic dividends during 2021 - 2022). During this time, BXSL has increased the company’s base dividend from $0.53 to $0.77 per share. This was the largest percentage increase over this time frame when compared to all other BDC covered peers. Yes, this was an even larger percentage increase when compared to both MAIN and CSWC (an impressive trend/feat). On the other end of the BDC covered peer spectrum, since Q2 2021 TPVG, FSK, SLRC, and OCSL have declared a net decrease to the company’s base dividend (excluding any current special periodic dividends when applicable) of (36%), (30%), (24%), and (23%), respectively. In comparison, BXSL has increased the company’s base quarterly dividend by 45% since its IPO in Q4 2021. I believe that is a very important point to consider.
While BXSL’s management team has continued to imply the company’s current quarterly base dividend per share rate will likely be reduced over the foreseeable future (even if the Federal (“Fed”) funds rate has no further additional cuts), I would point out its very large cumulative UTI balance as of 3/31/2026. This should limit the frequency and severity of BXSL’s said potential dividend reductions. I continue to believe the highest probability will be 1 dividend reduction this interest rate/credit cycle. Even with a very large cumulative UTI ratio, unlike a couple other BDC peers, management seems fine paying a fairly large 4% excise tax (to remain in compliance with the Internal Revenue Code (“IRC”). For example, BXSL accrued for an excise tax of $14.5 and $16.1 million during 2024 and 2025, respectively. BXSL accrued for an excise tax of $4.1 million during Q1 2026. In my professional opinion, excise tax on cumulative UTI is a “waste” of shareholder money/value (especially pertaining to companies who continue to carry a very high cumulative UTI ratio). This money/capital is not being retained by the company for future investment portfolio growth, used to pay down debt, and/or returned to shareholders either via dividend distributions or share repurchases. As such, I continue to strongly encourage management to utilize some of BXSL’s notably cumulative UTI balance PRIOR to a potential future dividend reduction; even in a decreasing interest rate/yield environment and/or rising credit risk cycle. At the very least, reduce BXSL’s cumulative UTI ratio from 1.80 to 1.50 (or even 1.25). That would still be a very large cumulative UTI balance.
That said, to remain unbiased, as noted 3 quarters ago, if there were several - a handful of Fed Funds Rate cuts over the next year or so (starting in Q4 2025), along with high yield/speculative-grade credit spreads remaining very “tight/thin” (negatively impacting effective loan origination yields), this will likely result in a BXSL dividend reduction at some point during 2026 (along with a majority of peers). We have already had 3 (25) basis point (“bp”) cuts during calendar Q4 2025.
In my opinion, another important metric to consider regarding a BDC’s dividend sustainability is a company’s weighted average annualized yield on its debt investments (asset side of the balance sheet). BXSL had a weighted average annualized yield on the company’s debt investments of 9.30% as of 3/31/2026 (see blue reference “D”). This percentage was modestly below the mean of 10.75% of the 12 BDC peers within this analysis. BXSL’s weighted average annualized yield on the company’s debt investments decreased (0.90%) during the TTM without any material change in portfolio characteristics. This has been a fairly consistent trend within the BDC sector as U.S. London Interbank Offered Rate (“LIBOR”)/Standard Overnight Financing Rate (“SOFR”)/PRIME plateaued during Q4 2023 and modestly declined during 2024 - 2025. This generalized declining trend has continued, thus far, during 2026. Eventually, yield/spread compression should “bottom out” and eventually from a “U” pattern. I believe BDC sector yields, as a whole, are very close to bottoming out. In addition, it should be noted the higher LIBOR/SOFR/PRIME rose, the more underlying credit risk (non-accruals) needs to be respected (and monitored). This will have heightened importance during 2026 –2027.
I personally do not see spreads within this specific sector getting much tighter. In fact, a gradual widening is inevitable in my professional opinion. To use an analogy, I believe there is a lot of “tension” on this particular rubber band. It cannot be “stretched” too much further (BDC spreads would not tighten too much further). There will eventually be a widening of spreads (release the rubber band’s tension). We saw this play out during early 2026 to a minor – modest extent but those trends have partially reversed course thus far during calendar Q2 2026. When spreads widen, asset pricing/valuations decrease so readers need to consider the negative impact to NAV. However, widening spreads will also eventually stop the sector-wide spread compression that has occurred over the past couple years. This will eventually be beneficial regarding NII/adjusted NII but we are not there yet. It takes time for these impacts to be felt across broader markets. These notions have already been taken into consideration when it comes to projecting dividend per share rates and recommendation ranges provided towards the end of this article (already “embedded” into all modeling through calendar Q2 2027).
The next metric shown in Table 12 is each BDC’s proportion of debt investments with floating interest rates (asset side of the balance sheet; additional forward-looking data). BXSL’s proportion of debt investments with floating interest rates was 99.50% as of 3/31/2026 (see blue reference “E”). This high floating-rate percentage was very beneficial during the prior rapid rising interest rate environment as BXSL previously quickly moved above the company’s weighted average cash LIBOR/SOFR/PRIME floor. However, more recently, lower SOFR has become a negative catalyst/trend. While several BDC peers publicly disclose this figure, the majority of companies do not. Since I/my team personally calculate/confirm each BDC’s weighted average cash LIBOR/SOFR/PRIME floor each quarter (which is typically very time consuming), I believe this is a strategic advantage to my/our service. As such, I have decided not to disclose these percentages publicly (other services could simply “poach” this valuable information with no effort). This data, when combined with the other factors/metrics presented in this article (including several other factors not publicly disclosed), is used to determine dividend sustainability probabilities later in the article and project future NII/adjusted NII per share amounts. This is 1 of the main reasons why I/we have beaten the institutional analysts’ consensus earnings average in 53 out of the past 56 quarters within the combined mREIT and BDC sectors (when tallying all fully covered sector peers).
The last metric shown in Table 12 above is each BDC’s weighted average interest rate on all debt outstanding (liability side of the balance sheet). BXSL had a weighted average interest rate of 4.70% on the company’s outstanding borrowings as of 3/31/2026 (excludes commitment fees and loan issuance costs; see blue reference “F”). This compared to a weighted average interest rate of 4.76% as of 3/31/2025. When compared to the 11 other BDC peers within this analysis, BXSL had a below average weighted average interest rate on all debt outstanding (positive catalyst/trend). This helps mitigate BXSL’s below average weighted average annualized yield discussed 3 paragraphs above.
That said, BXSL has $700 million of unsecured notes with a coupon rate of 2.75% which will be maturing on 9/16/2026. This equates to 8.7% of BXSL’s total outstanding borrowings as of 3/31/2026. As 1st noted last quarter, I projected BXSL would likely “re-roll” this debt over at a coupon of approximately 5.75% - 6.25%. So, one had to factor this then future event into forward modeling. Basically “on cue”, in May 2026 BXSL issued $650 million of 5.90% unsecured notes due May 2031. Simply put, this new issuance matched my expectations.
As of 3/31/2026, 44.28% of BXSL’s debt outstanding bore floating-rates (credit facilities and a debt securitization) while 55.72% of the company’s debt outstanding bore fixed-rates (unsecured notes). I believe taking a “snapshot” of each BDC’s weighted average interest rate on all debt outstanding allows readers to better understand which companies will experience generalized characteristics in the future (thus impacting future net investment income [NII]/TI).
Once again using Table 11 as a reference, BXSL declared a base dividend of $0.77 per share while declaring no special periodic dividend for calendar Q2 2026. This was an unchanged base and special periodic dividend when compared to the prior quarter. This was correctly projected on my end (within range).
BXSL’s stock price traded at $23.61 per share on 6/19/2026. When calculated, this was a TTM dividend yield (including special periodic dividends when applicable) of 13.05%, an annual forward yield (excluding special periodic dividends when applicable) to BXSL’s stock price as of 6/19/2026 of 13.05%, and an annual forward yield (excluding special periodic dividends when applicable) to my projected CURRENT NAV of 11.76%. When comparing each yield percentage to BXSL’s BDC peers within this analysis, the company’s TTM yield based on its stock price as of 6/19/2026 was now near (less than 0.50%) average, the company’s annual forward yield based on its stock price as of 6/19/2026 was now modestly above average, and its annual forward yield to my projected CURRENT NAV was now notably (at or greater than 2.00%) above average. These percentages remain a cautionary regarding BXSL’s dividend sustainability due to the company’s weighted average annualized yield on debt investments and weighted average interest rate on debt outstanding (amongst the other factors discussed earlier). However, as noted earlier, BXSL’s cumulative UTI provides a bit of a “buffer” regarding the number of future dividend cuts and the severity of said cut.
Investing Group Feature
A majority of BDC peers have seen a very minor – minor decrease to each company’s cumulative UTI ratio over the past year. 2 outliers were MAIN and GAIN. Regarding MAIN, this was largely due to a lack of net capital gains being generated while continuing to declare a $0.30 per share special periodic dividend over the past 4 quarters. Regarding GAIN, this was largely due to a lack of net capital gains being generated over the past year. CSWC has experienced a minor - modest increase.
This article has compared BXSL and 11 other BDC peers in regards to recent dividend per share rates, yield percentages, and several other highly detailed (and useful) dividend sustainability metrics. This article also discussed BXSL’s dividend sustainability through calendar Q4 2026. Using Table 11 above as a reference, the following were the recent dividend per share rates and yield percentages for BXSL:
BXSL: Base dividend of $0.77 per share and no special periodic dividend for calendar Q2 2026; 13.05% TTM dividend yield (when including special periodic dividends); 13.05% annual forward yield (when excluding special periodic dividends) to the company’s stock price as of 6/19/2026; and 11.76% annual forward yield (when excluding special periodic dividends) to my projected CURRENT NAV.
Since BXSL had a relatively average trailing 12-month weighted average annualized yield decrease on the company’s debt investments (assets) when compared to the sector peers within this analysis (a neutral catalyst/trend), a very large cumulative UTI balance (a positive catalyst/trend), a below average interest rate on all debt outstanding (liabilities; a positive catalyst/trend but the company has 2 more unsecured notes maturing over the next 24 months), and a slightly above average percentage of floating interest rate debt investments (becomes a negative factor/trend when LIBOR/SOFR/PRIME NOTABLY decreases [relatively unchanged fluctuations are anticipated over the foreseeable future]), I continue to believe the company should have an annual forward yield to its NAV slightly (at or above 0.50% but less than 1.00%) above the average of the 12 BDC peers within this analysis. As a reminder, BXSL’s annual forward yield to its projected CURRENT NAV was 11.76% as of 6/19/2026. In comparison, the covered BDC average was 9.40%. As such, this was now above the upper-end of this slightly above average range (a negative factor/trend).
When combining this data with various other analytical metrics not discussed within this specific article (including projected non-accrual rates during 2026 [anticipating a minor net decrease from 3/31/2026 levels by the end of the year post Medallia restructuring]; some factors were covered in PART 1), directly dependent upon management’s/the Board of Directors’ level of cautiousness during 2026,
Again, I will personally be disappointed by a near-term BXSL dividend reduction directly due to the company’s very large cumulative UTI balance (which directly leads to a larger excise tax which is “wasteful spending”) but I continue to accept a cut of up to (10%) during 2026.
Looking back to prior dividend projections, more recently this analysis correctly identified the growing probability a majority of sector peers would report an increase in monthly/quarterly dividends and various special periodic dividends during 2022 – Q3 2025. It also correctly “spotted”/identified certain BDC peers who had a growing probability of a dividend reduction during 2025 - 2026 (most recently OCSL, FSK, SLRC, and OBDC). I am currently projecting a couple more BDC peers will be reporting a dividend reduction during calendar Q3 – Q4 2026 (provided on the subscriber side of the service).
From the analysis provided above, including additional factors not discussed within this article, I currently rate BXSL as a SELL when I believe the company’s stock price is trading at or greater than a 17.5% premium to my projected CURRENT NAV (NAV as of 6/19/2026; $26.20 per share), a HOLD when trading at less than a 17.5% premium but greater than a 7.5% premium to my projected CURRENT NAV, and a BUY when trading at or less than a 7.5% premium to my projected CURRENT NAV.
Therefore, with a closing price of $23.22 per common share as of 6/22/2026, I currently rate BXSL as NOTABLY UNDERVALUED from a stock price perspective.
My current price target for BXSL is approximately $30.80 per share. This is currently the price where my recommendation would change to a SELL. The current price where my BUY recommendation would change to a HOLD is approximately $28.15 per share. Put another way, the following are my CURRENT BUY, SELL, or HOLD per share recommendation ranges for BXSL (our Investing Group subscribers get this type of data on all 12 BDC (and 18 mortgage real estate investment trust [mREIT]) stocks I currently cover on a weekly basis):
$30.80 per share or above = SELL (Overvalued)
$28.16 - $30.79 per share = HOLD (Appropriately Valued)
$25.56 - $28.15 per share = BUY (Undervalued)
$25.55 per share or below = STRONG BUY (Notably Undervalued)
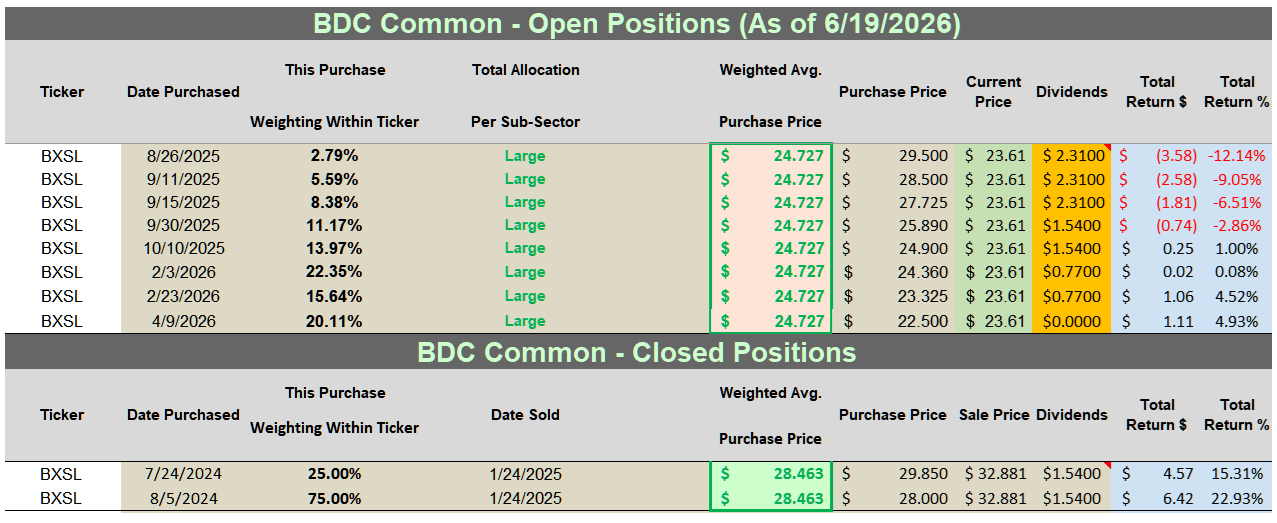
The following are my BXSL past and current stock disclosures and total returns since I have been writing on Seeking Alpha (since 2013):
Table 18 – BXSL Past + Current Stock Disclosures/Returns
The REIT Forum
Source: Taken Directly from the REIT Forum’s © Spreadsheets/Data
Final Note: All trades/investments I have performed over the past 10+ years have been disclosed to readers in “real time” (that day at the latest) via Seeking Alpha and, more recently, the “live chat” feature of our Investing Group (which cannot be changed/altered). Beginning in January 2020, I transitioned all my real-time purchase and sale disclosures solely to subscribers of the REIT Forum. All applicable public articles will still have my “main ticker” purchase and sale disclosures (just not real-time alerts). At the end of May 2026, I had an unrealized/realized gain “success rate” of 88.6% and a total return (includes dividends received) success rate of 95.5% out of 88 total past and present mREIT and BDC positions (updated monthly; multiple purchases/sales in one stock count as one overall position until fully closed out). I encourage other Seeking Alpha contributors to provide real time buy and sell updates for their readers/subscribers which would ultimately lead to greater transparency/credibility.
Simply put, a contributor’s/team’s recommendation track record should “count for something” and should always be considered when it comes to credibility/successful investing.
The basic "premise" around my/our recommendations in the mREIT common and BDC sectors is value. Regarding operational performance over the long-term, there are above average, average, and below average mREIT and BDC stocks. That said, better-performing mREIT and BDC peers can be expensive to own, as well as being cheap. Just because a well-performing stock outperforms the company’s sector peers over the long-term, this does not mean this stock should be owned at any price. As with any stock, there is a price range where the valuation is cheap, a price where the valuation is expensive, and a price where the valuation is appropriate. The same holds true with all mREIT common and BDC peers. As such, regarding my/our investing methodology, each mREIT common and BDC peer has their own unique BUY, SELL, or HOLD recommendation range (relative to estimated CURRENT BV/NAV). The better-performing mREITs and BDCs typically have a recommendation range at a premium to BV/NAV (varying percentages based on overall outperformance) and vice versa with the average/underperforming mREITs and BDCs (typically at a discount to estimated CURRENT BV/NAV).
Each company’s recommendation range is "pegged" to estimated CURRENT BV/NAV because this way subscribers/readers can track when each mREIT and BDC peer moves within the assigned recommendation ranges (daily if desired). That said, the underlying reasoning why I place each mREIT and BDC recommendation range at a different premium or (discount) to estimated CURRENT BV/NAV is based on roughly 15-20 catalysts which include both macroeconomic catalysts/factors and company-specific catalysts/factors (both positive and negative). This investing strategy is not for all market participants. For instance, not likely a “good fit” for extremely passive investors. For example, investors holding a position in a particular stock, no matter the price, for say a period of 5+ years. However, as shown throughout my articles written here at Seeking Alpha since 2013, in the vast majority of instances I have been able to enhance my personal total returns and/or minimize my personal total losses from specifically implementing this particular investing valuation methodology. I hope this provides some added clarity/understanding for new subscribers/readers regarding my valuation methodology utilized in the mREIT common and BDC sectors.
Each investor's BUY, SELL, or HOLD decision is based on one's risk tolerance, time horizon, and dividend income goals. My personal recommendation will not fit each reader’s current investing strategy. The factual information provided within this article is intended to help assist readers when it comes to investing strategies/decisions. Please disregard any minor “cosmetic” typos if/when applicable.
此内容由惯性聚合(RSS阅读器)自动聚合整理,仅供阅读参考。 原文来自 — 版权归原作者所有。