







Andrii Yalanskyi/iStock via Getty Images
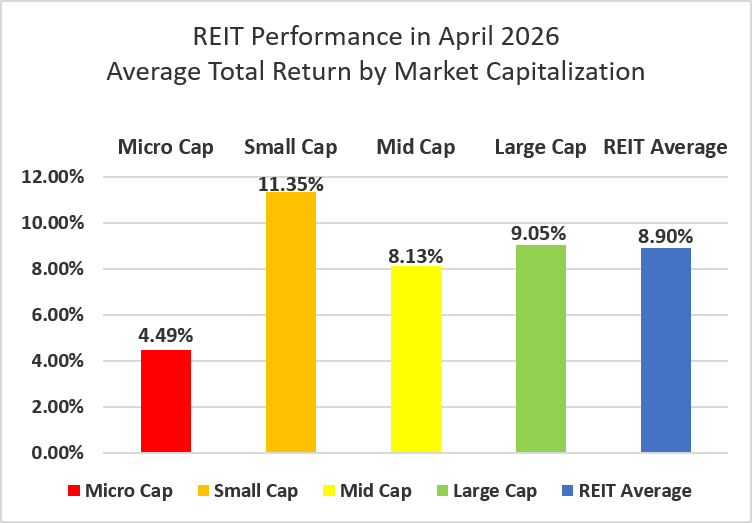
The REIT sector sharply recovered from an ugly March with a very strong 8.90% return in April. The REIT sector outpaced the Dow Jones Industrial Average (+7.2%) but fell short of the double-digit gains from the S&P 500 (+10.5%) and NASDAQ (+15.3%). The market cap weighted Vanguard Real Estate ETF (VNQ) fell slightly short of the average REIT in April (+8.60% vs. 8.90%) but has solidly outperformed year-to-date (10.03% vs. +6.31%). The spread between the 2026 FFO multiples of large-cap (17.8x) and small-cap REITs (12.1x) widened in April as multiples expanded 1.5 turns for large caps and 0.8 turns for small caps. Investors currently need to pay an average of 47.1% more for each dollar of FFO from large-cap REITs relative to small-cap REITs. In this monthly publication, I will provide REIT data on numerous metrics to help readers identify which property types and individual securities currently offer the best opportunities to achieve their investment goals.
Source: Graph by Simon Bowler of 2nd Market Capital, Data compiled from S&P Global Market Intelligence LLC. See important notes and disclosures at the end of this article
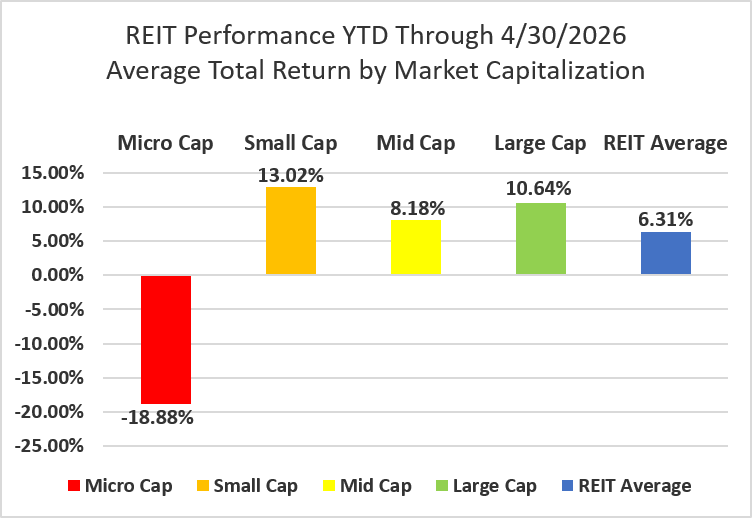
Micro-cap REITs (+4.49%) finally spent a month in the black but continued to severely underperform their larger peers. Small caps (+11.35%) led the April surge, followed by large caps (+9.05%) and mid-caps (+8.13%). During the first four months of 2026, small-cap REITs have outperformed large caps by 238 basis points.
Source: Graph by Simon Bowler of 2nd Market Capital, Data compiled from S&P Global Market Intelligence LLC. See important notes and disclosures at the end of this article
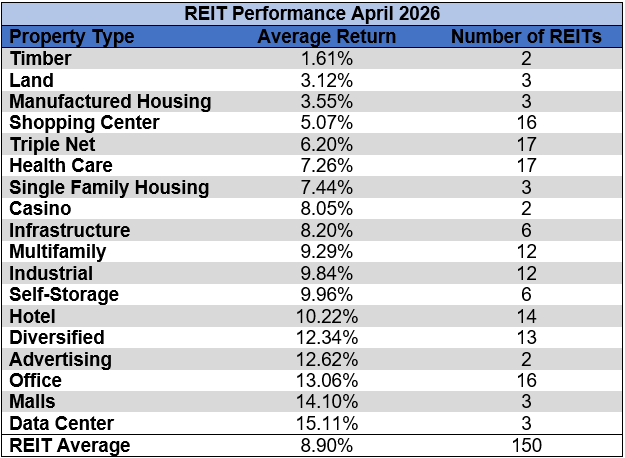
100% of REIT property types averaged a positive total return in April, with a 13.49% total return spread between the best and worst performing property types. Timber (+1.61%) and Land (+3.12%) saw the smallest gains, whereas Data Centers (+15.11%) and Malls (+14.10%) averaged strong double-digit returns in April.
Source: Table by Simon Bowler of 2nd Market Capital, Data compiled from S&P Global Market Intelligence LLC. See important notes and disclosures at the end of this article
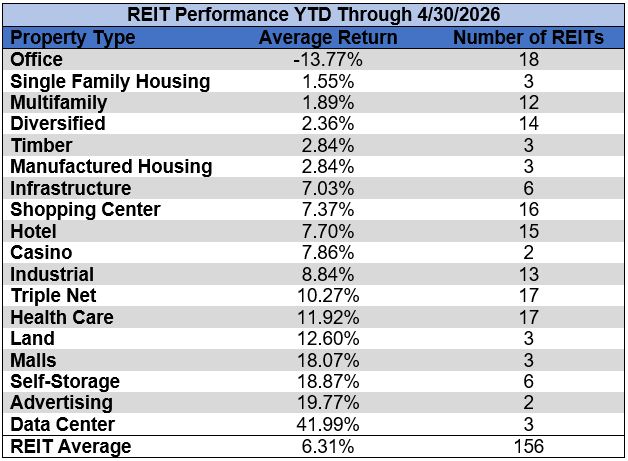
After a strong REIT recovery in April, Office (-13.77%) is the only property type in the red year-to-date. Data Centers (+41.99%) and Advertising (+19.77%) were the top performers over the first four months of the year.
Source: Table by Simon Bowler of 2nd Market Capital, Data compiled from S&P Global Market Intelligence LLC. See important notes and disclosures at the end of this article
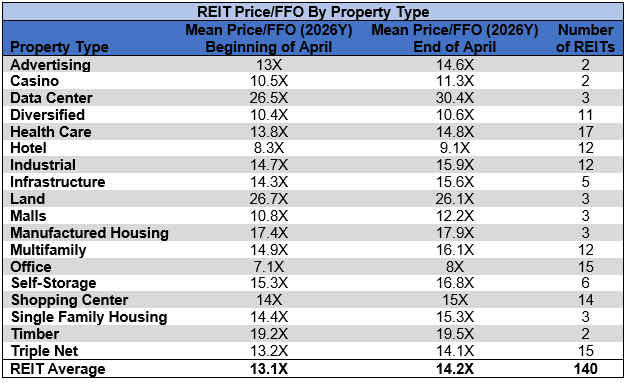
The REIT sector as a whole saw the average P/FFO (2026Y) increase from 13.1x to 14.2x during April. 94.4% of property types averaged multiple expansion and 5.6% averaged multiple contraction. Data Centers (30.4x), Land (26.1x), Timber (19.5x), and Manufactured Housing (17.9x) currently trade at the highest average multiples among REIT property types. Office (8x) and Hotels (9.1x) are the only property types that average single-digit FFO multiples.
Source: Table by Simon Bowler of 2nd Market Capital, Data compiled from S&P Global Market Intelligence LLC. See important notes and disclosures at the end of this article
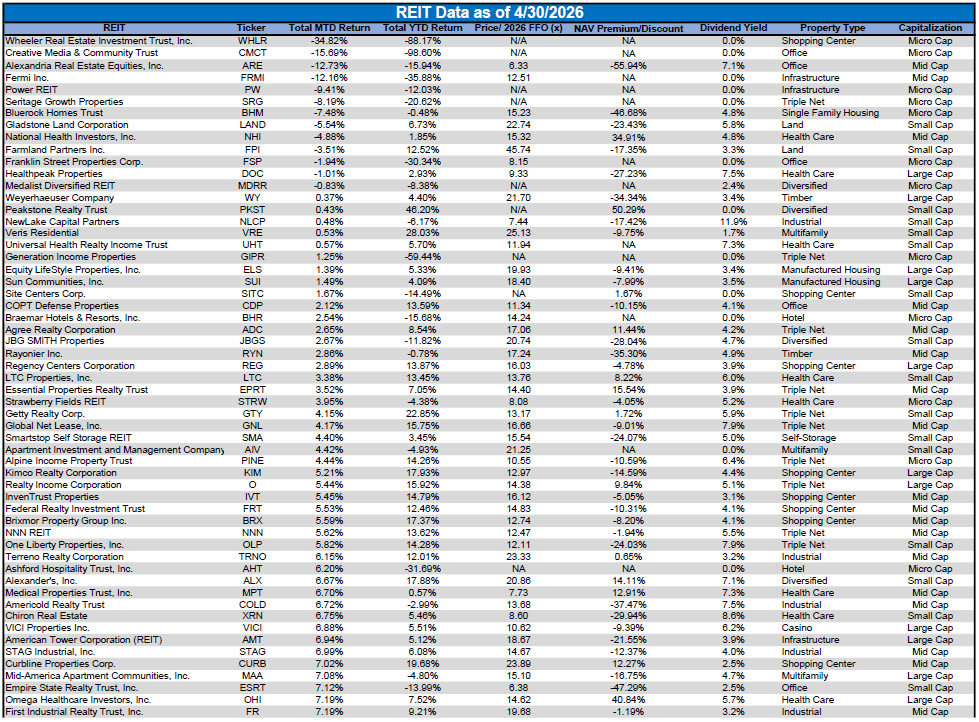
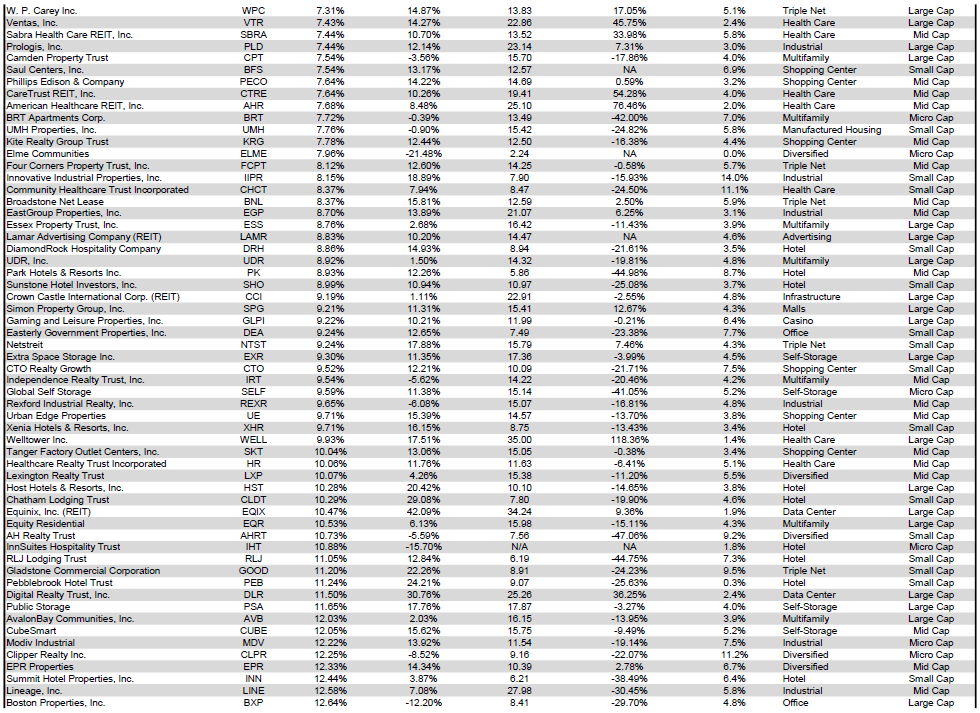
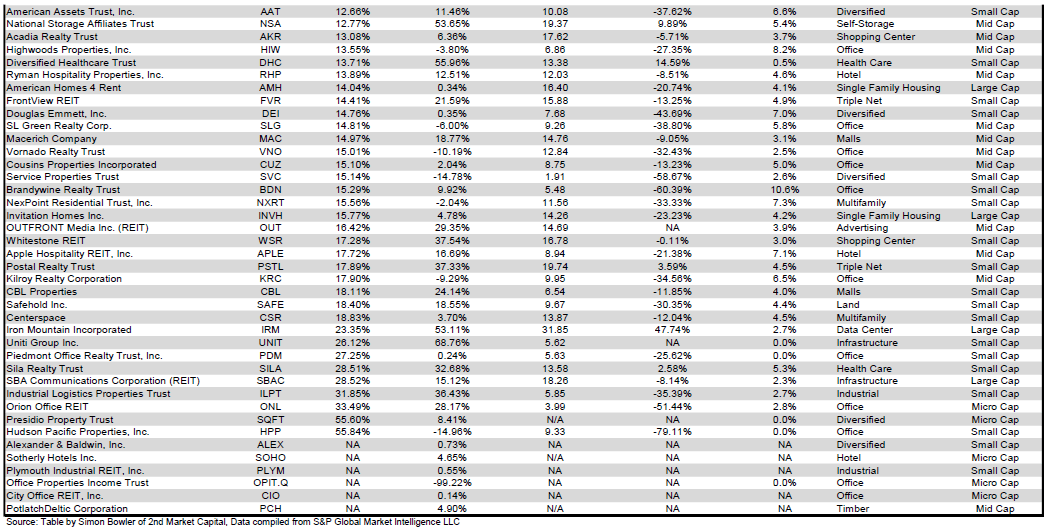
Hudson Pacific Properties (HPP) (+55.84%) was the best-performing REIT in April, narrowly edging out Presidio Property Trust (SQFT) (+55.60%). HPP benefitted from a strong month of share price recovery for Office REITs. After April's bounce back, HPP now has a negative year-to-date total return of only -14.96%.
Wheeler REIT (WHLR) (-34.82%) continued its multi-year freefall in April, spending yet another month as the worst-performing REIT. Wheeler now has the 3rd worst total return of 2026 with a year-to-date return of -88.17%.
A remarkable 91.33% of REITs had a positive total return in April. REITs have averaged a +6.31% year-to-date total return in 2026, far better than the -9.10% return for the REIT sector over the first four months of 2025.
For the convenience of reading this table in a larger font, the table below is available as a PDF as well.
Source: Table by Simon Bowler of 2nd Market Capital, Data compiled from S&P Global Market Intelligence LLC. See important notes and disclosures at the end of this article
Source: Table by Simon Bowler of 2nd Market Capital, Data compiled from S&P Global Market Intelligence LLC. See important notes and disclosures at the end of this article
Source: Table by Simon Bowler of 2nd Market Capital, Data compiled from S&P Global Market Intelligence LLC. See important notes and disclosures at the end of this article
Dividend yield is an important component of a REIT's total return. The particularly high dividend yields of the REIT sector are, for many investors, the primary reason for investment in this sector. As many REITs are currently trading at share prices well below their NAV, yields are currently quite high for many REITs within the sector. Although a particularly high yield for a REIT may sometimes reflect a disproportionately high risk, there exist opportunities in some cases to capitalize on dividend yields that are sufficiently attractive to justify the underlying risks of the investment. I have included below a table ranking equity REITs from highest dividend yield (as of 4/30/2026) to lowest dividend yield.
For the convenience of reading this table in a larger font, the table below is available as a PDF as well.
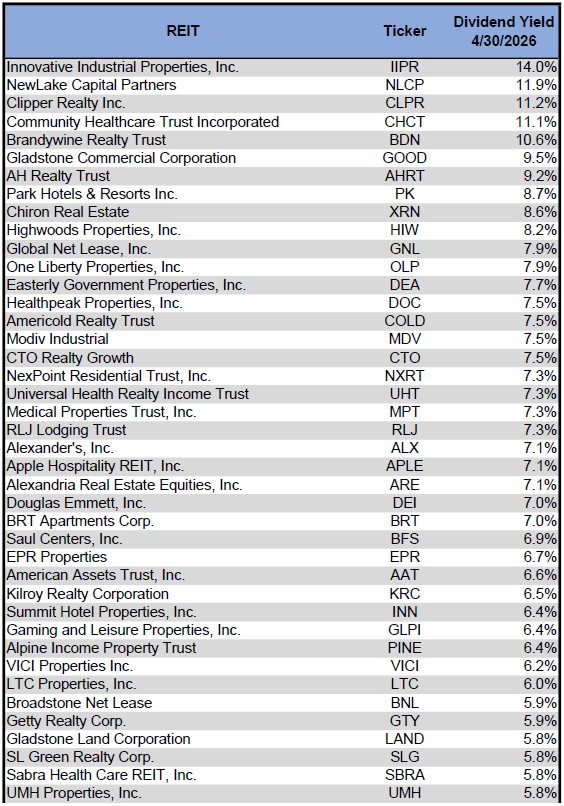
Source: Table by Simon Bowler of 2nd Market Capital, Data compiled from S&P Global Market Intelligence LLC. See important notes and disclosures at the end of this article
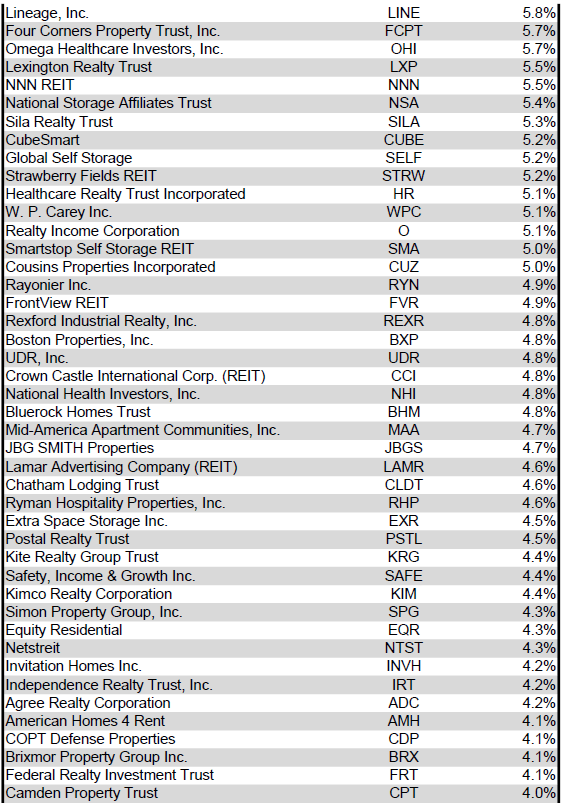
Source: Table by Simon Bowler of 2nd Market Capital, Data compiled from S&P Global Market Intelligence LLC. See important notes and disclosures at the end of this article
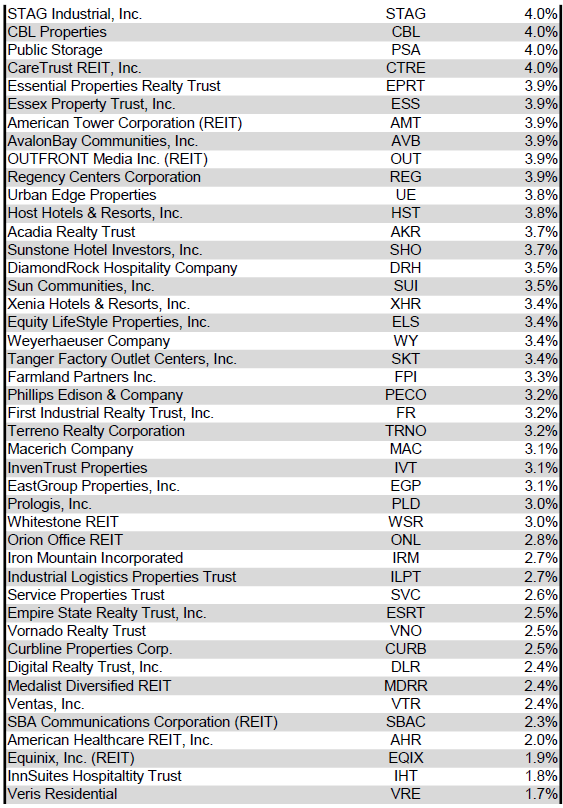
Source: Table by Simon Bowler of 2nd Market Capital, Data compiled from S&P Global Market Intelligence LLC. See important notes and disclosures at the end of this article
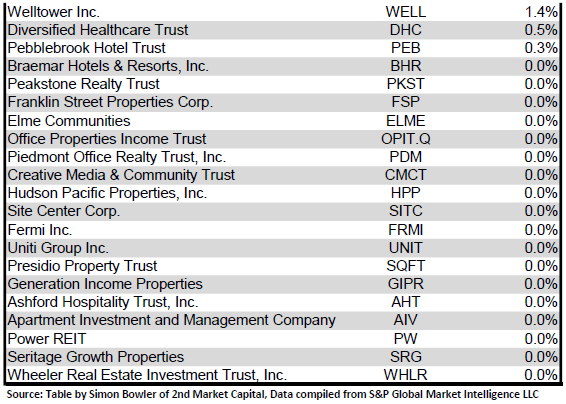
Source: Table by Simon Bowler of 2nd Market Capital, Data compiled from S&P Global Market Intelligence LLC. See important notes and disclosures at the end of this article
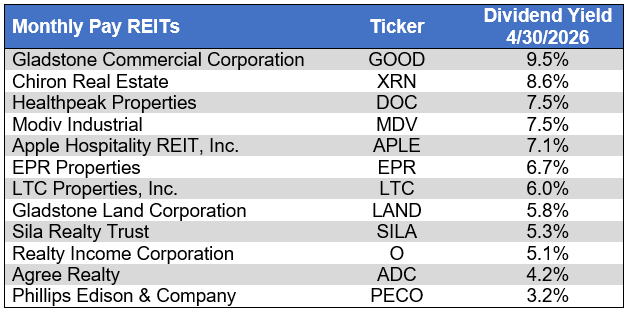
Although a REIT's decision regarding whether to pay a quarterly dividend or a monthly dividend does not reflect on the quality of the company's fundamentals or operations, a monthly dividend allows for smoother cash flow to the investor. Below is a list of equity REITs that pay monthly dividends, ranked from highest yield to lowest yield.
Source: Table by Simon Bowler of 2nd Market Capital, Data compiled from S&P Global Market Intelligence LLC. See important notes and disclosures at the end of this article
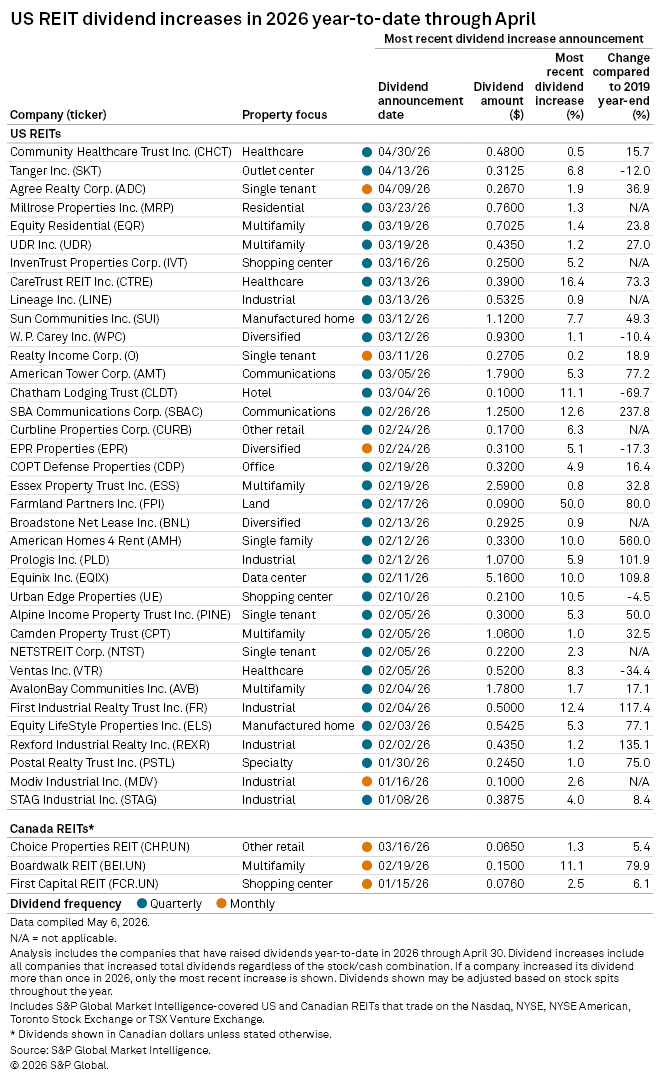
3 REITs increased their dividends in April, one of which is monthly and 2 of which are quarterly dividends. Over the first 4 months of 2026, 36 REITs have increased their dividends. The +6.8% dividend hike from Tanger (SKT) was the largest in April, followed by +1.9% from Agree Realty (ADC) and +0.5% from Community Healthcare Trust (CHCT).
Source: S&P Global Market Intelligence
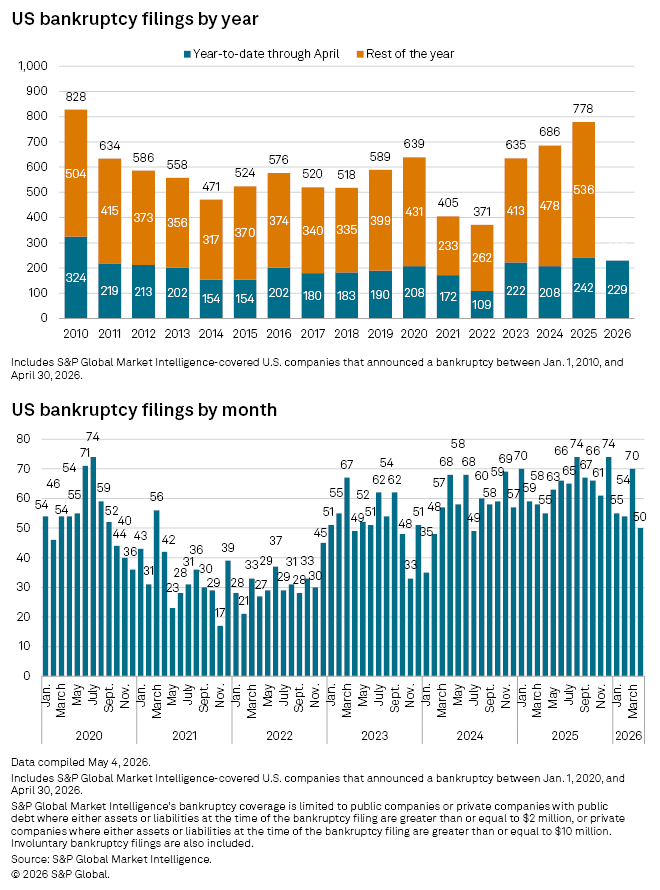
The number of corporate bankruptcies in April fell to the lowest monthly total since mid-2024, and 2026 has now seen fewer bankruptcy filings year-to-date than the first 4 months of 2025. That being said, bankruptcy filings remain elevated. There have been more 2026 bankruptcies year-to-date than in the first 4 months of any year from 2011 to 2024.
Source: S&P Global Market Intelligence
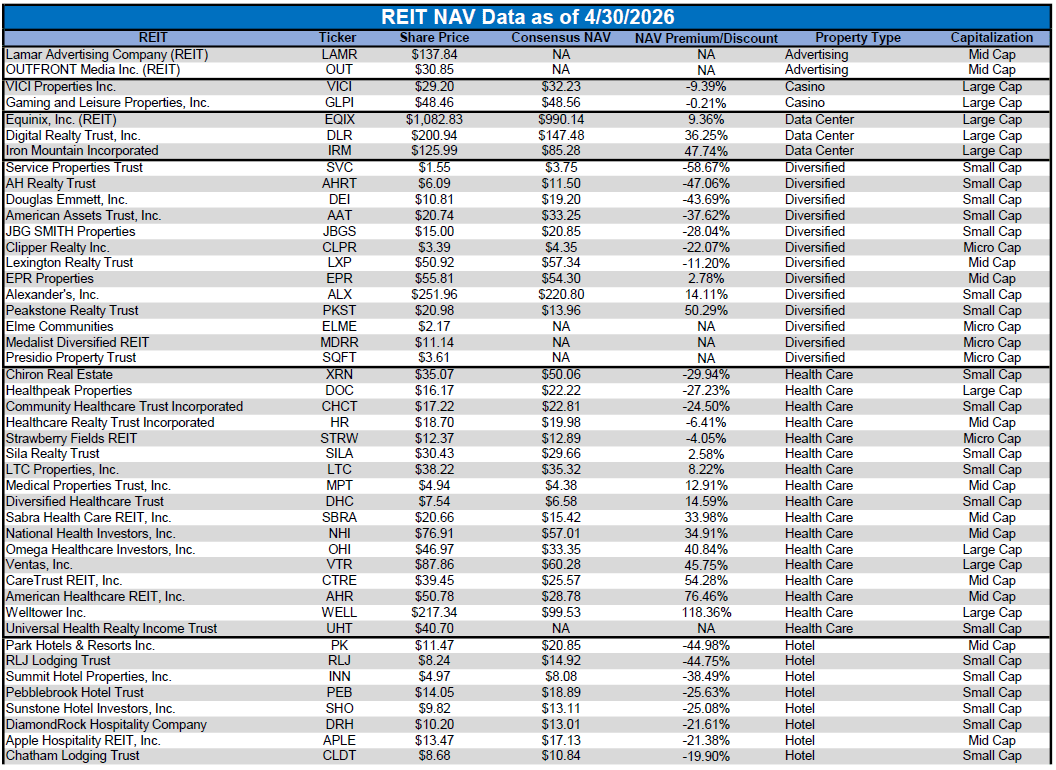
Below is a downloadable data table, which ranks REITs within each property type from the largest discount to the largest premium to NAV. The consensus NAV used for this table is the average of analyst NAV estimates for each REIT. Both the NAV and the share price will change over time, so I will continue to include this table in upcoming issues of The State of REITs with updated consensus NAV estimates for each REIT for which such an estimate is available.
For the convenience of reading this table in a larger font, the table below is available as a PDF as well.
Source: Table by Simon Bowler of 2nd Market Capital, Data compiled from S&P Global Market Intelligence LLC. See important notes and disclosures at the end of this article
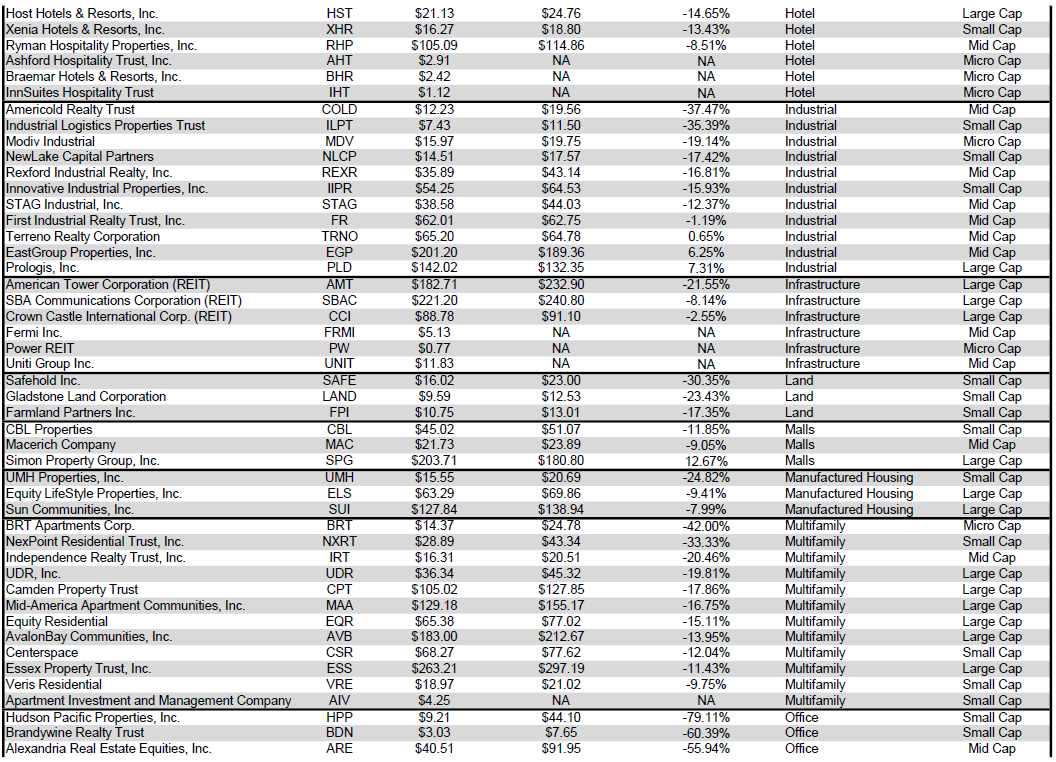
Source: Table by Simon Bowler of 2nd Market Capital, Data compiled from S&P Global Market Intelligence LLC. See important notes and disclosures at the end of this article
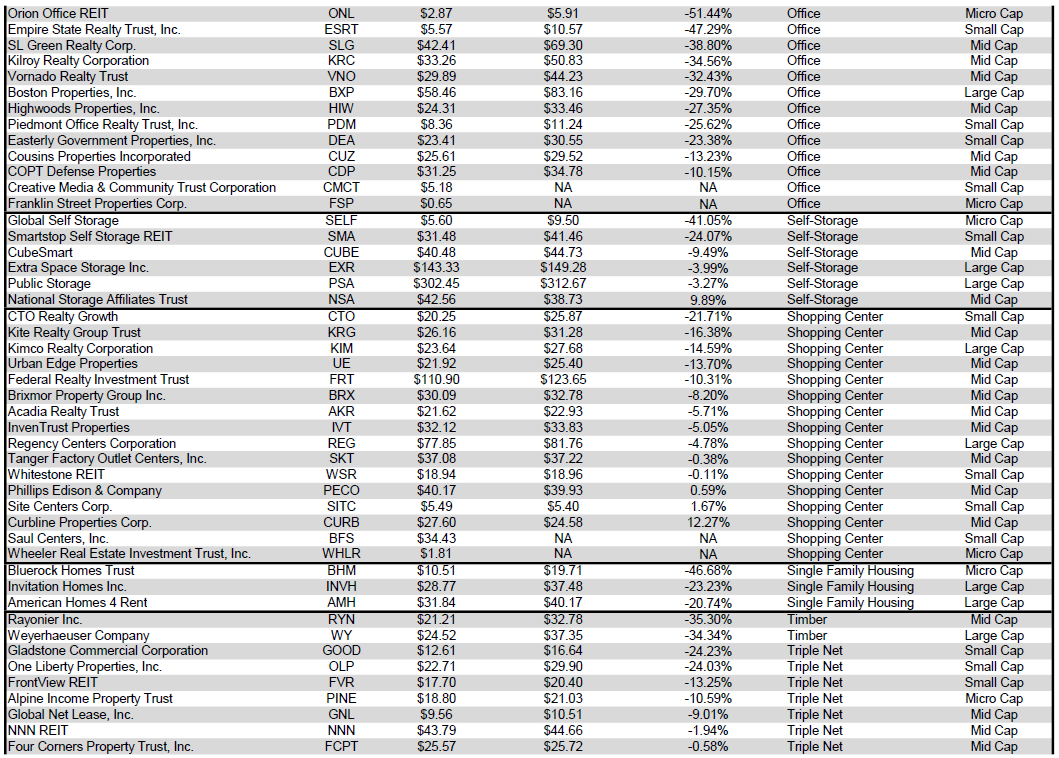
Source: Table by Simon Bowler of 2nd Market Capital, Data compiled from S&P Global Market Intelligence LLC. See important notes and disclosures at the end of this article

Source: Table by Simon Bowler of 2nd Market Capital, Data compiled from S&P Global Market Intelligence LLC. See important notes and disclosures at the end of this article
The large-cap REIT premium (relative to small-cap REITs) widened yet again in April, and investors are now paying on average about 47% more for each dollar of 2026 FFO/share to buy large-cap REITs than small-cap REITs (17.8x/12.1x - 1 = 47.1%). As can be seen in the table below, there is presently a strong positive correlation between market cap and FFO multiple.
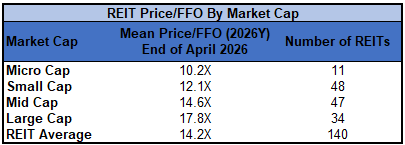
Source: Table by Simon Bowler of 2nd Market Capital, Data compiled from S&P Global Market Intelligence LLC. See important notes and disclosures at the end of this article
The table below shows the average NAV premium/discount of REITs of each market cap bucket. This data, much like the data for price/FFO, shows a strong, positive correlation between market cap and Price/NAV. The average large-cap REIT (+0.44%) trades at a slight premium to consensus NAV. Mid cap REITs (-6.10%) trade at a single-digit discount. Small-cap REITs (-20.65%) trade for about 4/5 of NAV, while micro-caps (-29.63%) trade for a little over 1/3 of NAV.
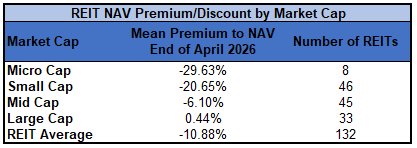
Source: Table by Simon Bowler of 2nd Market Capital, Data compiled from S&P Global Market Intelligence LLC. See important notes and disclosures at the end of this article
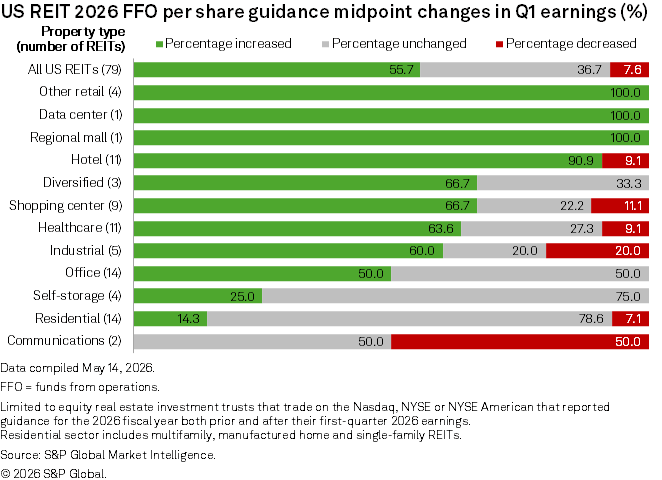
The REIT sector fundamentals appear to be broadly strong, as a majority of REITs (55.7%) hiked their 2026 FFO/share guidance. This strength was further demonstrated by the fact that only 7.6% of REITs cut 2026 earnings guidance. Sectors that saw particularly strong guidance increases were Data Centers, Malls, and Other Retail (Triple Net Retail), whereas the property types that saw the weakest earnings guidance revisions were Communications REITs (0% increase / 50% reduction) and Residential REITs (14.3% increase / 7.1% reduction).
Source: S&P Global Market Intelligence
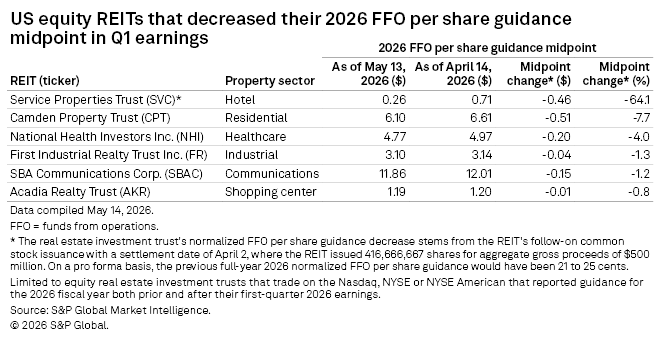
The most severe earnings midpoint FFO/share guidance reduction came from Service Properties Trust (SVC) with a -64.1% downward revision. Other REITs with material cuts to 2026 guidance came from Camden Property Trust (CPT) (-7.7%), National Health Investors (NHI) (-4.0%), and First Industrial Realty Trust (FR) (-1.3%). Despite the heavy downward reduction to FFO/share, however, CPT's core FFO/share guidance remained unchanged.
Source: S&P Global Market Intelligence
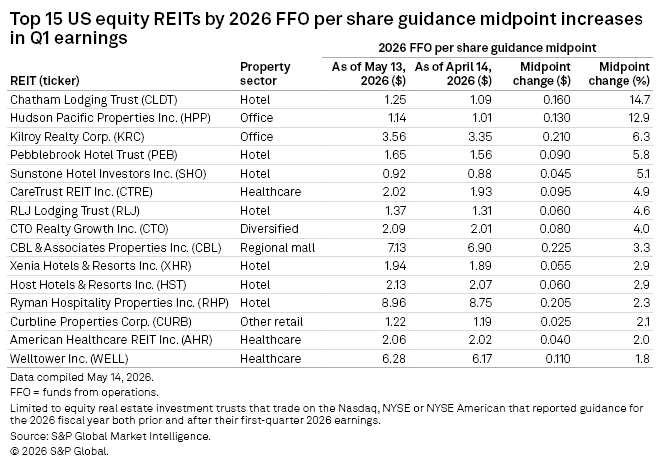
Both Chatham Lodging Trust (CLDT) (+14.7%) and Hudson Pacific Properties (HPP) (+12.9%) raised their guidance midpoint by double digits. Overall, Hotels accounted for 7 of the 15 REITs with the biggest FFO/share guidance increases, with Pebblebrook Hotel Trust (PEB) (+6.3%), Sunstone Hotel Investors (SHO) (+5.1%), and RLJ Lodging Trust (RLJ) (+4.6%) announcing strong increases to guidance at the midpoint.
Source: S&P Global Market Intelligence
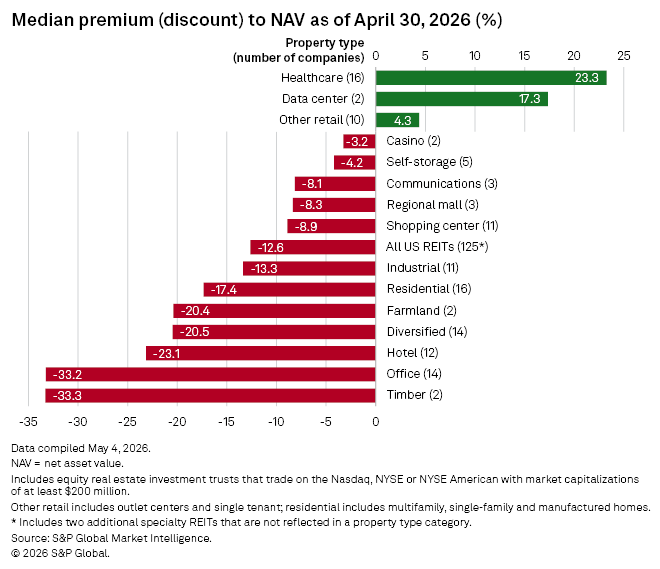
Despite strong fundamentals and rising earnings forecasts, the REIT sector remains heavily discounted. The property types with the largest NAV discounts are Timber (-33.3%), Office (-33.2%), and Hotels (-23.1%). Health Care (+23.3%), Data Centers (+17.3%), and Other Retail (+4.3%) are the only property types that trade at a premium.
Source: S&P Global Market Intelligence
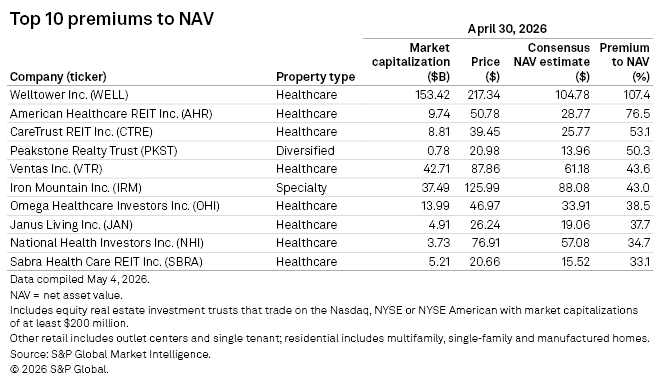
Health Care REITs account for 8 of the 10 largest NAV premiums, led by Welltower's enormous 107.4% premium. Other Health Care REITs with massive premiums are American Healthcare REIT (AHR) (76.5%), Ventas (VTR) (+43.6%), and Omega Healthcare Investors (OHI) (38.5%). The only REITs from other property types on the list at the end of April were Peakstone Realty Trust (PKST) (50.3%), which was delisted just days later in early May due to being acquired, and Iron Mountain (IRM) (43%), which has risen sharply in recent months due to very strong earnings growth.
Source: S&P Global Market Intelligence
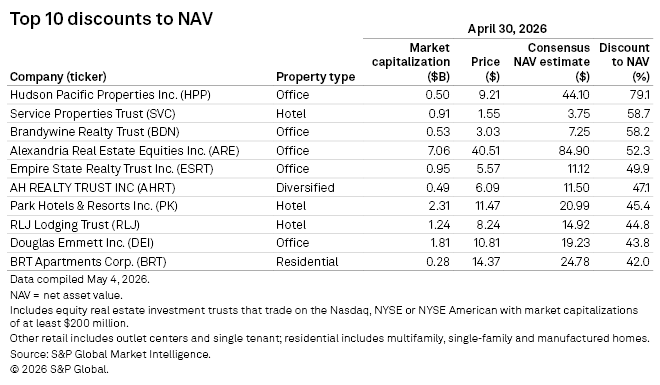
Office and Hotel REITs account for 80% of the 10 largest NAV discounts in the REIT sector. Even after a huge recovery and being the best-performing REIT in April, HPP remains the furthest below NAV at a 79.1% discount. Service Properties Trust (SVC) (-58.7%), Brandywine Realty Trust (BDN) (-58.2%), and Alexandria Real Estate Equities (ARE) (-52.3%) also trade for less than half of their respective net asset values.
Source: S&P Global Market Intelligence
The REIT sector is well-positioned to potentially achieve a strong total return over upcoming years as fundamentals continue to move in a positive direction and share prices remain largely below fair value. While not all REITs are attractively priced, there is a large pool of REITs that are currently trading at wide discounts to NAV while simultaneously performing well at the property level and raising guidance. Some of these quality discounted REITs will get snatched up via acquisition, and others will see their share prices get bid up toward and potentially even above fair value. Investors in the right REIT securities have multiple potential pathways to profitability through the remainder of 2026 and beyond.
Editor's Note: This article discusses one or more securities that do not trade on a major U.S. exchange. Please be aware of the risks associated with these stocks.
此内容由惯性聚合(RSS阅读器)自动聚合整理,仅供阅读参考。 原文来自 — 版权归原作者所有。