








J Studios/DigitalVision via Getty Images
When talking about the Goldman Sachs S&P 500 Premium Income ETF (GPIX), we're talking about one of the top performers among buy-write ETFs on the S&P 500. A solution that finds its strength, not by chance, precisely in the dynamism of the covered call strategy overlay. Which distinguishes it from mechanical solutions created before it. In the end, in a market like the S&P 500, where expected returns derive mainly from capital gains, strategically choosing to sacrifice less upside capture can really make the difference, even without compressing the distribution too much. And here we're talking precisely about this.
When talking about GPIX, one immediately thinks of a "lowest cost peer" in the covered call ETF category. An ETF that has the S&P 500 Index as its declared benchmark, but GPIX is NOT a pure passive index fund. Rather, it is defined as an "actively managed ETF" by the prospectus, but the activity only concerns the options overlay, not the equity selection.
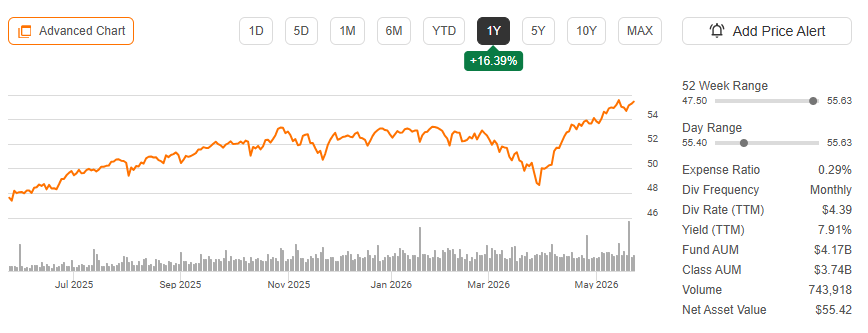
GPIX: profile (Seeking Alpha)
GPIX, in fact, offers pure beta exposure to the S&P 500 on the equity side, with the options overlay as the only strategic differentiation element. It does this with a net expense ratio of 0.29% annually with an active fee waiver of -0.06% valid at least until April 30, 2027.
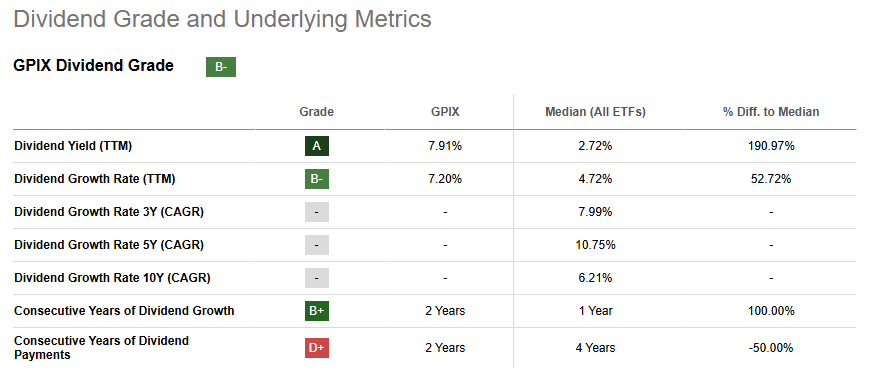
GPIX: dividend grade (Seeking Alpha)
Which is justified by a 12-Month Trailing Distribution Rate (as of April 30, 2026) of 8.00%, with an SA of 7.9%, distributed monthly (composed on average of over 90% by ROC (the 30-day SEC yield is less than 1%).
The fund uses a dynamic covered call ("overwrite strategy") using mainly FLEX Options and doesn't write calls on the individual stocks held but on ETFs that track the S&P 500 with a declared coverage ratio range between 25% and 75% of the equity portfolio value (historical average: ~32%) with a weekly/monthly expiration structure.
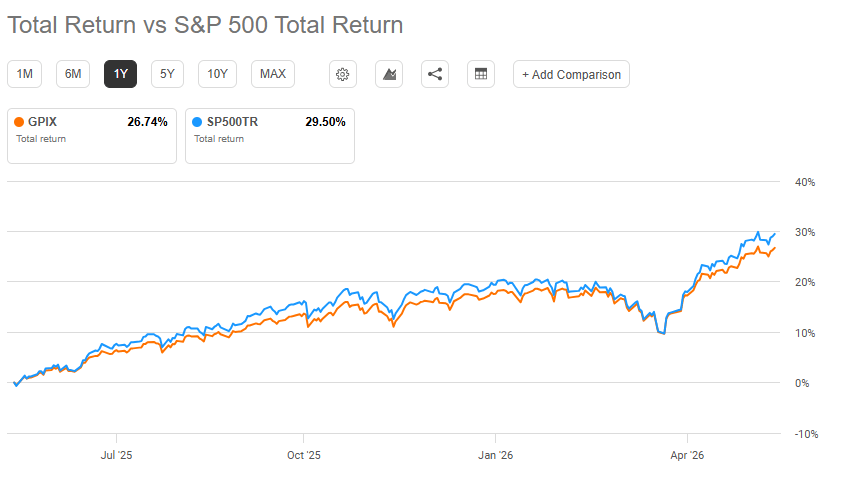
GPIX - S&P 500: total return (Seeking Alpha)
This means that the remaining 25-75% equity remains uncovered and captures the upside, and this explains the upside capture of 91.8% (last 12 months). So, if SPY does NOT breach the strike + premium, keep the premium, while if SPY breaches the strike, pay the difference (index value - strike) to the buyer.
The economic return comes from equity appreciation (the uncovered portion and appreciation below the strike of the covered portion). Option premiums (monetize implied volatility) and equity dividends (smaller, ~1.3%). In fact, the fund's objective states that it "seeks current income while maintaining prospects for capital appreciation," therefore providing monthly distributions "at a relatively stable rate" (emphasis on stability, not maximization).
This positions it as a hybrid solution between pure equity exposure (S&P 500 index fund) and pure income generation (traditional covered call fund like XYLD). And in this sense, it's clear that GPIX does NOT replace a core S&P 500 holding (underperformance 3.4 points annualized) and that it's not a bond alternative either (downside exposure is equity-level, not fixed-income-level).
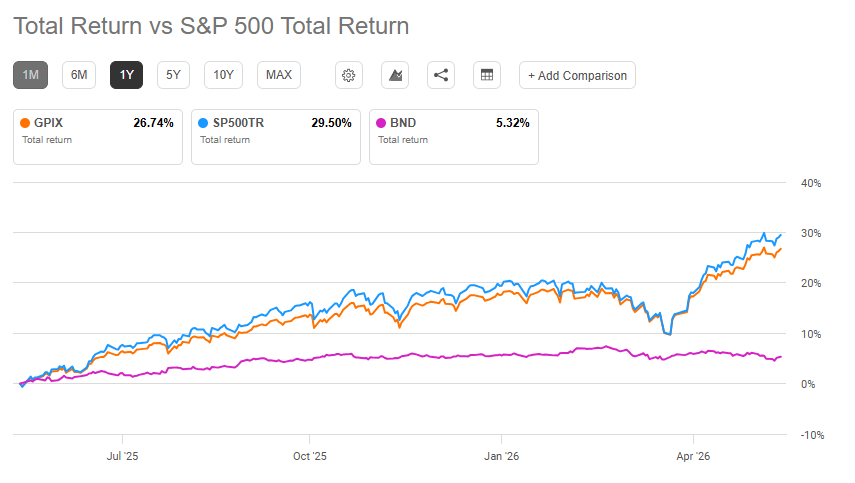
GPIX - S&P 500 - BND: total return (Seeking Alpha)
In fact, it's less competitive in strong bull markets, and in strong bear markets it doesn't do a great job because it still takes 100% of the declines. Rather, it gains validity compared to alternatives in flat-to-moderately rising markets because here GPIX captures most of the upside (91.8% capture in this regime) and collects premiums. Partially instead, it also gains strategic value in a high implied volatility environment, when the VIX is elevated because option premiums are richer. And as I see it, also in an early phase post-correction, here Option premiums are still elevated, and the partial overlay allows participation in recovery.
So it becomes a solution for those who want S&P 500 exposure BUT with monthly cash flow, aware that they sacrifice 5-15% upside in exchange for ~8% annual distributions. A theoretically minor sacrifice compared to pure covered calls, considering that the overlay here in theory is partial. Distributions are made for 92% by ROC, so it means no immediate tax on ~92% of distributions.
At the tax level, it may make less sense inside IRA or 401k accounts, as the ROC tax advantage would be irrelevant.
Today it physically holds ~495-500 S&P 500 stocks in market-cap-weighted proportions (so, like for the S&P 500, almost a third of the portfolio is in 7 mega-cap names), receives dividends from the holdings, and then sells call options on SPY (overlay between 25% and 75%), from which it receives upfront cash (the "premium") from the call buyer.
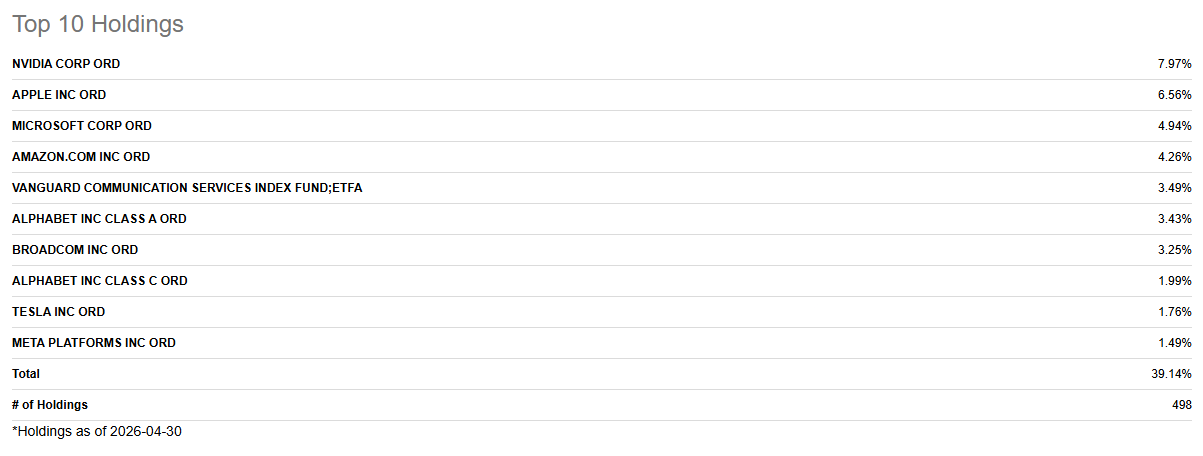
GPIX: holding breakdown (Seeking Alpha)
So, Goldman is NOT trying to "beat" the S&P 500 via stock-picking; the alpha generation is entirely on the options overlay, and the equity component is pure beta exposure. Then it does NOT write calls on the individual 500 stocks held. It writes calls at the index level (SPY, which tracks the S&P 500), on which it builds a ladder strategy, not a uniform strike, to have smoother premium collection and less whipsaw risk. As of today, the covered ratio has remained very low, in the low feasibility range, leaving more room for the price to run. Today it's under 30%. Then it changes with expirations or with the S&P 500 Index reconstitution schedule for a portfolio turnover of 27%.
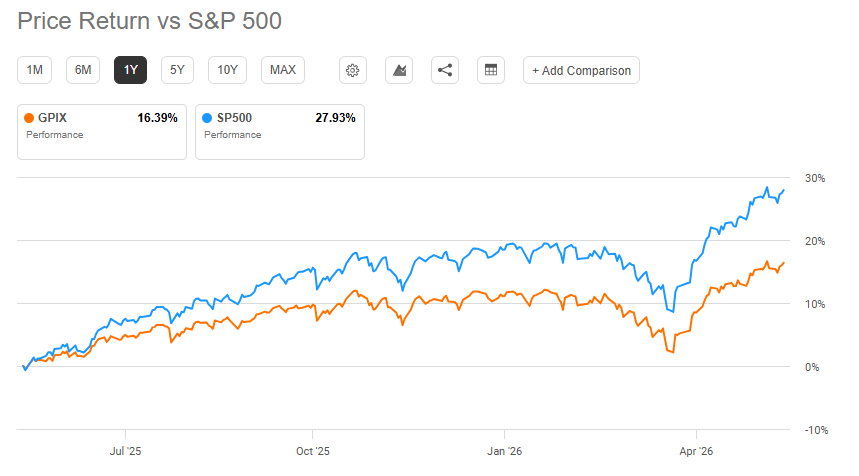
GPIX - S&P 500: price return (Seeking Alpha)
Let's start with the reason this fund exists: the distribution. The fund distributes 8% annually, but to be sustainable, it means that annual returns between capital gains and market premiums must exceed 8%. ROC in itself is not a problem; rather, it gives a tax advantage, but it would become one if the distribution were not sustainable. In that case, one would enter a negative spiral that could result in depreciation or a reduction in distributions to preserve capital.
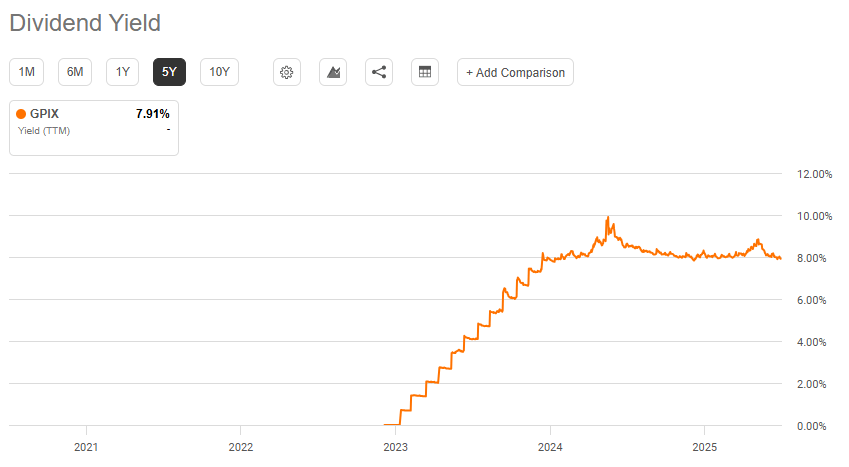
GPIX: dividend yield (Seeking Alpha)
And in this sense, I want to clarify that as much as realized volatility is declared "lower than S&P 500" by the prospectus, judging by the 52-week drawdown of -15.4%, downside volatility is NOT significantly reduced; it's NOT a hedging tool, just as it cannot be an amplifier of S&P 500 returns in the long term. So in other words, one accepts this disadvantageous trade-off compared to the S&P 500 in exchange for a specific distribution system.
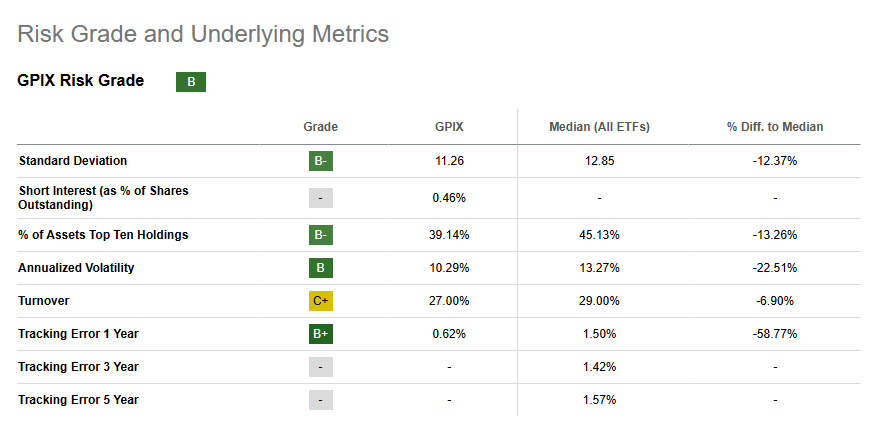
GPIX: risk grade (Seeking Alpha)
Comparison with JEPI and XYLD:
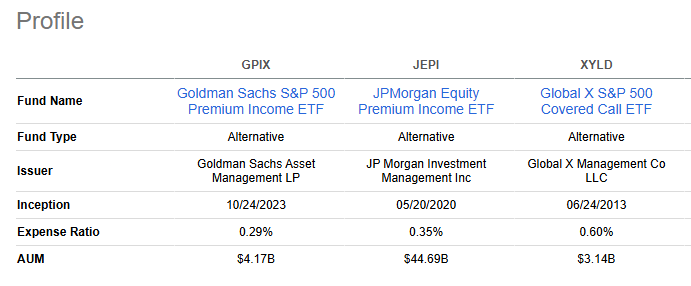
GPIX: peer table (Seeking Alpha)
JEPI: 100% overwrite, 4.32% appreciation (27 months); XYLD: 100% overwrite, 0.71% appreciation (27 months); GPIX: 25-75% overwrite, 21.73% appreciation (27 months). We're therefore talking about significantly lower upside capture in the threshold of 5-10% maximum versus 91% of GPIX. GPIX captures 5x more appreciation than JEPI thanks to its partial overlay. And this is the main difference compared to GPIX. Going more specifically, though, other differences in terms of composition are noted. JEPI, for example, doesn't have physical replication of S&P 500 stocks; it rather uses ELN.
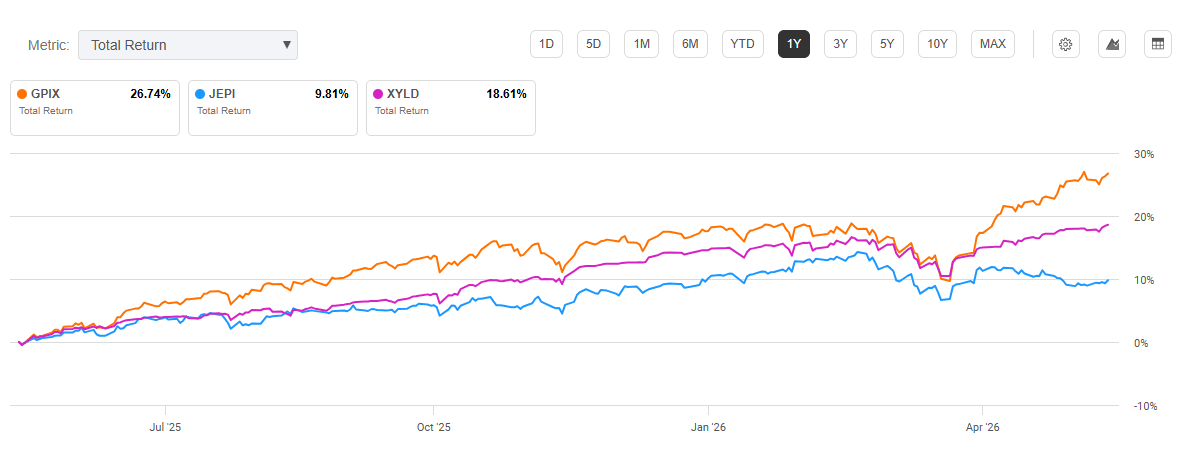
GPIX - JEPI - XYLD (Seeking Alpha)
For completeness, it makes sense to also evaluate SPYI, considering, however, that this ETF is the only one in this peer table to have performance competitive with GPIX. What changes is the distribution; considering that SPYI has a distribution yield of 18%, while GPIX is lower, means that SPYI becomes more suitable for those interested in maximizing the distribution, but the source of returns is similar, which means that in weaker years of the S&P 500, GPIX will probably maintain greater capital anchoring.
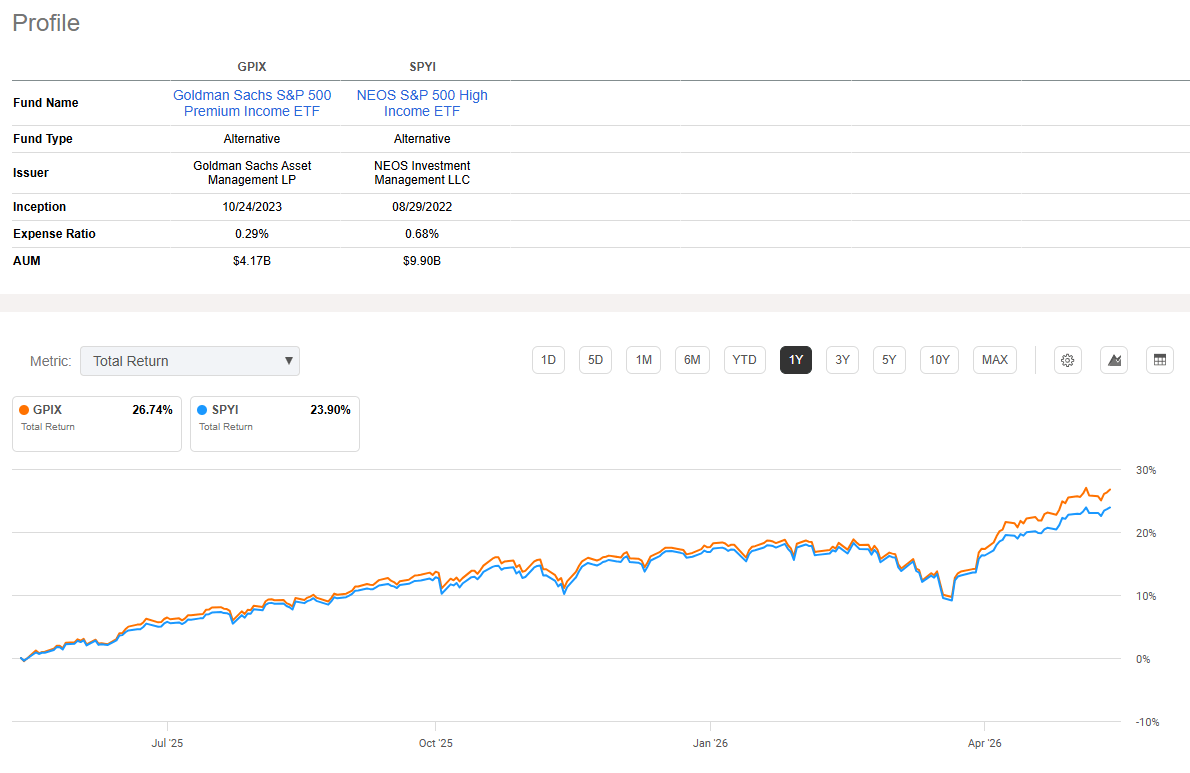
GPIX - SPYI (Seeking Alpha)
So summing up, we can identify some clearly distinguishable positive elements for GPIX:
And naturally the negative aspects must be included:
This article answers three main questions about GPIX:
Editor's note: This article is intended to provide a general overview of the ETF for educational purposes only and, unlike other articles on Seeking Alpha, does not offer an investment opinion about the ETF.
此内容由惯性聚合(RSS阅读器)自动聚合整理,仅供阅读参考。 原文来自 — 版权归原作者所有。