



Thanadon Naksanee/iStock via Getty Images
Q1 2026 was volatile, as the Iran conflict contributed to higher oil prices, renewed inflation concerns, and a market selloff. Oil prices surged, stocks declined, and bond yields moved higher. Higher energy prices introduced a new and significant source of uncertainty for corporate costs, consumer spending, and Federal Reserve policy. While some market measures improved near quarter-end, the outlook remained uncertain and dependent on geopolitical developments.
That said, the economy entered this period in solid shape, and stock indices experienced only a modest pullback, as investors weren’t pricing in a lasting economic impact. Additionally, corporate fundamentals did not deteriorate as dramatically as the headlines might have suggested. In fact, corporate earnings were still growing at a double-digit annual rate, well above the historical average (1). In addition, the labor market remained in a relatively healthy “no fire, no hire” dynamic.
Investors continued to wrestle with the implications of the artificial intelligence (“AI”) boom. Unlike years past, when the AI boom helped drive the bull market in tech stocks, the focus in the first quarter was on the companies that could be hurt by AI. This was seen first in software stocks, and then a rolling selloff hit a broad range of industries, including trucking, commercial real estate, and financial data. The concern was that AI would lower barriers to entry and upend existing industry dynamics. Overall, investors rotated out of Growth areas of the market. Small-cap, Value, and Alternative assets all posted positive returns.
In the bond market, yields began to decline at the beginning of the year, only to be pushed higher across maturities by quarter’s end. Even before the war-driven jump in oil prices, inflation was on the high side, raising doubts about how quickly the Federal Reserve would deliver expected interest rate cuts. Investors went from expecting two rate cuts in 2026 to none. Below is a summary of benchmark returns. (2)
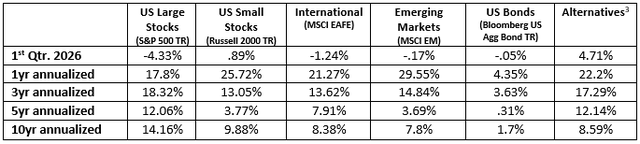
After reaching all-time highs in February, investors spent much of March grappling with the ramifications of the Iran conflict. Higher energy costs renewed inflationary pressures, and concerns about a slowing economy al potentially contributed to the sell-off in stocks. The late-quarter rally on March 31—when the S&P 500 surged 2.9%, and the Nasdaq leaped 3.8%—was fueled by hopes of a de-escalation in the conflict. (Since Q2 started, stocks continued their strong rally from March 31st, erasing all of Q1’s decline, and were back at all-time highs.)
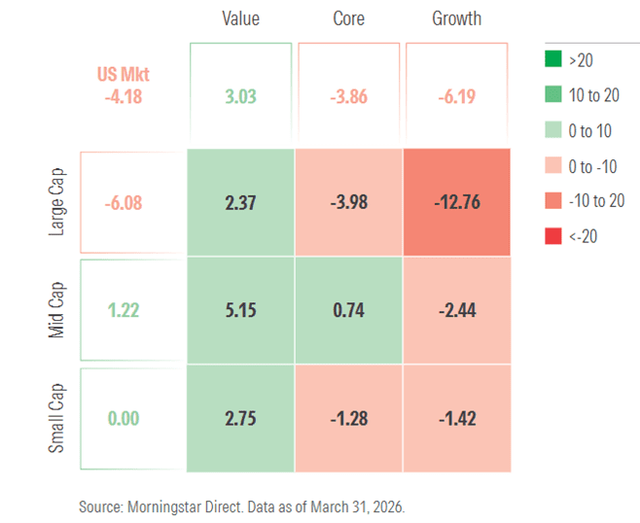
Major indexes, including the Nasdaq, Russell 2000, and Dow, all experienced corrections of at least 10% during the quarter. Large-cap growth stocks were hit especially hard. Value stocks outperformed growth across all market caps, while mid- and small-cap stocks generally led large-caps (see chart).
Within equities, there were pockets of strength. Six out of 11 S&P 500 sectors rose, and over 56% of S&P 500 stocks outperformed the index, the second most in the last 15 years (4). Overall, Q1 sector leadership reflected a rotation toward Value and inflation beneficiaries.
The market’s focus was squarely on oil. As the conflict began, oil prices briefly spiked toward $120 per barrel on fears of supply disruption through the Strait of Hormuz. Since then, prices eased back but remained near $100. Stocks reacted accordingly — rallying when oil pulled back and struggling when it moved higher. The eventual impact will depend on the duration and scope of events. If oil were to remain elevated for an extended period, it could slow global growth enough to raise concerns about a global recession.
The majority of past geopolitical events have had limited long-term impact on long-term stock returns. While there is no assurance that current conditions will follow a similar pattern, today’s very different oil dynamics make some of the vulnerabilities of past episodes far less applicable.
The broader energy landscape looks very different from the 1970s and 1980s. On the supply side, the balance of power has shifted: in the 1970s, OPEC produced over twice as much oil as the OECD – essentially the major developed market producers outside the Middle East – leaving the US vulnerable during the oil embargo era.
Now, the US has lifted OECD output to nearly match OPEC’s, and for the first meaningful period in modern history, the U.S. was a net exporter of crude oil rather than an importer. In addition, US consumers currently spend 3% of their income on energy versus nearly 8% in the 1970’s.
As for corporate profits, sell-side estimates for Q1’26 earnings for the S&P 500 Index actually increased since the start of the Middle East conflict on Feb 28th, while valuations generally declined. FactSet’s March 27 data projected S&P 500 first-quarter earnings growth of 13.0%, led by information technology, materials, and financials, while health care was expected to experience the largest earnings decline.
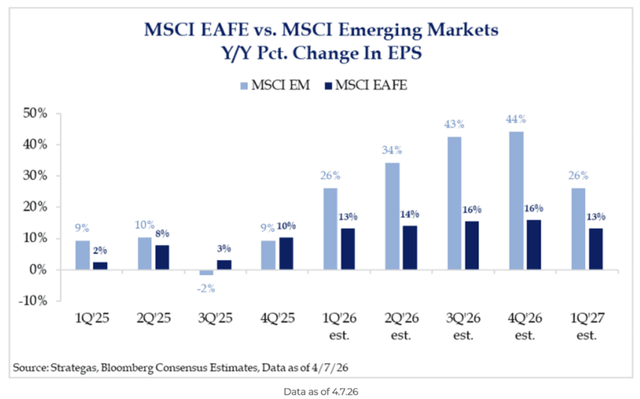
The conflict upended recent trends in global markets. Before the war, the global economy clocked in another month of strong growth in February, according to the latest global purchasing manager’s index (PMIs). The global composite (services and manufacturing) PMI climbed 0.8 points to 53.3, the highest level since May 2024.
International stocks had outperformed U.S. stocks over the last year. That leadership reversed abruptly when the Iran conflict started: equity markets in regions most dependent on energy imports underperformed, whereas the US stocks were steadier. For example, prices of liquefied natural gas (LNG) rose sharply in regions that relied heavily on imports, such as Europe, while remaining mostly flat in the U.S.
During the quarter, the MSCI ACWI ex USA Value Index outpaced the MSCI ACWI ex USA Growth Index by almost six percentage points, driven primarily by the Value Index’s higher exposure to the Energy sector.
As for corporate profits, sell-side estimates for Q1’26 earnings for the S&P 500 Index actually increased since the start of the Middle East conflict on Feb 28th while valuations generally declined. FactSet’s March 27 data projected S&P 500 first-quarter earnings growth of 13.0% led by information technology, materials, and financials, while health care was expected to experience the largest earnings declines, led by Emerging Markets. The gap between declining prices and rising earnings caused valuations to decrease.
In the US, higher crude prices threatened to lift inflation, slow real growth, and delay Federal Reserve rate cuts, which kept long-term yields elevated and equities under pressure.
Canada appeared more insulated, as strength in energy production offset consumer strain, supporting relatively stable growth, though its equity market remained vulnerable to rising yields due to heavy Financials exposure. Europe faced greater downside risks because of its sensitivity to energy costs, with slowing growth and the potential for renewed inflation.
Across Asia, Japan’s improving fundamentals were balanced by energy import risks, while China’s steady growth masked weaker domestic demand and external trade pressures. India remained structurally strong but faced valuation and cost headwinds. Brazil stood out positively, supported by commodities and favorable valuations.
Despite heightened uncertainty from geopolitical tensions, past patterns suggested markets remained resilient as long as global growth avoided a sharp downturn, though higher oil prices could reduce global growth.
Looking into 2026, the key variables to monitor will be interest rate trends, inflation expectations, currency movements, and global trade developments. Rising real yields or renewed dollar strength could challenge risk assets, while stable rates, easing inflation, and policy continuity could support international equity performance early in the year. Geopolitical developments and shifts in fiscal policy, particularly in Europe and the U.S., may also play a meaningful role in shaping investor sentiment and regional market leadership.
The severity of the macroeconomic risks linked to Iran remained difficult to gauge. The economic data was lagging too much to reflect any of the conflict’s impact. However, Increased costs and uncertainty could weigh on business investment and consumer spending, impacting growth if these conditions persist. A balancing act between higher energy costs and the positive pre-war trends could keep the economy growing.
The economy entered the conflict in a healthy position with strong consumer and corporate balance sheets, fiscal tailwinds, and strong corporate earnings.
The primary growth engine was the AI buildout. Hyper-scaler capital investment alone was projected over $600bn or 2% of GDP (6). In addition, manufacturing was recovering, the labor market appeared to be stabilizing, productivity was accelerating, and consumption was still healthy.
Nonetheless, these positive data points were overshadowed by the conflict’s effect on not only energy prices but also potential supply chain disruptions and other input costs.
Higher inflation pressures pushed up yields—making it harder for investors and central banks to ignore the downside effects. The Federal Reserve remained cautious and delayed rate cuts, which created a more difficult backdrop for both the U.S. economy and financial markets.
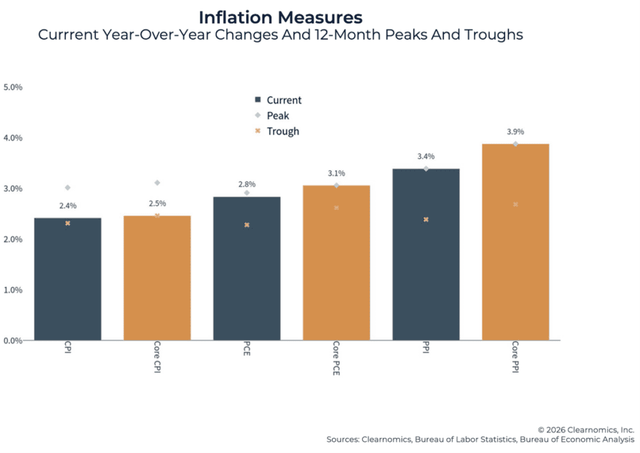
Inflation pressure had started to heat up before the war. The year-over-year trend in Core Personal Consumption Expenditures (PCE) edged up to 3.1% in January, the fastest pace in nearly 2 years. With the conflict lifting energy and other input costs, the potential for even higher inflation was high. This would be especially problematic if economic activity slowed, unleashing some degree of stagflation.
Historically, a 10% rise in oil prices added about 0.1 to 0.2 percentage points to inflation compounding affordability challenges. We continue to see risks that we are in a higher inflation regime, with greater inflation volatility. That has implications for traditional portfolio construction, including the diversification potential for bonds.
A late quarter rally helped stabilize US fixed income, with the 10-year Treasury yield falling from 4.44% to 4.30% as expectations grew that tensions tied to the Iran conflict might ease. The Bloomberg U.S. Aggregate Index finished nearly flat after recovering most of March’s losses. Performance varied widely across sectors. Short-term bonds performed better than long-term bonds and credit sectors declined.
While valuations improved somewhat during the quarter, risks also increased, prompting a more cautious overall risk posture in applicable portfolios. Stock prices generally move in anticipation of economic shifts, and several long-term price indicators turned negative, suggesting a more cautious, risk-aware posture was appropriate. We continue to monitor valuation, inflation, interest-rate trends, and market breadth as part of our ongoing investment process.
On the positive side, the US economy is much less energy-intensive than in the past and less dependent on oil imports. Additionally, the economy entered the quarter on a strong note, with record corporate profits and the AI-related buildout in full swing. Other positive signals included overly pessimistic investor sentiment and non-recessionary economic conditions.
There were few places to hide during the quarter. Long-term bonds did not provide ballast as equities fell. That was because investors demanded more compensation for the risk of holding long-term bonds given persistent inflation and high debt levels. This episode is consistent with our view that inflation may remain higher and more volatile than in prior years. In response to this increased inflation risk, we favor less rate-sensitive short- and medium-term bond strategies that may offer a better ballast to stock portfolios. Sticky inflation remains the primary risk if the disruption endures.
Regardless of the future path of rates, it’s important to remember the role of bonds in a portfolio. In a well-diversified portfolio, high-quality fixed income can provide a cushion with less risk than equities, particularly for investors who are spending from their accounts. Not all portfolios are identical. We manage accounts with additional complexities that were not discussed in this update. Please reach out to your advisor with any questions.
Important Disclosures: None of the above is a prediction or guarantee. Markets remain subject to change based on incoming economic data, policy developments, and geopolitical events. We continue to emphasize diversification, risk awareness, and alignment with each client’s long-term objectives. Markets involve risk, and the views are subject to change based on incoming data. Leonard Rickey Investment Advisors, P.L.L.C. (“LRIA”) is an SEC-registered investment adviser. Registration does not imply a certain level of skill or training. This material is for informational purposes only and is not individualized investment, tax, or legal advice. Opinions are as of the date shown and may change. Forward-looking statements are not guarantees and involve risks and uncertainties. Indexes are unmanaged, do not incur fees, and cannot be invested in directly. Past performance is not indicative of future results. For additional information about LRIA, our Form ADV and Form CRS are available on request. Index Definitions: The Barclays Aggregate Bond Index represents securities that are SEC-registered, taxable, and dollar denominated. The index covers the US investment-grade fixed rate bond market, with index components for government and corporate securities, mortgage pass-through securities, and asset-backed securities. The Standard & Poor’s 500 Index is a capitalization-weighted index of 500 stocks designed to measure performance of the broad domestic economy through changes in the aggregate market value of 500 stocks representing all major industries. It cannot be invested into directly. The Russell 2000 Index is an unmanaged index generally representative of the 2,000 smallest companies in the Russell Index, which represents approximately 10% of the total market capitalization of the Russell 3000 Index. The MSCI Emerging Markets Index is a float-adjusted market capitalization index that consists of indices of approximately 800 stocks and is designed to measure equity market performance in 23 emerging economies: Brazil, Chile, China, Colombia, Czech Republic, Egypt, Greece, Hungary, India, Indonesia, Korea, Malaysia, Mexico,, Peru, Philippines, Poland, Qatar, Russia, South Africa, Taiwan, Thailand, Turkey, and the United Arab Emirates. The MSCI EAFE (Europe, Australasia, Far East) Index is a free float-adjusted market capitalization index of approximately 900 stocks and is designed to measure equity market performance in 21 developed market countries outside of North America. The SG Trend Index is a subset of the SG CTA Index and follows traders of trend following methodologies. The SG CTA Index is equal weighted, calculates the daily rate of return for a pool of CTAs selected from the larger managers that are open to new investment. Swiss Re Global Cat Bond Index tracks the aggregate performance of all catastrophe bonds issued offered under Rule 144A. The index captures bonds denominated in any currency, all rated and unrated cat bonds, outstanding perils, and triggers. The index is not exposed to currency risk from non-USD denominated cat bonds. The Nasdaq Composite Index is a market capitalization-weighted index of more than 3,000 stocks listed on the Nasdaq stock exchange. Gold is the spot price at which gold is traded on the New York Mercantile Exchange’s Commodities Exchange Important Disclosures Leonard Rickey Investment Advisors, PLLC (“LRIA”), is an SEC registered investment adviser located in the State of Washington. Registration does not imply a certain level of skill or training. For information pertaining to the registration status of LRIA, please contact LRIA or refer to the Investment Adviser Public Disclosure website (www.adviserinfo.sec.gov). This is provided for general information only and contains information that is not suitable for everyone. As such, nothing herein should be construed as the provision of specific investment advice or recommendations for any individual. To determine which investments may be appropriate for you, consult your financial advisor prior to investing. There is no guarantee that the views and opinions expressed herein will come to pass. This newsletter contains information derived from third party sources. Although we believe these third-party sources to be reliable, we make no representations as to the accuracy or completeness of any information prepared by any unaffiliated third party incorporated herein and take no responsibility therefore. Any projections, forecasts and estimates, including without limitation any statement using “expect” or “believe” or any variation of either term or a similar term, contained here are forward-looking statements and are based upon certain current assumptions, beliefs and expectations that LRIA considers reasonable or that the applicable third parties have identified as such. Forward-looking statements are necessarily speculative in nature, and it can be expected that some or all of the assumptions or beliefs underlying the forward-looking statements will not materialize or will vary significantly from actual results or outcomes. Some important factors that could cause actual results or outcomes to differ materially from those in any forward-looking statements include, among others, changes in interest rates and general economic conditions in the U.S. and globally, changes in the liquidity available in the market, change and volatility in the value of the U.S. dollar, market volatility and distressed credit markets, and other market, financial or legal uncertainties. Consequently, the inclusion of forward-looking statements herein should not be regarded as a representation by LRIA or any other person or entity of the outcomes or results that will be achieved by following any recommendations contained herein. While the forward-looking statements here reflect estimates, expectations and beliefs, they are not guarantees of future performance or outcomes. LRIA has no obligation to update or otherwise revise any forward-looking statements, including any revisions to reflect changes in economic conditions or other circumstances arising after the date hereof or to reflect the occurrence of events (whether anticipated or unanticipated), even if the underlying assumptions do not come to fruition. Opinions expressed herein are subject to change without notice and do not necessarily take into account the particular investment objectives, financial situations, or particular needs of all investors. For additional information about LRIA, including fees and services, please contact us for our Form ADV disclosure brochure using our contact information herein. Please read the disclosure brochure carefully before you invest or send money.
Editor's Note: The summary bullets for this article were chosen by Seeking Alpha editors.
此内容由惯性聚合(RSS阅读器)自动聚合整理,仅供阅读参考。 原文来自 — 版权归原作者所有。