


Semafor Intelligence, a new AI-enabled editorial insight product built on our global convenings, began as a prototype that Semafor Tech Editor Reed Albergotti made using OpenAI’s Codex the Sunday morning after Semafor World Economy 2026 wrapped up, with the goal of identifying the central themes across conversations over five days on three simultaneous stages. After he shared it with the newsroom, Alastair Clements, Semafor’s data lead, worked with Reed over the next 36 hours to turn the prototype into a robust analytical tool that parsed 4,900 distinct claims from more than 300 speakers, every claim anchored to a specific quote in the transcripts.
The tool analyzed every transcript, pulled out every distinct claim each speaker made, and turned each one into a numerical fingerprint that captures meaning rather than wording. This technology is called “embedding” or “vectorizing” and is becoming a common way to process large amounts of text to understand the relationships between the ideas in a corpus: It essentially assigns ideas to a complex string of numbers, then uses those numbers to understand the semantic proximity between ideas. This proximity map was used to help refine the report. The tool then used multi-agent reasoning to surface direct quotes from speakers that support or push back on the central themes.
Semafor’s journalists then reviewed every theme: stress-testing the premises, interrogating the supporting quotes, and editing down to the ones most clearly supported by what was actually said. The report is a product of that editorial process. Current AI systems aren’t capable of generating insights on their own more reliably than journalists, but they can allow us to build tools that expand the scope of what journalists can discover and analyze. The technology determined what was possible to surface; the journalists determined the framing and what was worth publishing.
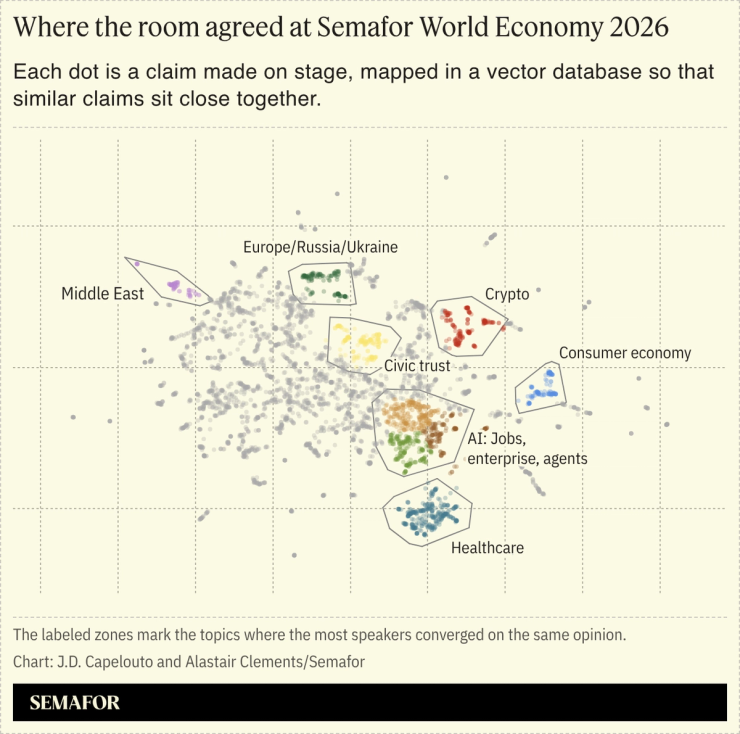
For the technically curious: The vector database runs on Google’s BigQuery. The fingerprints themselves were produced by an embedding model from an AI company called Voyage (now owned by MongoDB). Anthropic’s Haiku 4.5 and Opus 4.7 models helped with text analysis. A second-pass ranker from Cohere helped the system surface the relevant evidence for each query. The cluster map you see above came out of an open-source library called UMAP that compressed our 1024-dimension vectors into two-dimensional coordinates. The whole pipeline was wired together using Claude Code. In all, the API calls and new database only cost a few hundred dollars.
此内容由惯性聚合(RSS阅读器)自动聚合整理,仅供阅读参考。 原文来自 — 版权归原作者所有。