








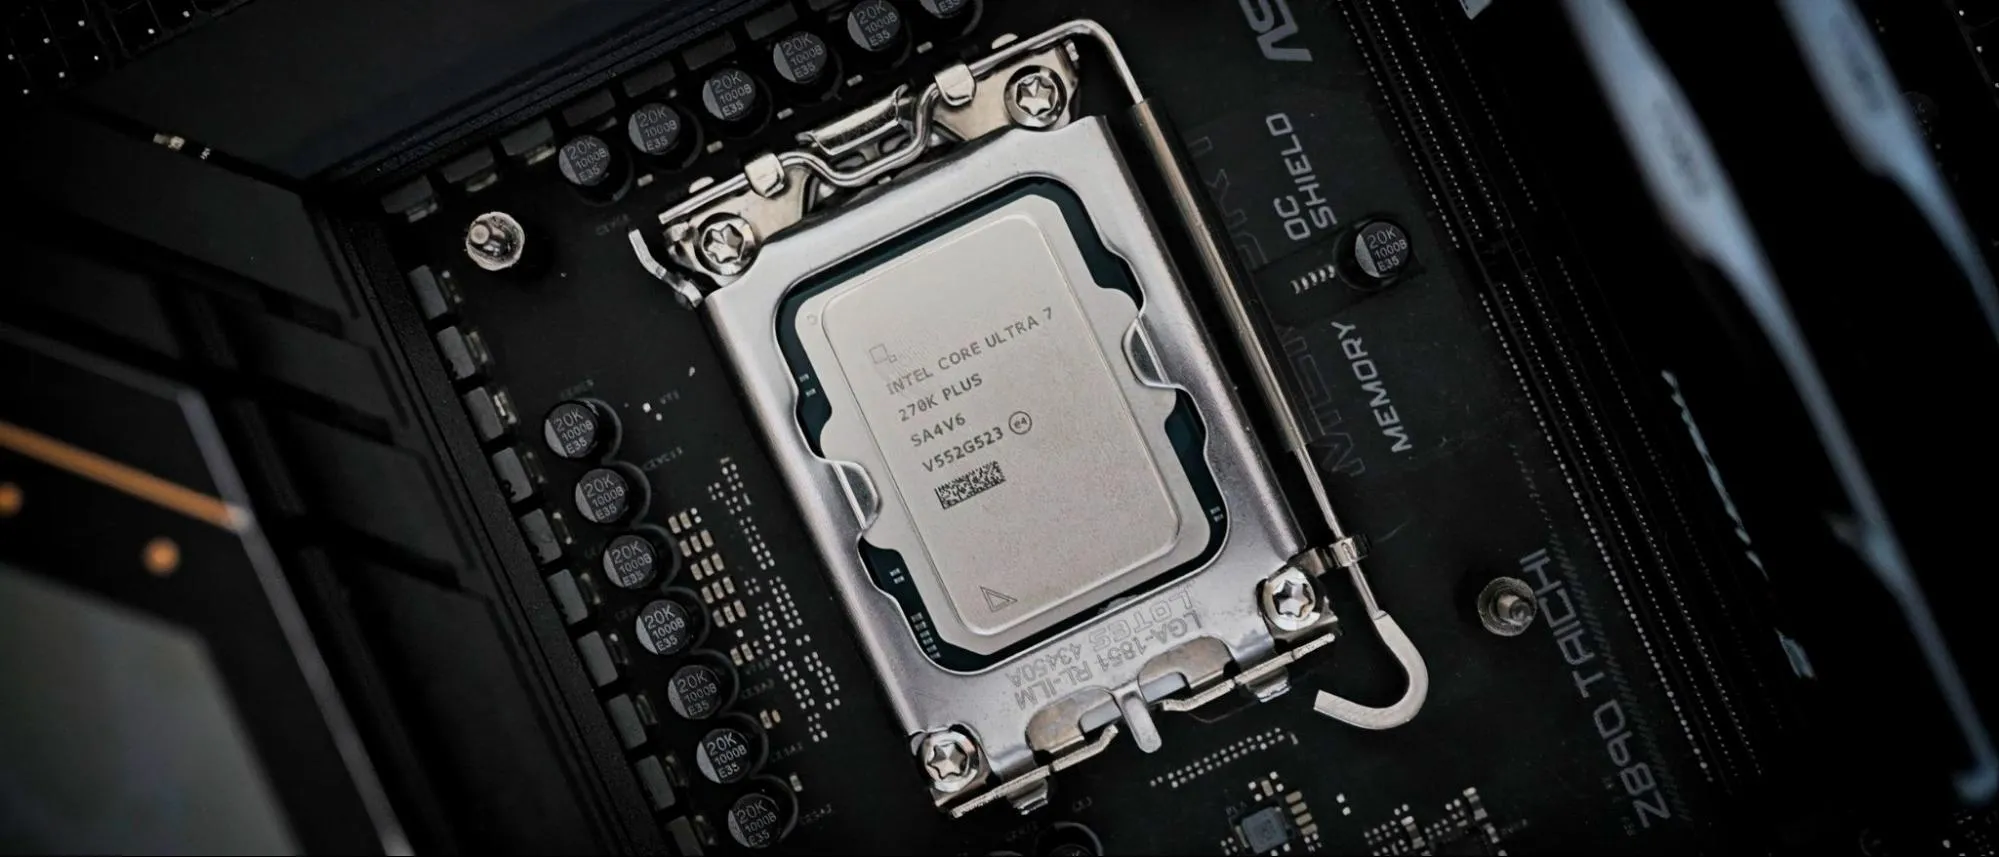
CPU reviews aren’t made equally. They should, and do, follow the same process. I double-check everything on the test bed is the same, run a gauntlet of benchmarks using the same software stack and OS configuration, and spit the results out into various spreadsheets to eventually turn that raw data into hundreds of graphs for you to peruse. But the ups and downs during that process can vary wildly, and I was caught on the extreme end of that variation with Intel’s new Core Ultra 7 270K Plus and Core Ultra 5 250K Plus.
Blindly running benchmarks and throwing the data into a chart is a quick way to come to bunk conclusions. PCs and benchmarks aren’t perfect, and when you run as many benchmarks as we do here at Tom’s Hardware, it’s inevitable that you’ll encounter some strange results. The challenge with Intel's 270K Plus and 250K Plus was that those strange, unbelievable results were actually representative of the real performance of the chips. I spent no less than 50 hours (and probably more) simply rerunning benchmarks on various CPUs because I didn’t believe the results I was seeing.
Swipe to scroll horizontally
CPU | Street (MSRP) | Cores / Threads (P+E) | P-Core Base / Boost (GHz) | E-Core Base / Boost (GHz) | Cache (L2 + L3) | TDP / MTP | Memory |
|---|---|---|---|---|---|---|---|
Core Ultra 9 285K | $530 ($589) | 24 / 24 (8+16) | 3.7 / 5.5 | 3.2 / 4.6 | 76 MB | 125W / 250W | 6400MT/s |
Core Ultra 7 270K Plus | $300 | 24 / 24 (8+16) | 3.7 / 5.4 | 3.2 / 4.7 | 76 MB | 125W / 250W | 7200MT/s |
Core Ultra 7 265K | $270 ($394) | 20 / 20 (8+12) | 3.9 / 5.4 | 3.3 / 4.6 | 66 MB | 125W / 250W | 6400MT/s |
Core Ultra 5 250K Plus | $200 | 18 / 18 (6+12) | 4.2 / 5.3 | 3.3 / 4.6 | 60 MB | 125W / 159W | 7200MT/s |
Core Ultra 5 245K | $200 ($309) | 14 / 14 (6+8) | 4.2 / 5.2 | 3.6 / 4.6 | 50 MB | 125W / 159W | 6400MT/s |
Core Ultra 5 225 | $180 ($246) | 10 / 10 (6+4) | 3.3 / 4.9 | 2.7 / 4.4 | 42 MB | 65W / 121W | 6400MT/s |