


In February–April 2026, we ran a survey of 349 technical workers (including 87 software engineers, 71 researchers, 129 academics and PhD students, and 48 founders and managers) about their usage of AI tools. Compared to previous work, our survey is one of the more detailed surveys of technical workers’ self-reported gains from frontier AI tools.1
We attempt to capture gains due to AI in terms of ‘value’ (how much more value are you creating with AI), rather than ‘speed’ (how long would it have taken you to do these tasks without AI). These can give different answers in principle, in particular if using AI changes the distribution of tasks you work on. For example, researchers could use AI to quickly build an interactive dashboard for their data, which would have taken significantly longer without AI but isn’t that important for their project. We provide more detail on the distinction between value and speed gains in our previous research.
We think that the distinction between ‘value’ and ‘speed’ gains is important because value is closer to the idea that survey designers typically care about, whereas our sense is that it is common for respondents to think in terms of speed, and we expect that speed changes would typically overstate value changes. See methodological details here.
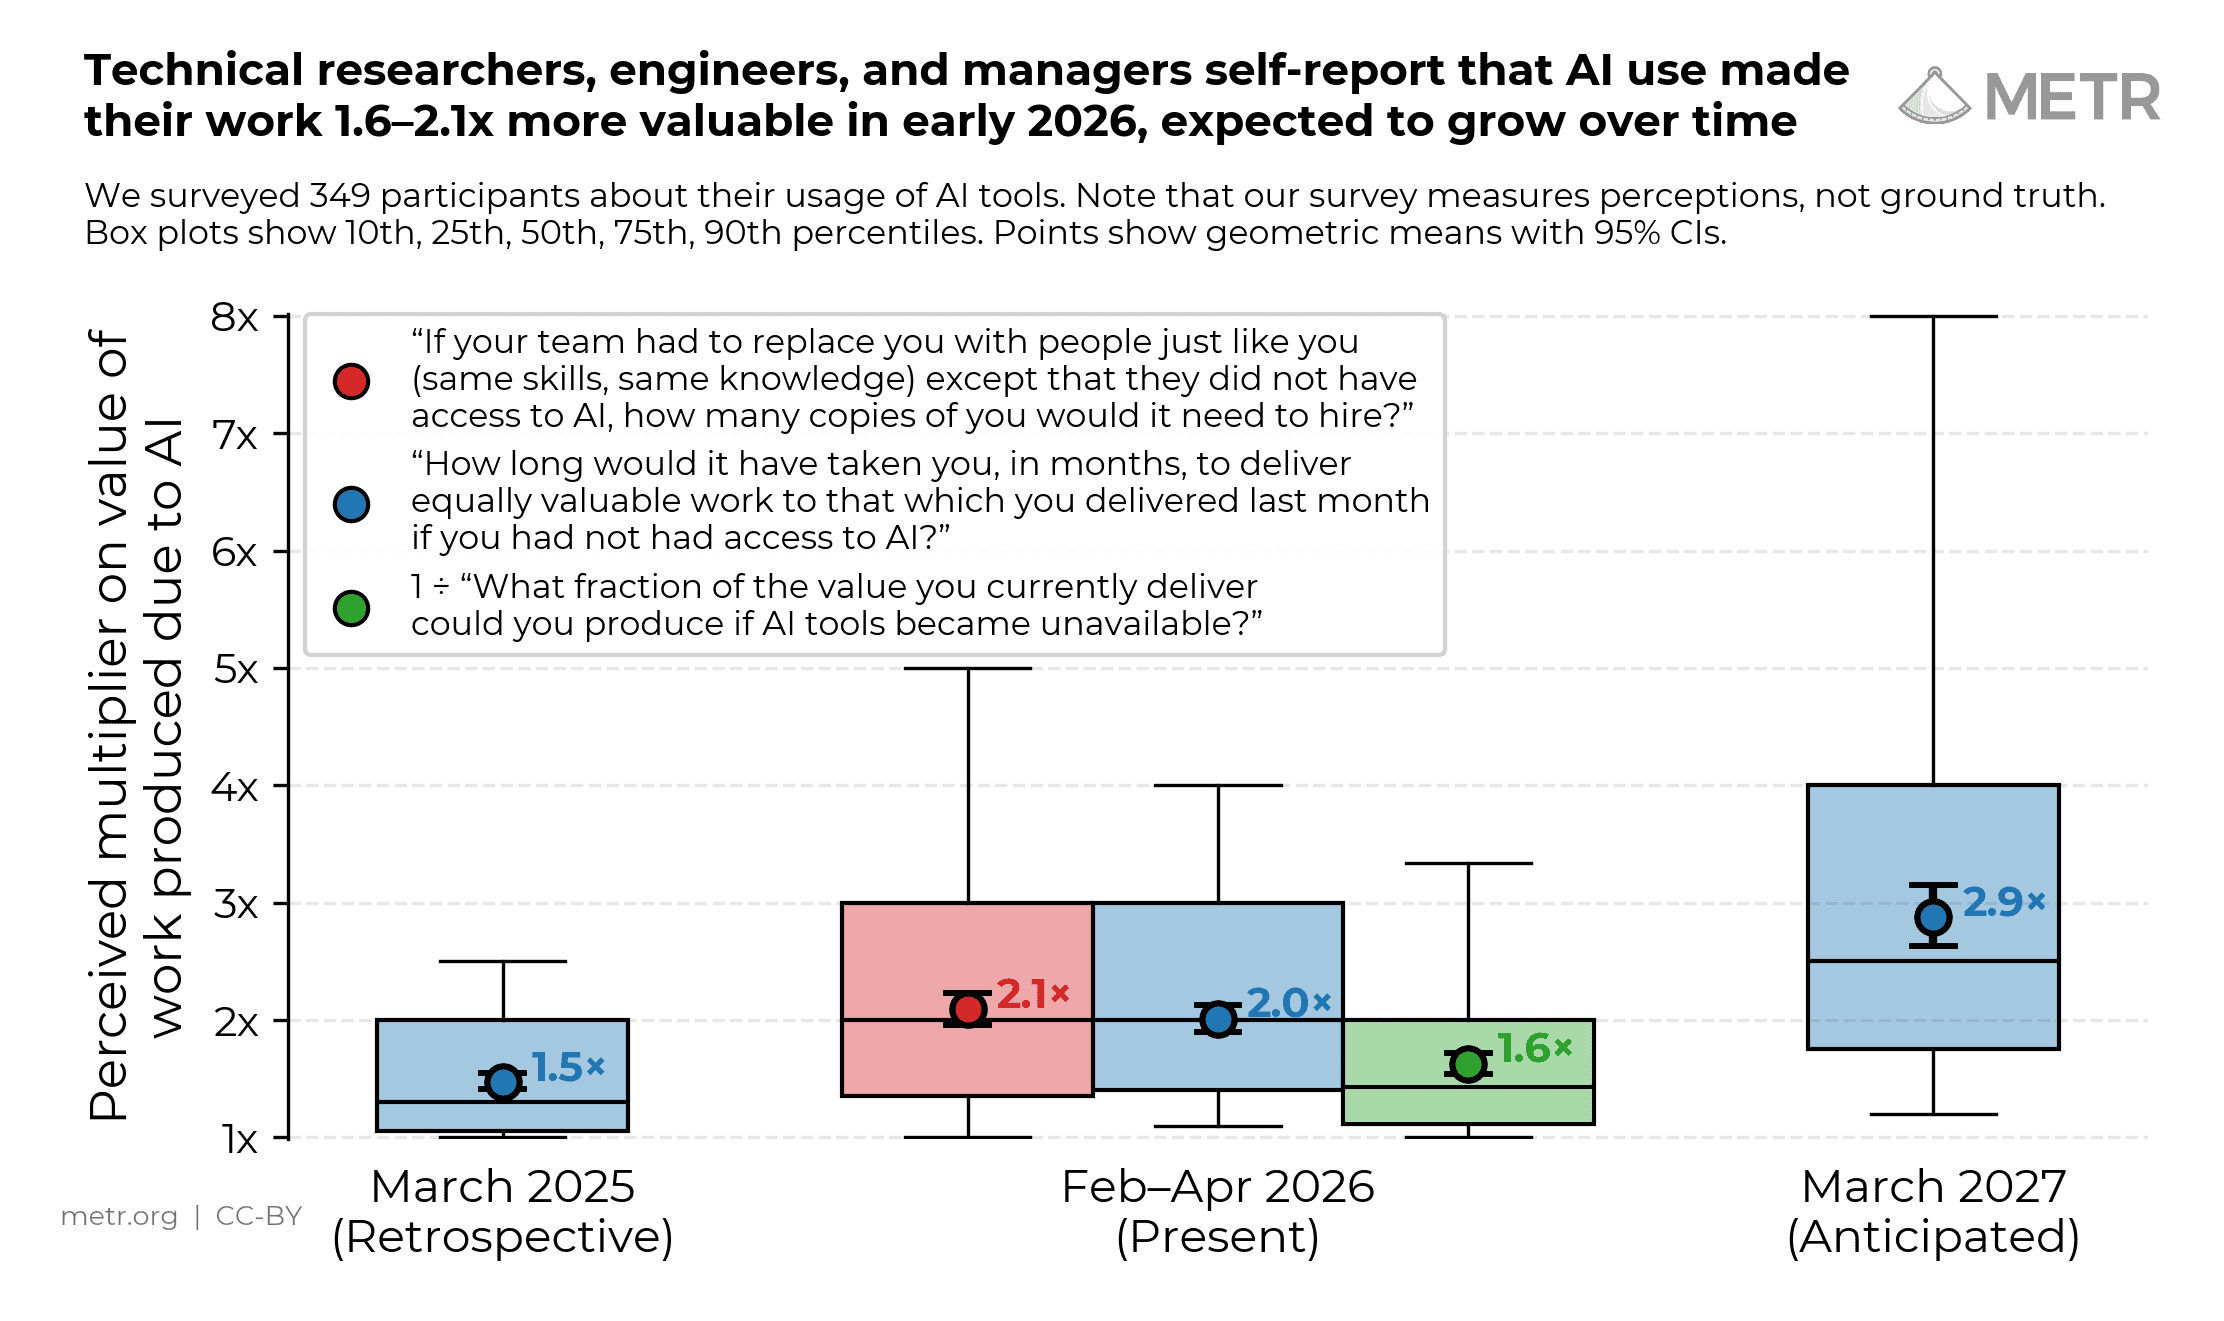
See detailed results here.
Importantly, survey results are not necessarily grounded in reality. There are reasons to be skeptical of people’s responses to counterfactual questions such as about AI’s effect on productivity — for instance, our study in early 2025 found that people overestimated AI’s effect on their time spent on tasks by 40 percentage points on average.
More broadly, public estimates of productivity impacts from surveys have tended to be greater than those from field experiments or quasi-experiments. However, it is difficult to determine the extent to which surveys overestimate productivity gains relative to experimental data.2
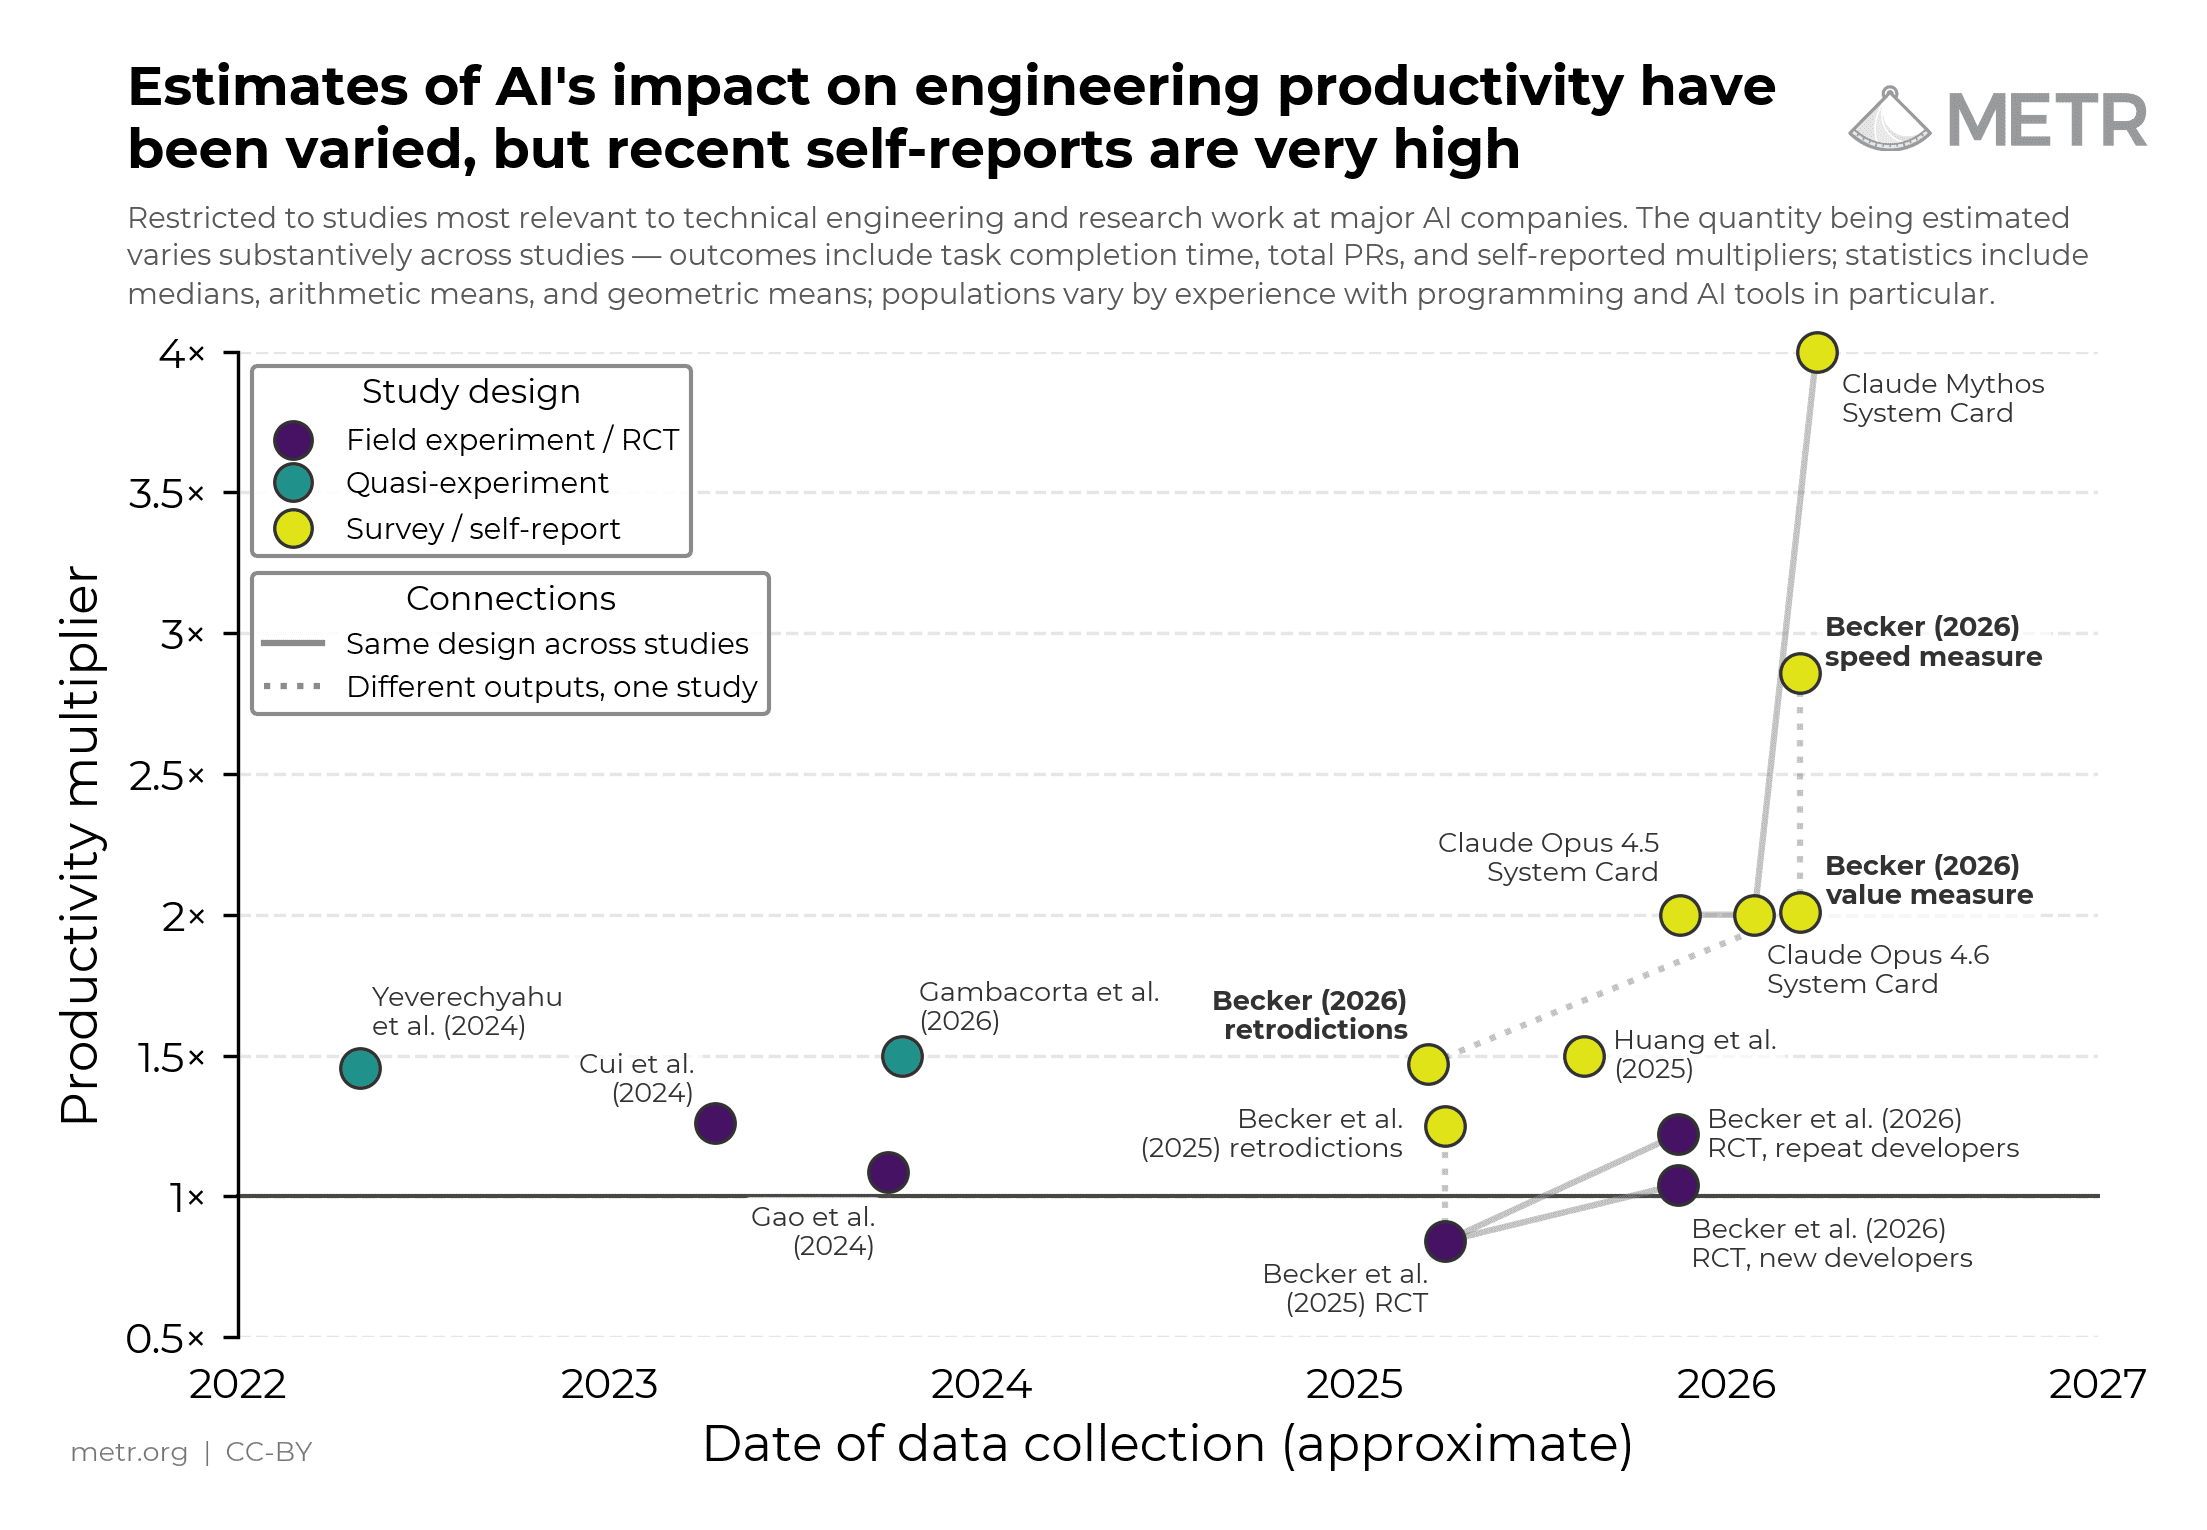
Nevertheless, we think that surveys provide a useful source of information about the true impact of AI on productivity. Surveys complement other evidence on AI capabilities – benchmarks, RCTs, data from wide deployment – each with different blind spots (more detail here). Surveys are cheap, broad, and straightforward to run inside major AI companies. Surveys can also obtain information about some types of questions that would be otherwise intractable (e.g. qualitative questions).
We would like to see those interested in tracking the potential automation of AI R&D, such as frontier AI companies, run high-quality surveys building on this work. We particularly recommend carefully defining the metric to be estimated, such as by building on the survey questions discussed here. We also suggest prioritizing surveying managers or productivity researchers over individual contributors. See more detailed recommendations here.
Different sources of evidence on AI capabilities come with different pros and cons. For example:
We think of surveys as a flawed but useful complement to other forms of evidence on AI capabilities. As discussed in the summary, surveys have problems – most severely, that respondents have difficulty answering complex quantitative questions accurately – but they are cheap to run and can be used to study some types of questions that would be otherwise intractable.
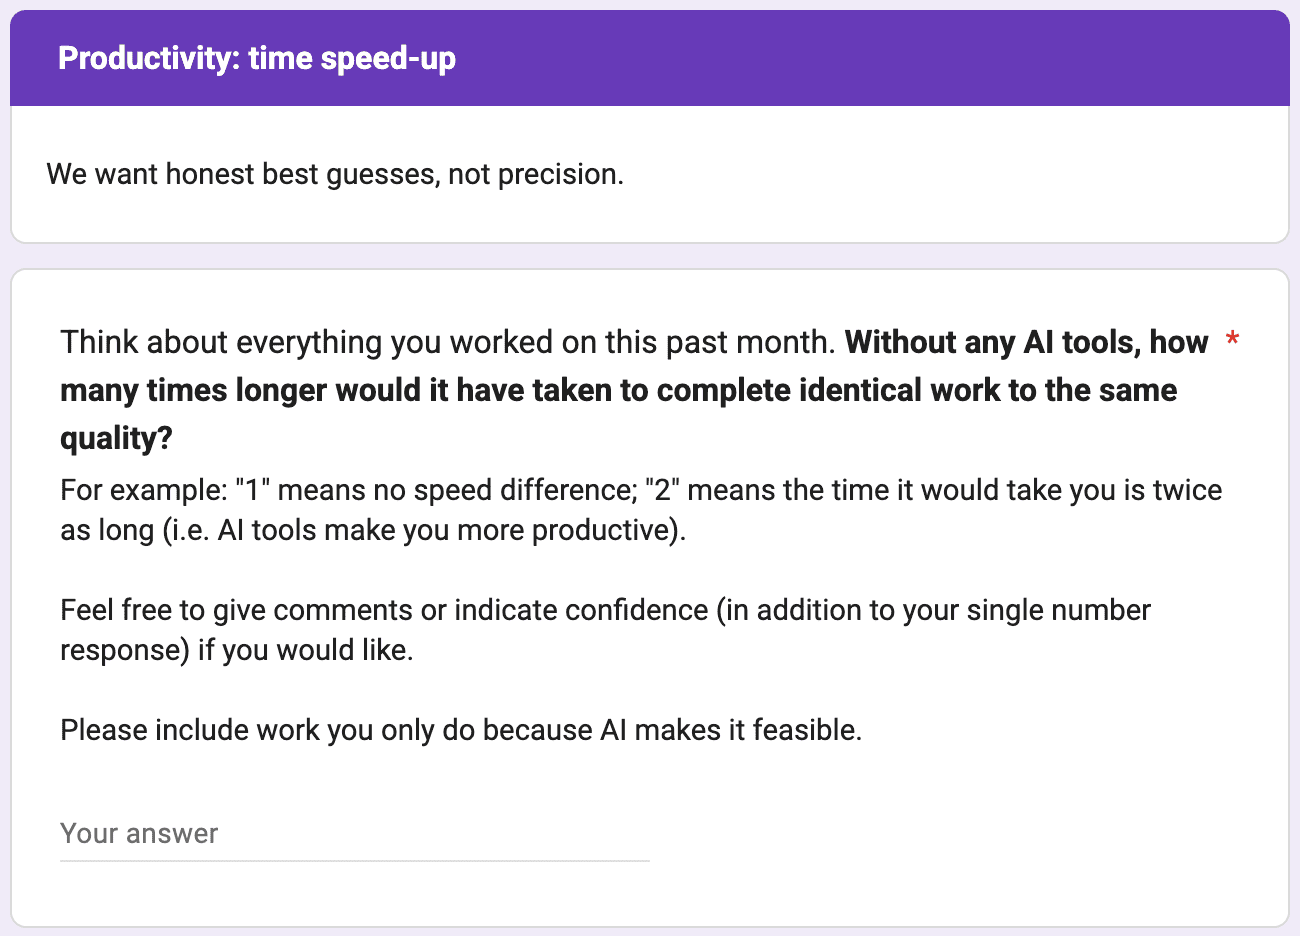
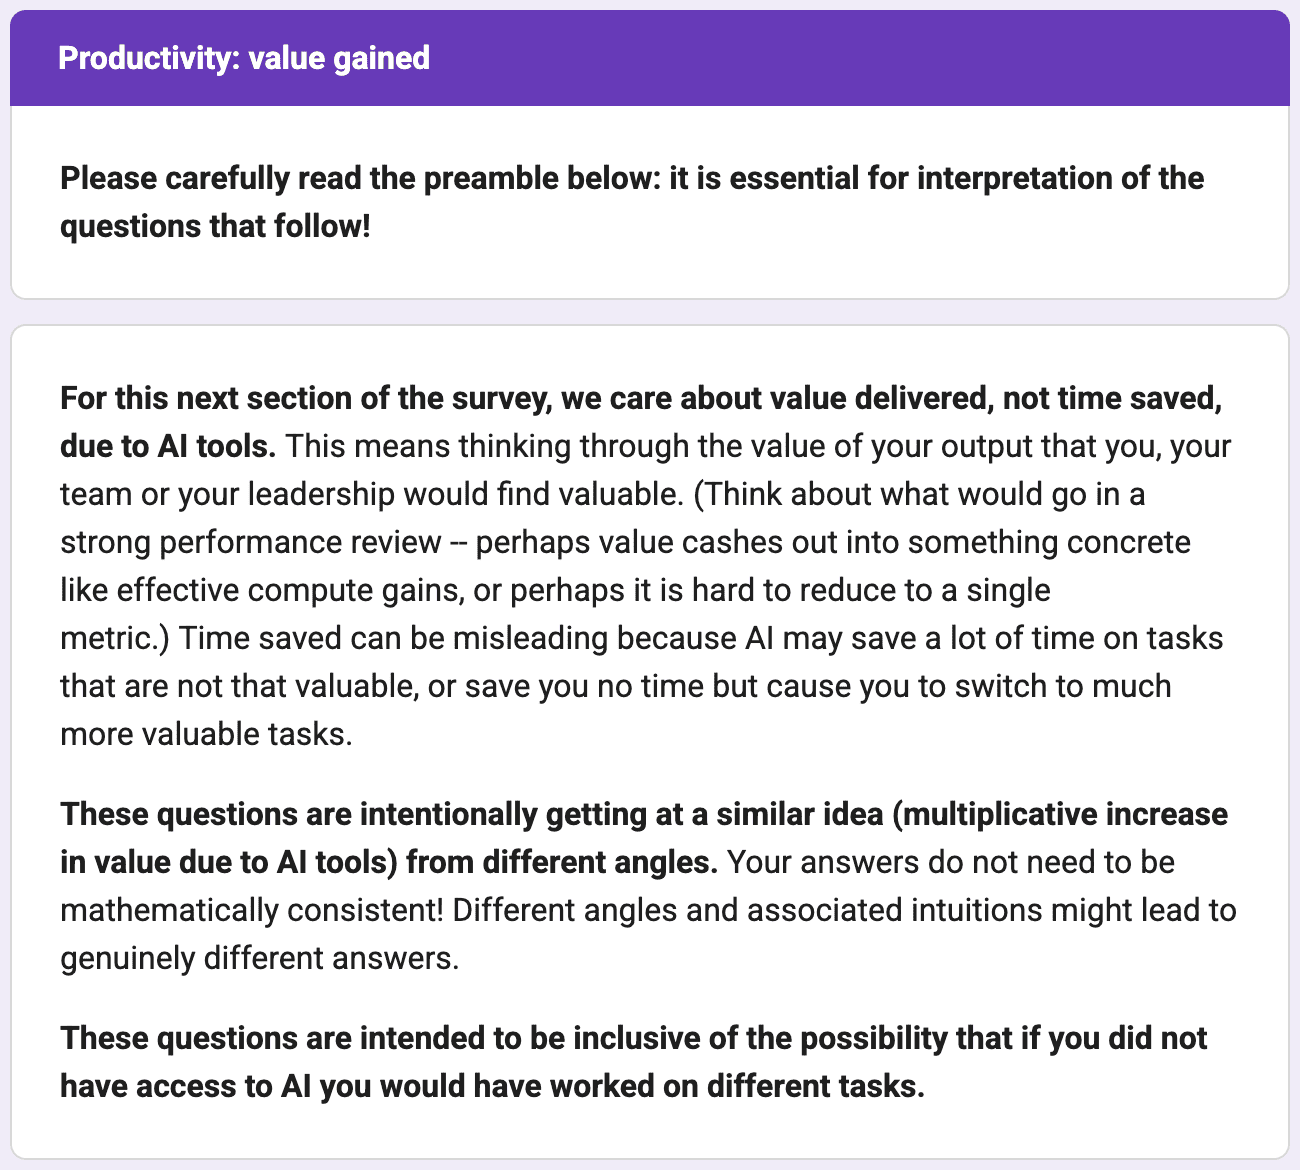
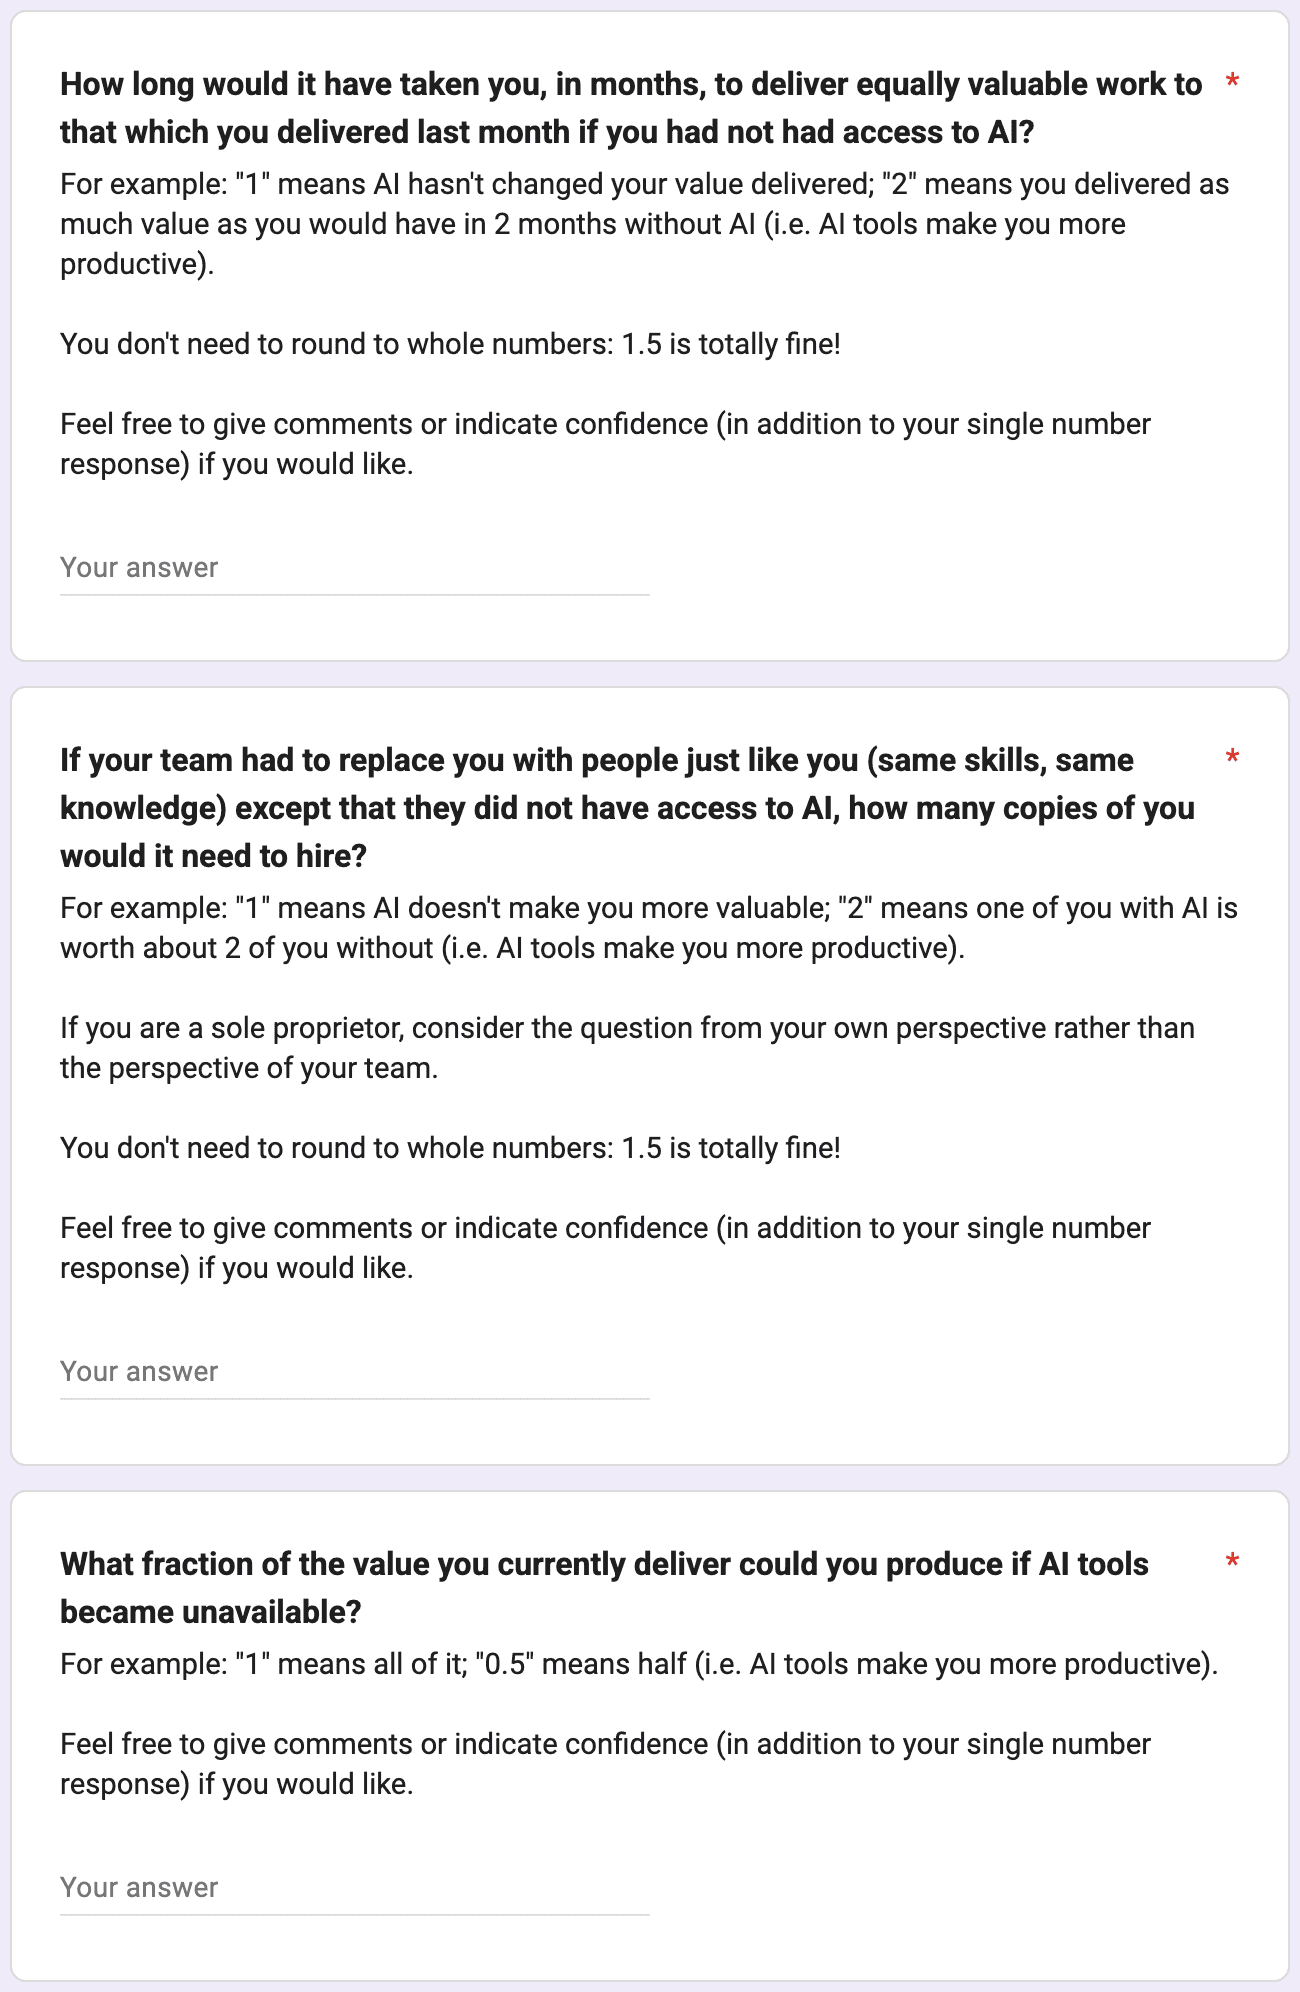
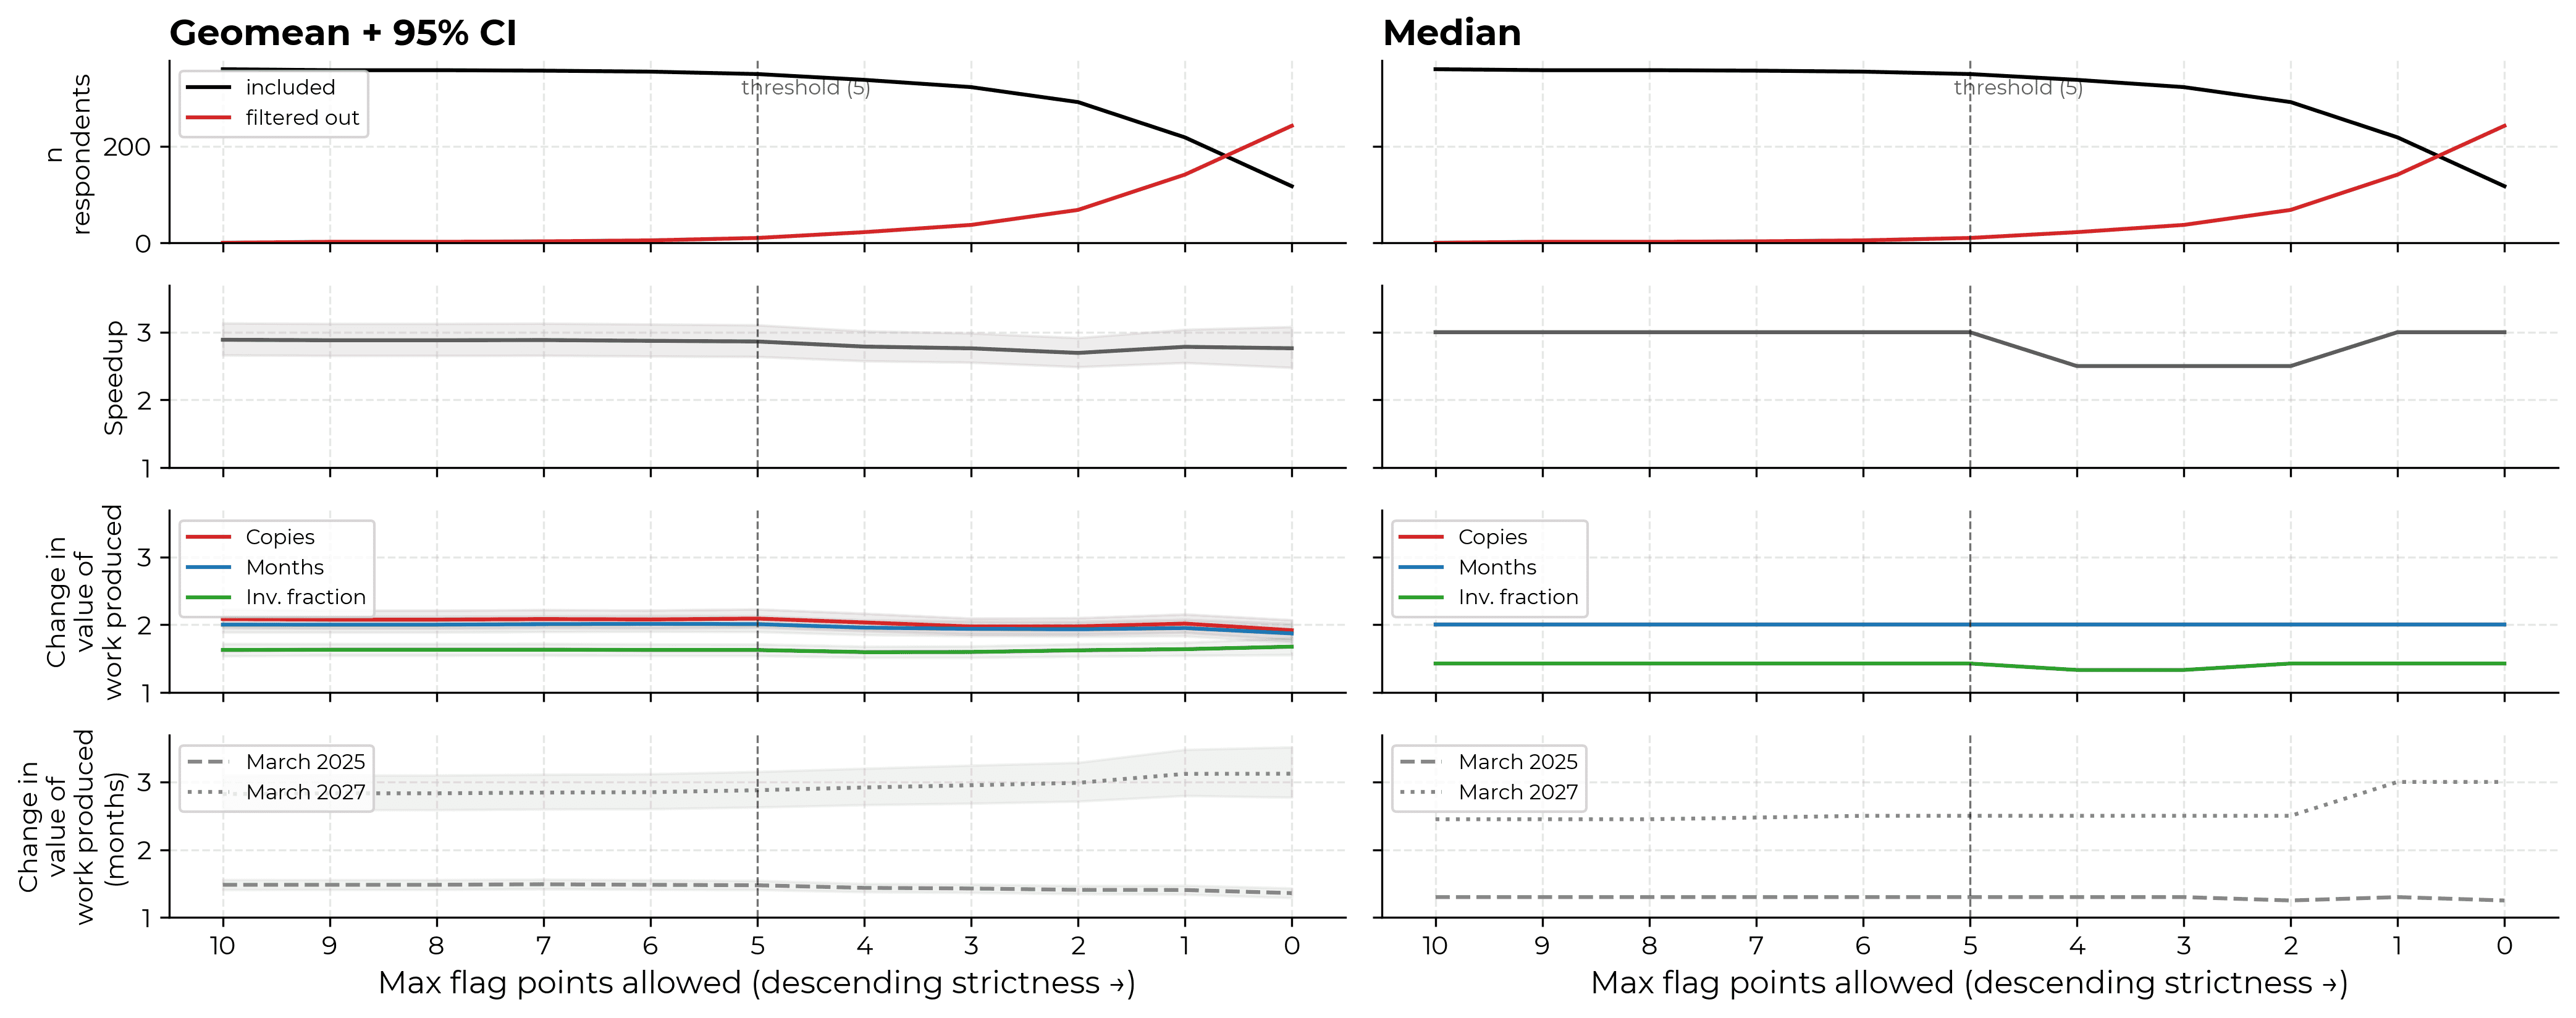
Here is the survey. Take it if you want! The key questions are:
The full questions details are in the appendices.
The survey additionally asks of respondents:
This survey is larger-scale and more detailed than past surveys of frontier AI tool usage like those used by Anthropic.
One innovation in our survey is attempting to distinguish between ‘value’ and ‘speed’ uplift. Value is defined holistically, in terms of what “you, your team or your leadership would find valuable”. Speed is instead the raw difference in how long tasks take.5 We elaborate on the distinction between value and speed gains in previous research.
Speed measures may differ from value measures by, for example:
We think value as defined in this survey is materially closer to what we care about – a multiplier on employee contribution to AI R&D progress. Speed measures are likely biased upwards with respect to value measures; however, value is also more opaque and harder for respondents to think about.67
Another innovation is attempting to triangulate the truth using measures of internal consistency. We use multiple measures and check for consistency.8 However, these checks are not decisive, and, more fundamentally, even when reporting on the internal consistency of perceptions we have little means to test whether perceptions match reality.
Participants come from a convenience sample. They were largely sourced from GitHub, academics via institutional or conference directories, METR, METR staff’s professional networks, and X (formerly twitter). Response rates are typically low – approximately 2% for respondents we email, although very significantly higher among METR staff and their networks – so our results plausibly suffer from significant selection bias.9 Approximately 70% of participants were paid to take the survey (per-hour or fixed payment); of participants who were paid, average pay is $200.
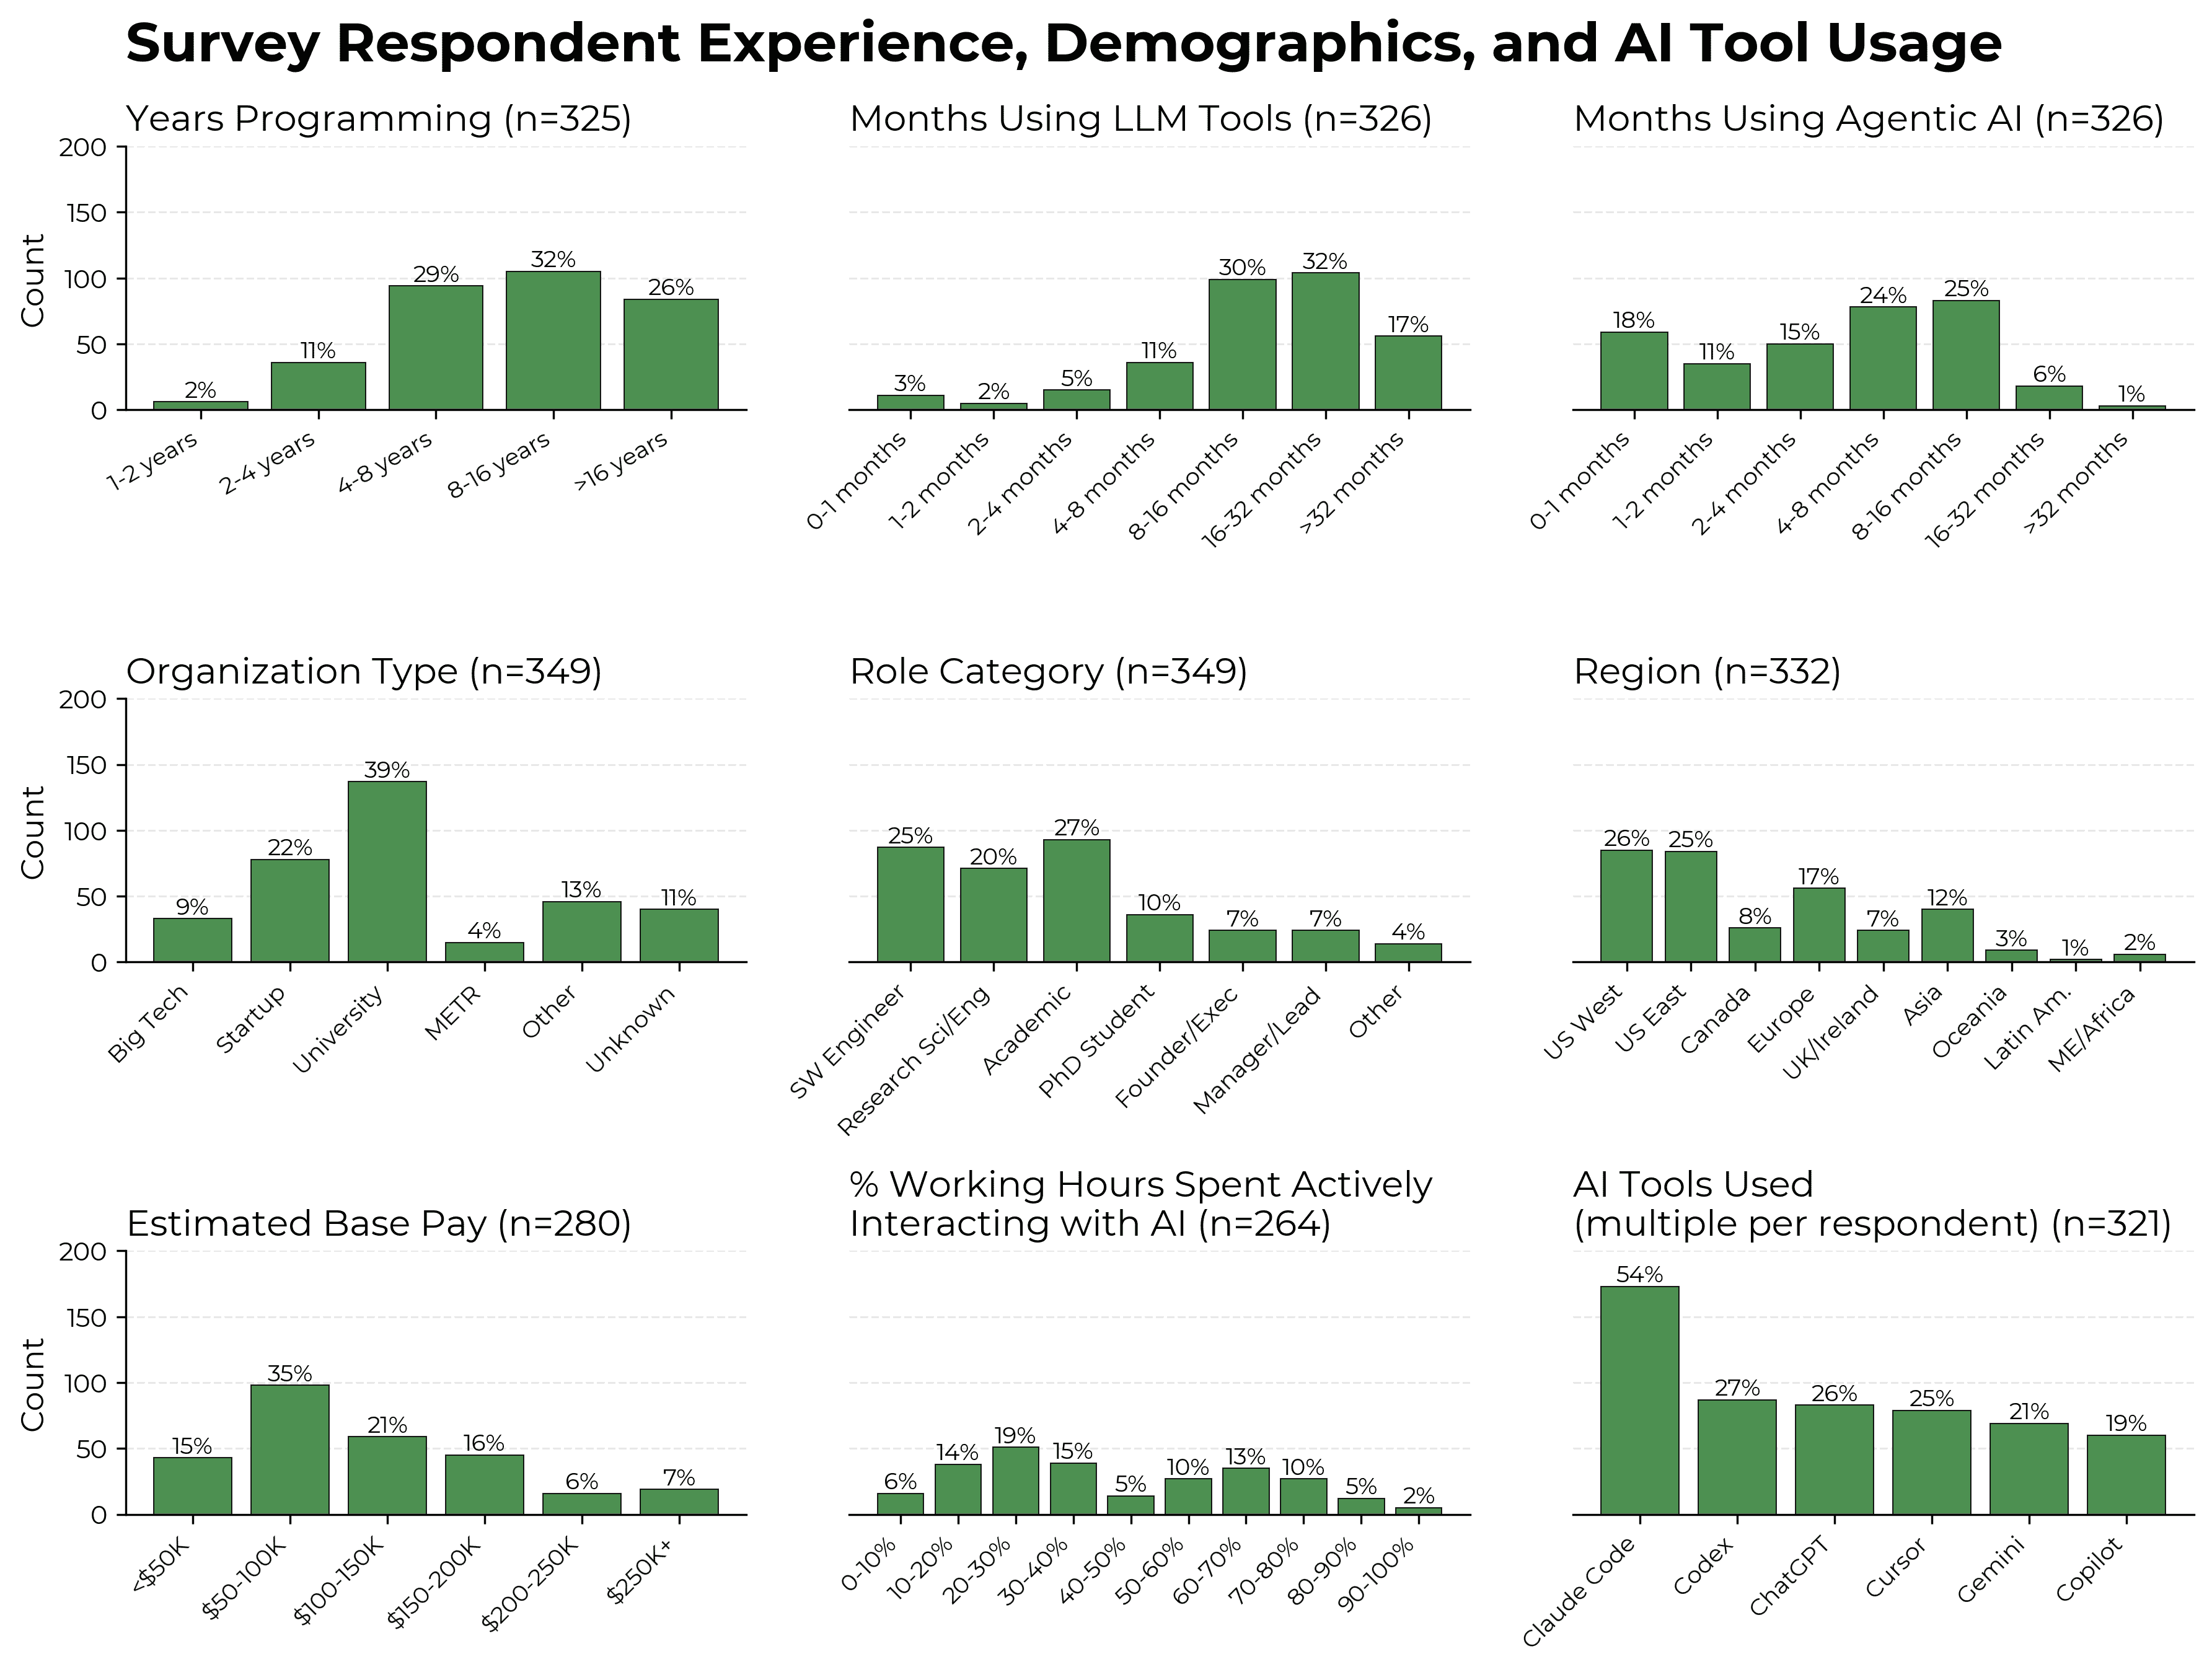
Respondents averaged 12 years programming, 19 months using AI for programming, and 7 months using agentic AI coding tools. 48% are US-based. 50% regularly use Claude Code. Academics and PhD students represent 37% of the sample. Around half of respondents are based in the US and one-quarter in Europe.
In a later section, we display some evidence for higher perceived uplift among people who currently use AI more, are more experienced using AI tools, or work at startups; we see lower perceived uplift among METR employees.
We flag answers that suggest poor data quality (extreme inconsistencies between questions, logical impossibilities, etc.) and filter out 10 respondents who have many flagged responses. See anomalies section for more information.
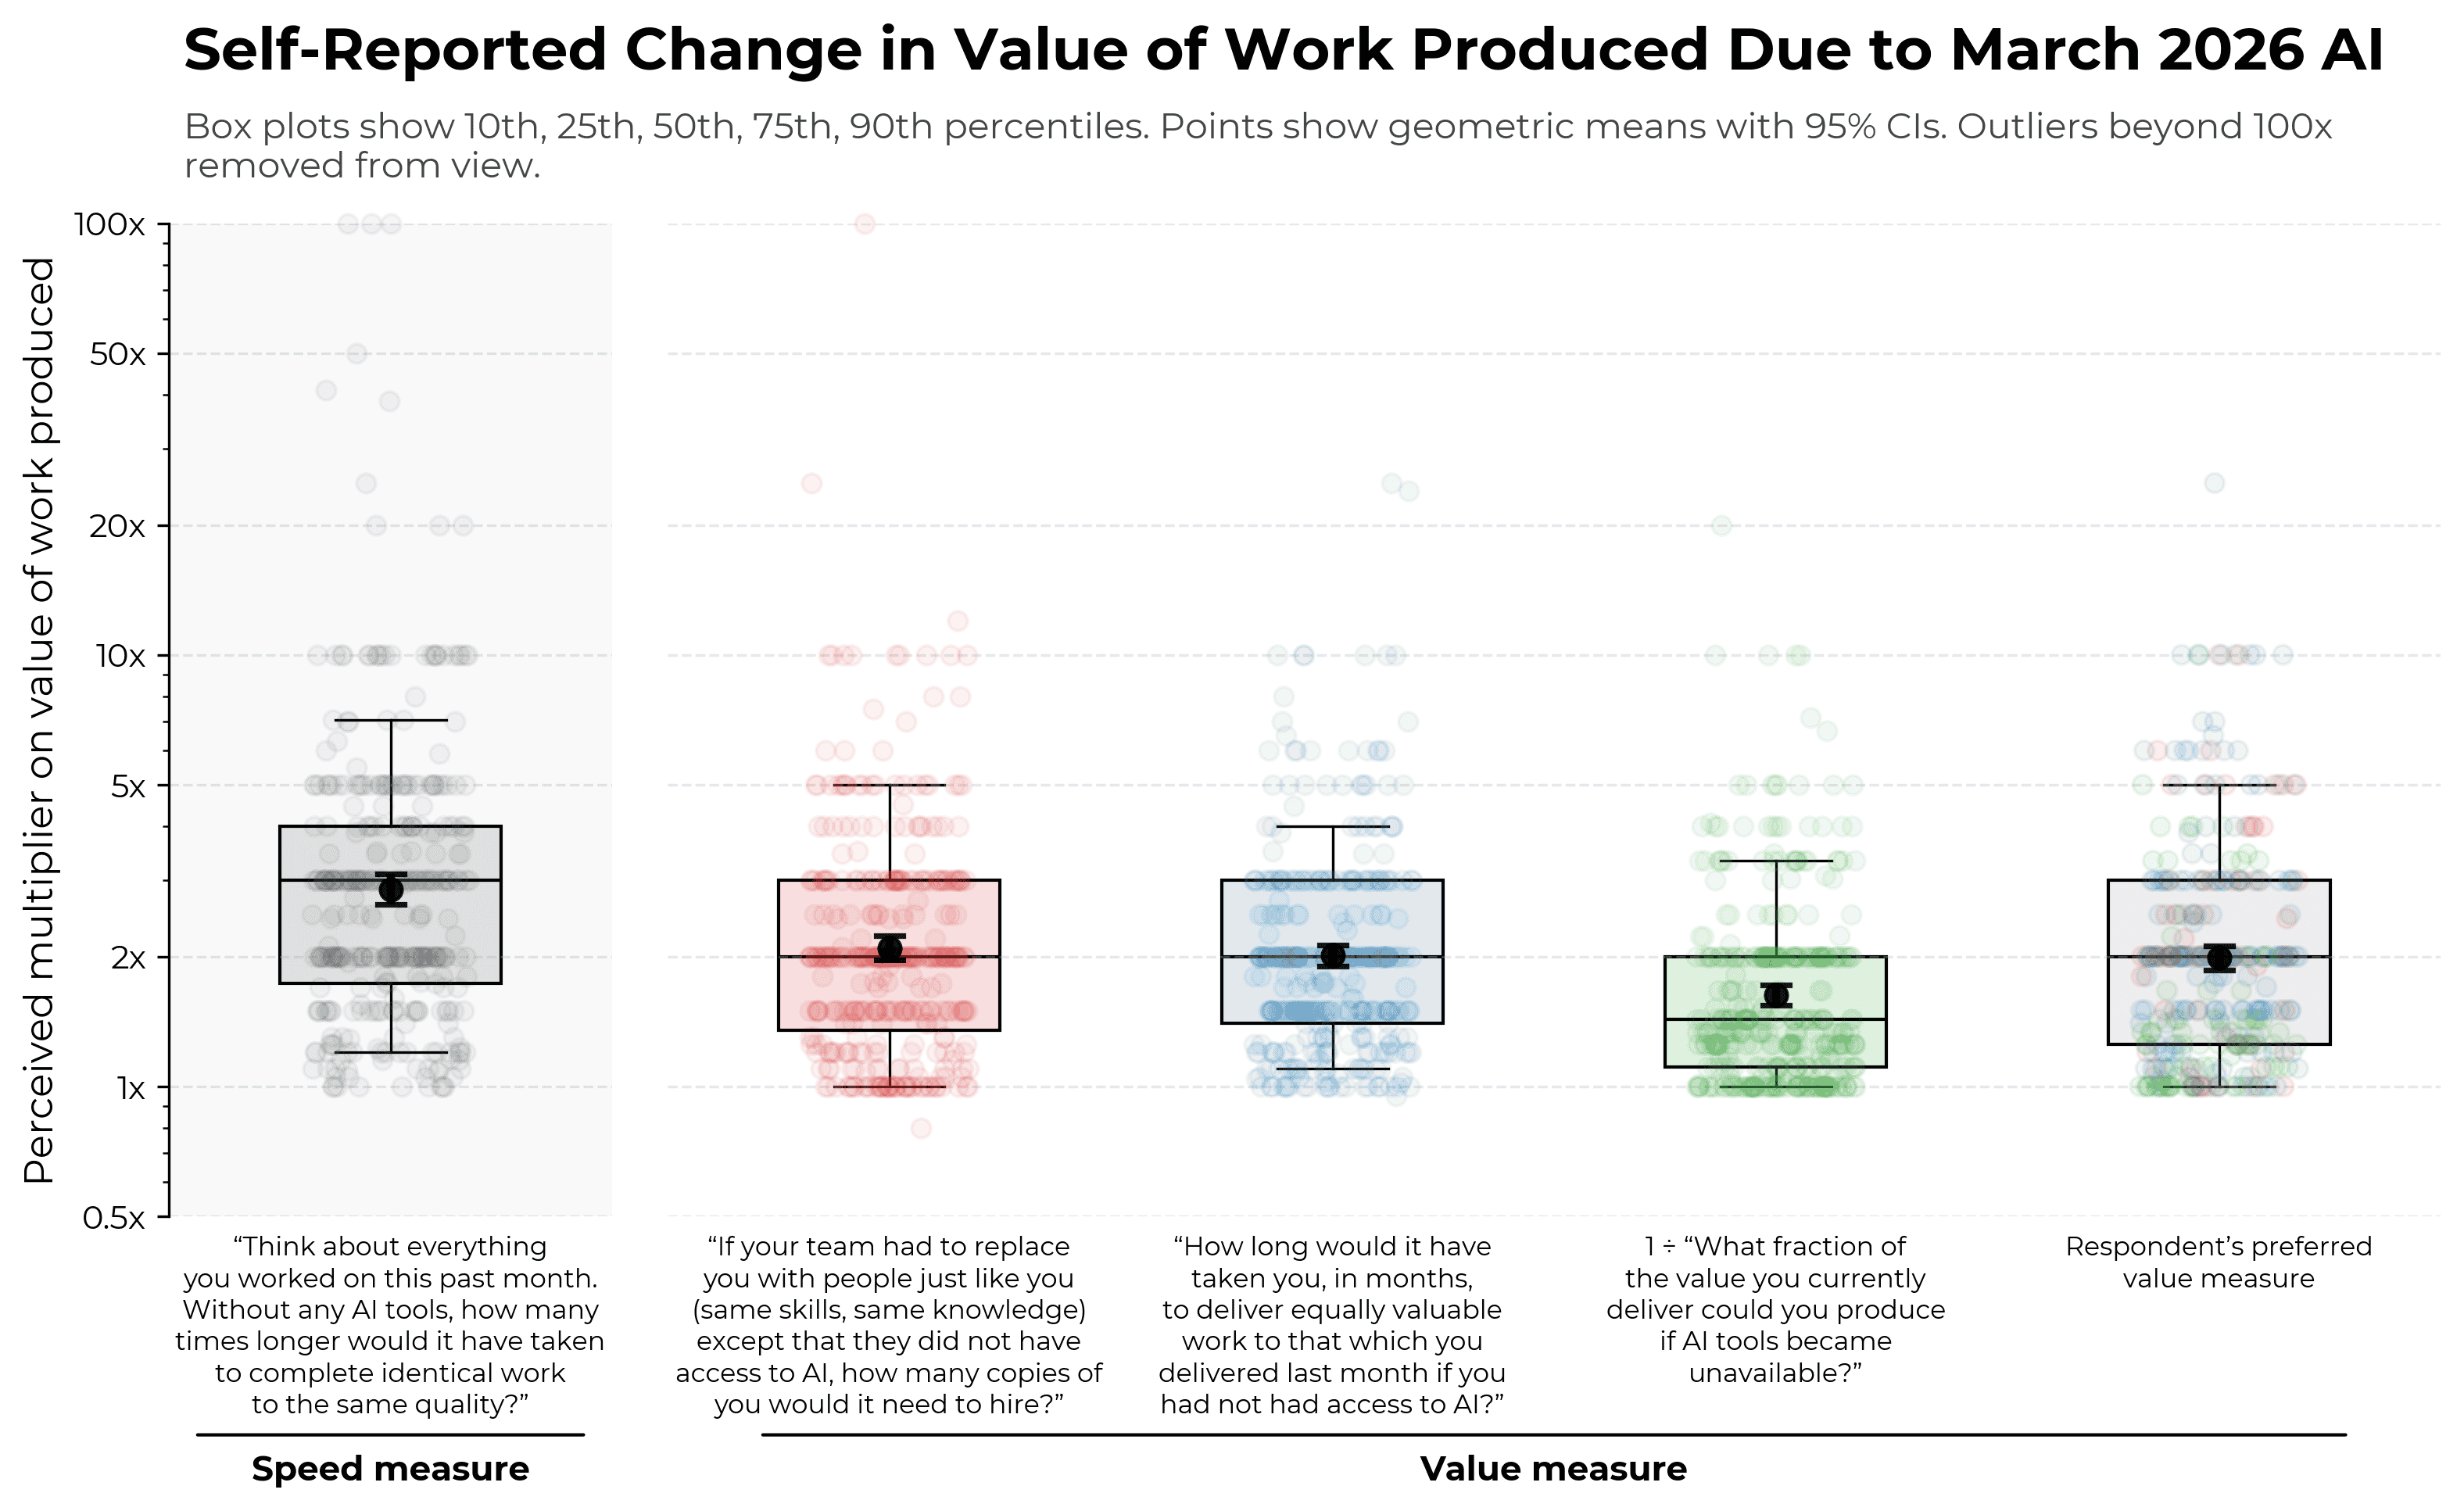
Our 3 measures of value uplift have medians between 1.4x and 2x.10
We are surprised by the ordering of value uplift results. The “fraction of the value” question was intended to be specified so that answers should be approximately equivalent to the reciprocal of the “how long would it have taken you” question, but we see a meaningful discrepancy between answers to each question. On the other hand, we anticipated that answers to the “how many copies” question would naturally be larger than answers to the “how long would it have taken you” question due to costs of parallelizing across people, but we do not find this to obviously be the case in respondents’ answers.
We find it less surprising that answers to the speed measure, which considers the change in time it takes to complete tasks after AI is available, are larger in magnitude. We had hypothesized (following our earlier research differentiating speed and value uplift) that AI users were substituting into lower-value tasks which had become much ‘cheaper’ as a result of AI, causing them to get less value out of AI usage than one might naively expect before accounting for changes in the task distribution.11
Note that different respondents find different versions of the value uplift question most intuitive; results are broadly similar if we use whichever answer they gave to their preferred question.
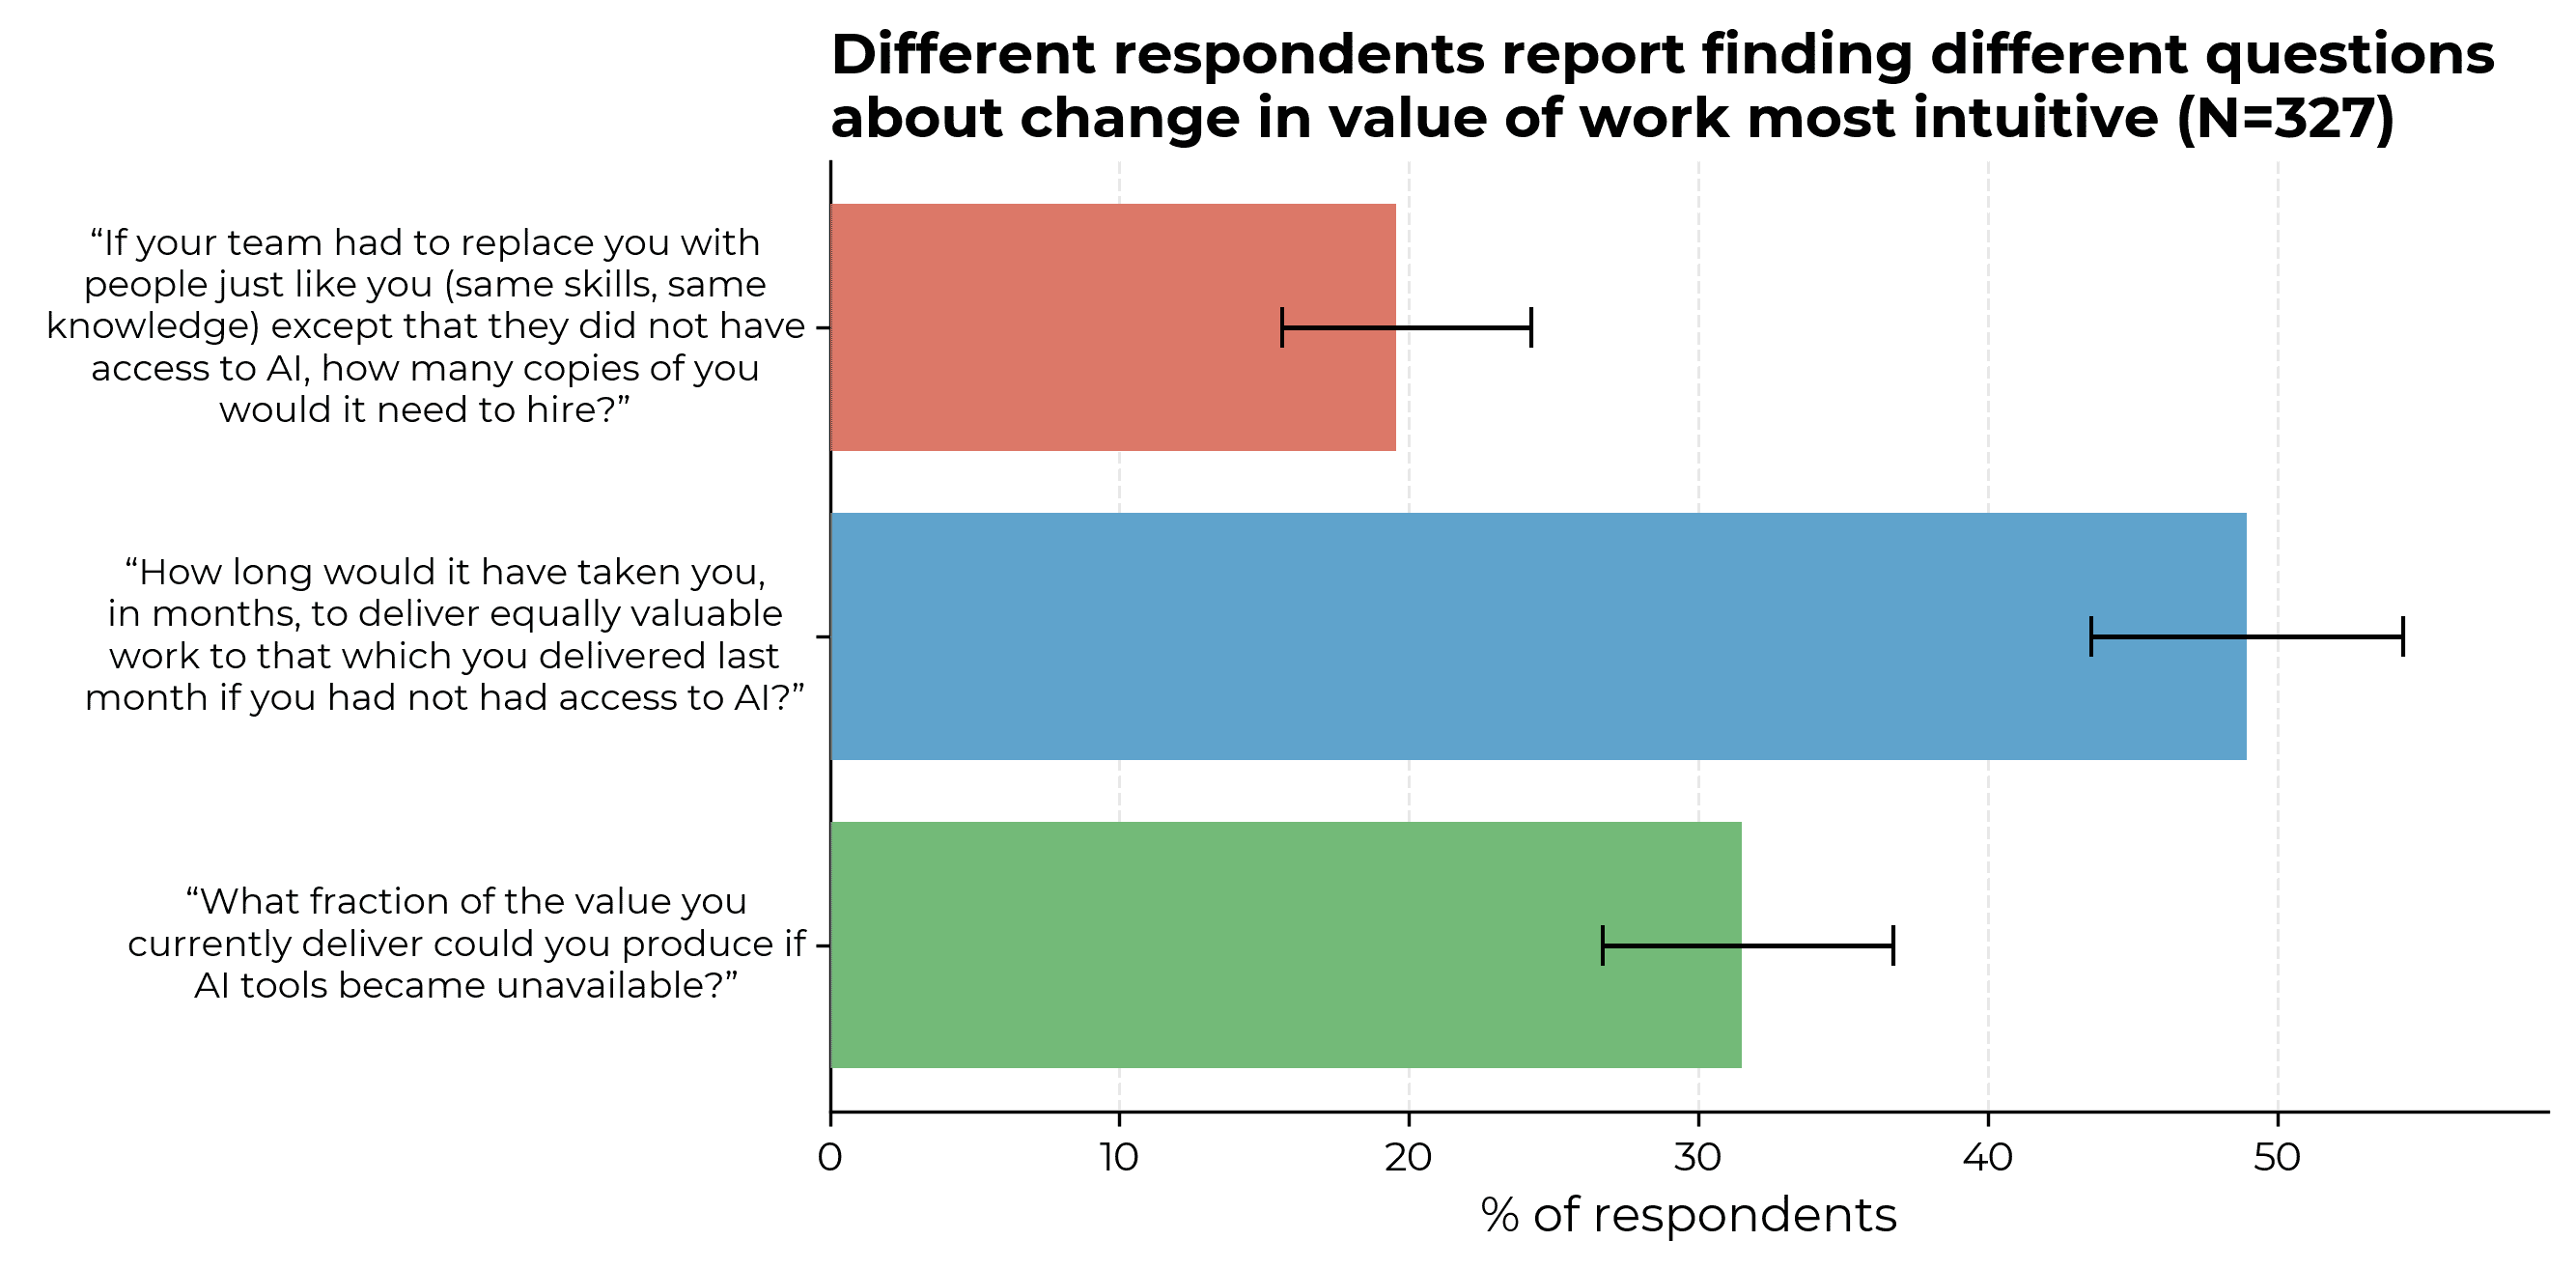
We asked value uplift questions in several different ways partly for imperfect consistency checks, and partly because we found early on that, as above, different respondents find different versions of the value uplift question most intuitive.
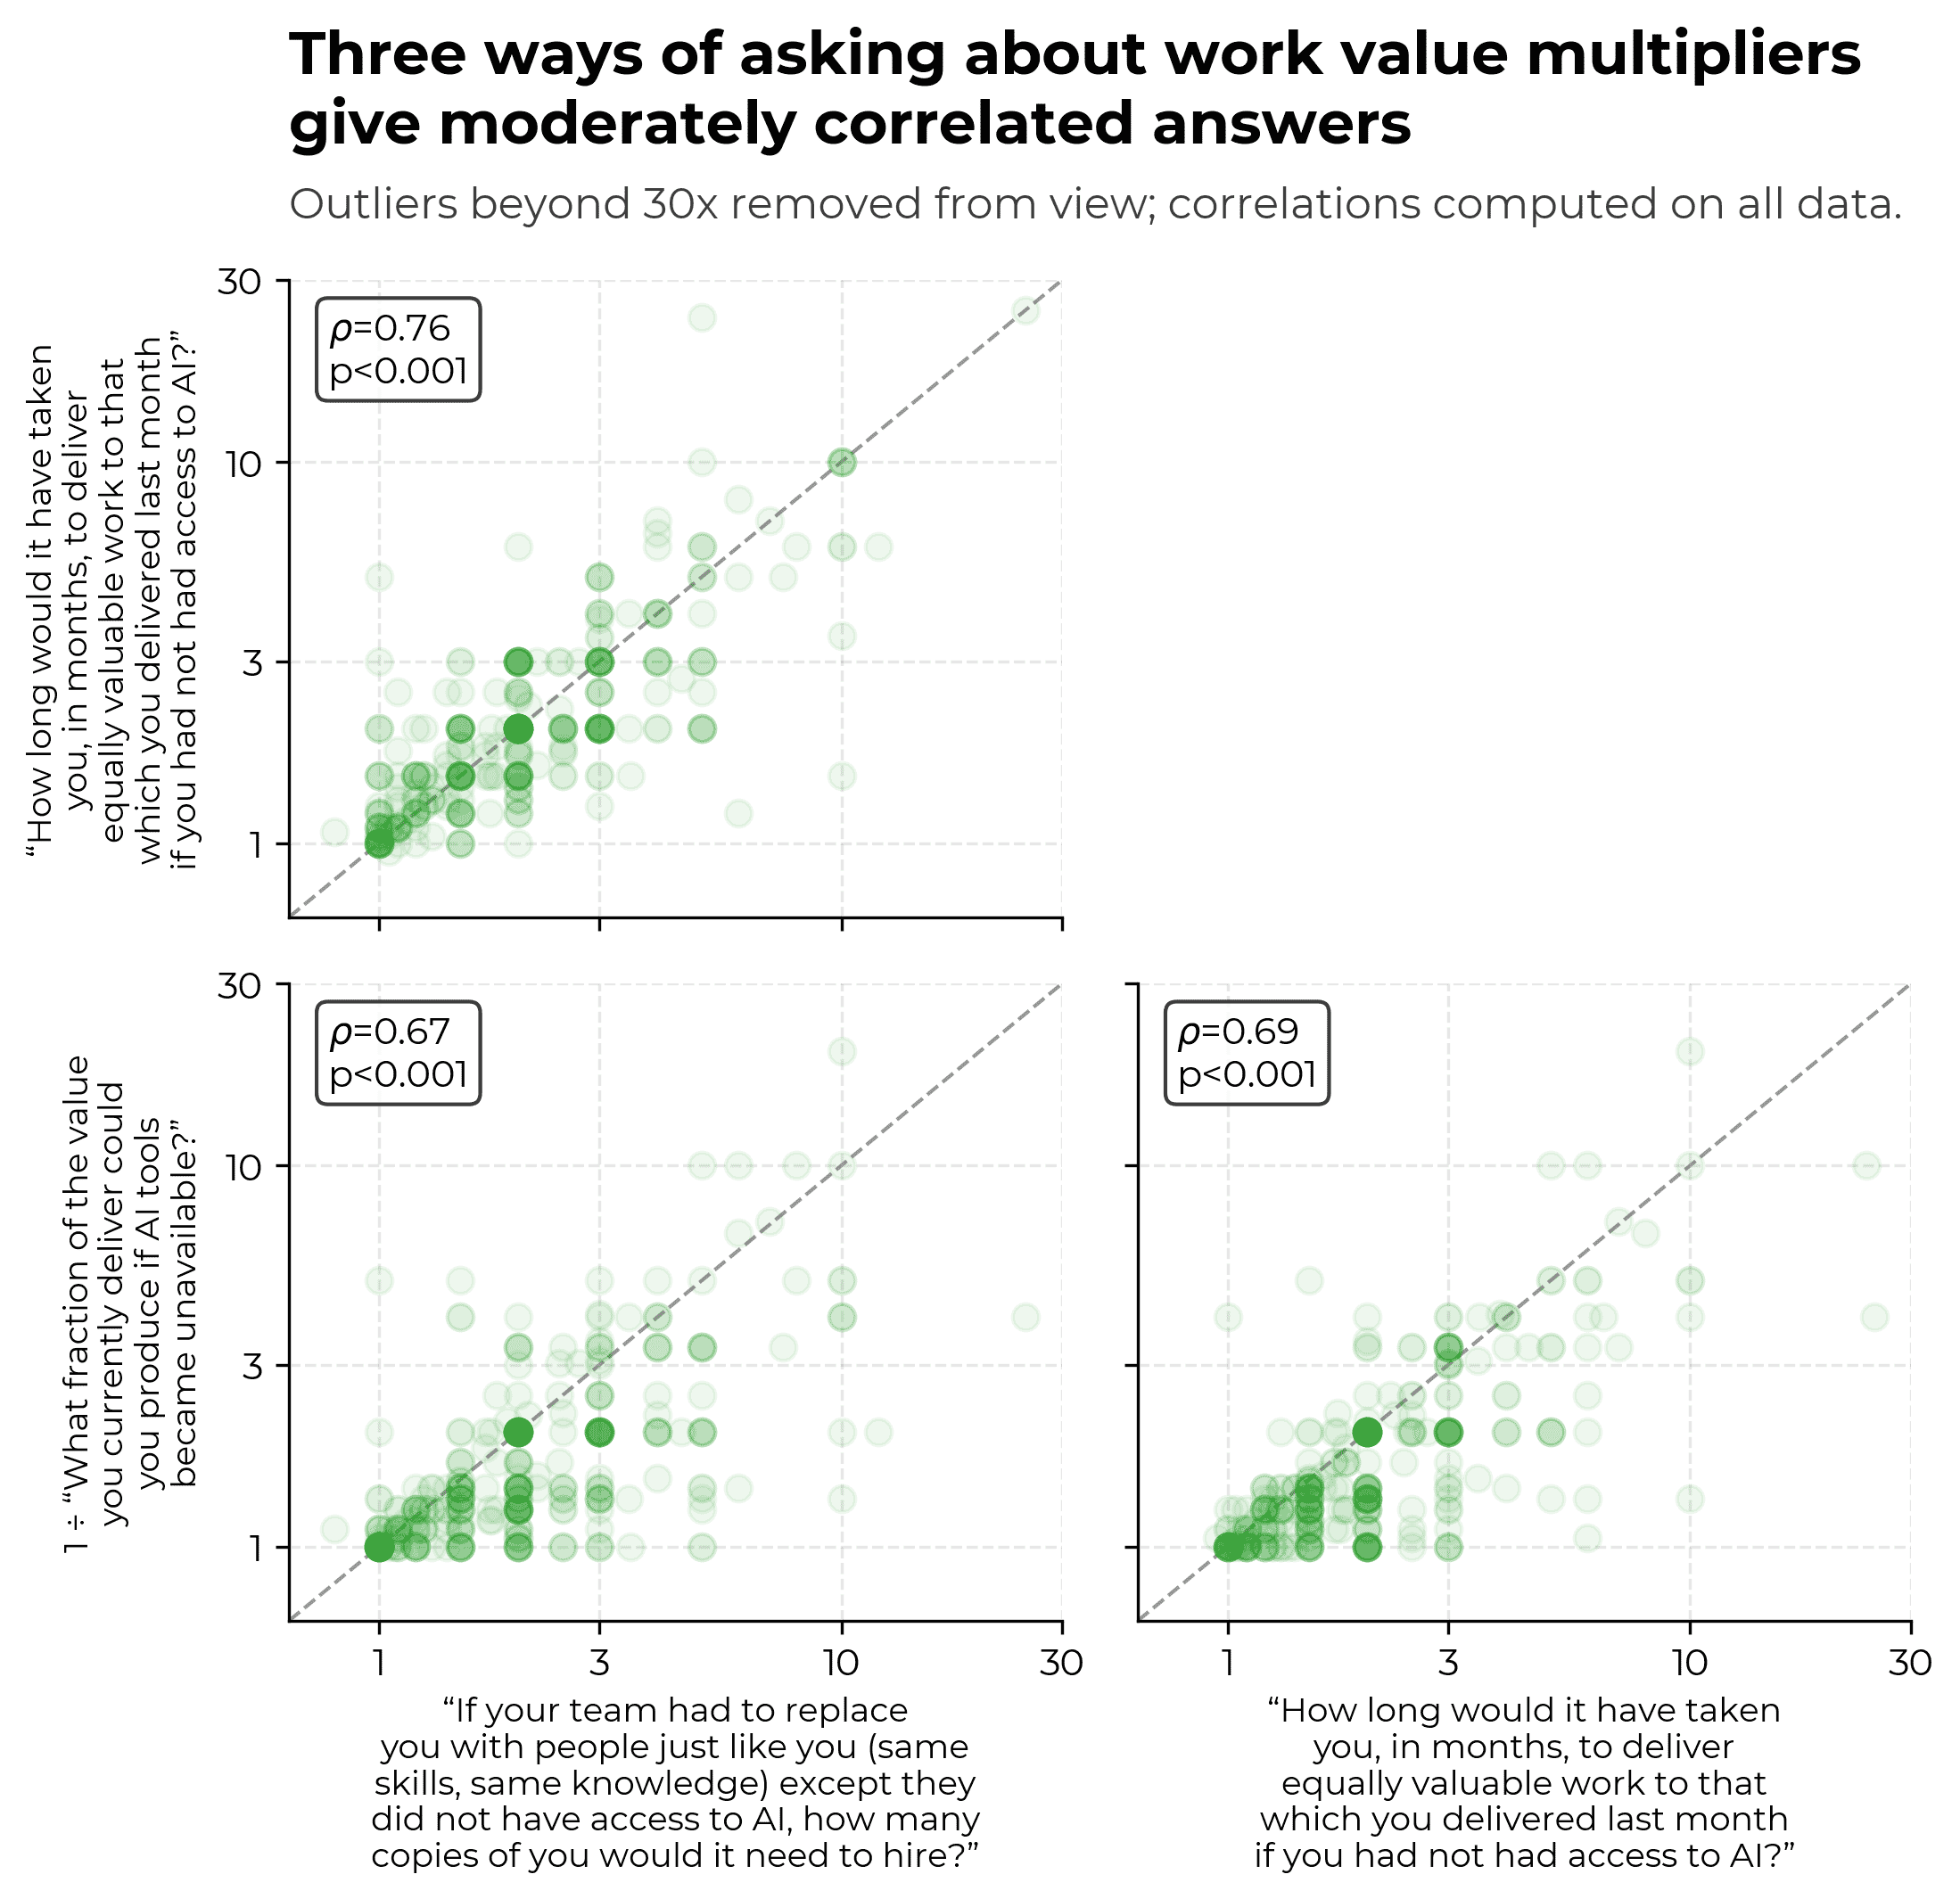
Note that it’s not necessarily straightforward to interpret differences in answers between questions as a consistency check (although we do largely have this interpretation):
Given the above, we should expect different value measures to be correlated but not perfectly so, which is what we see in the data.
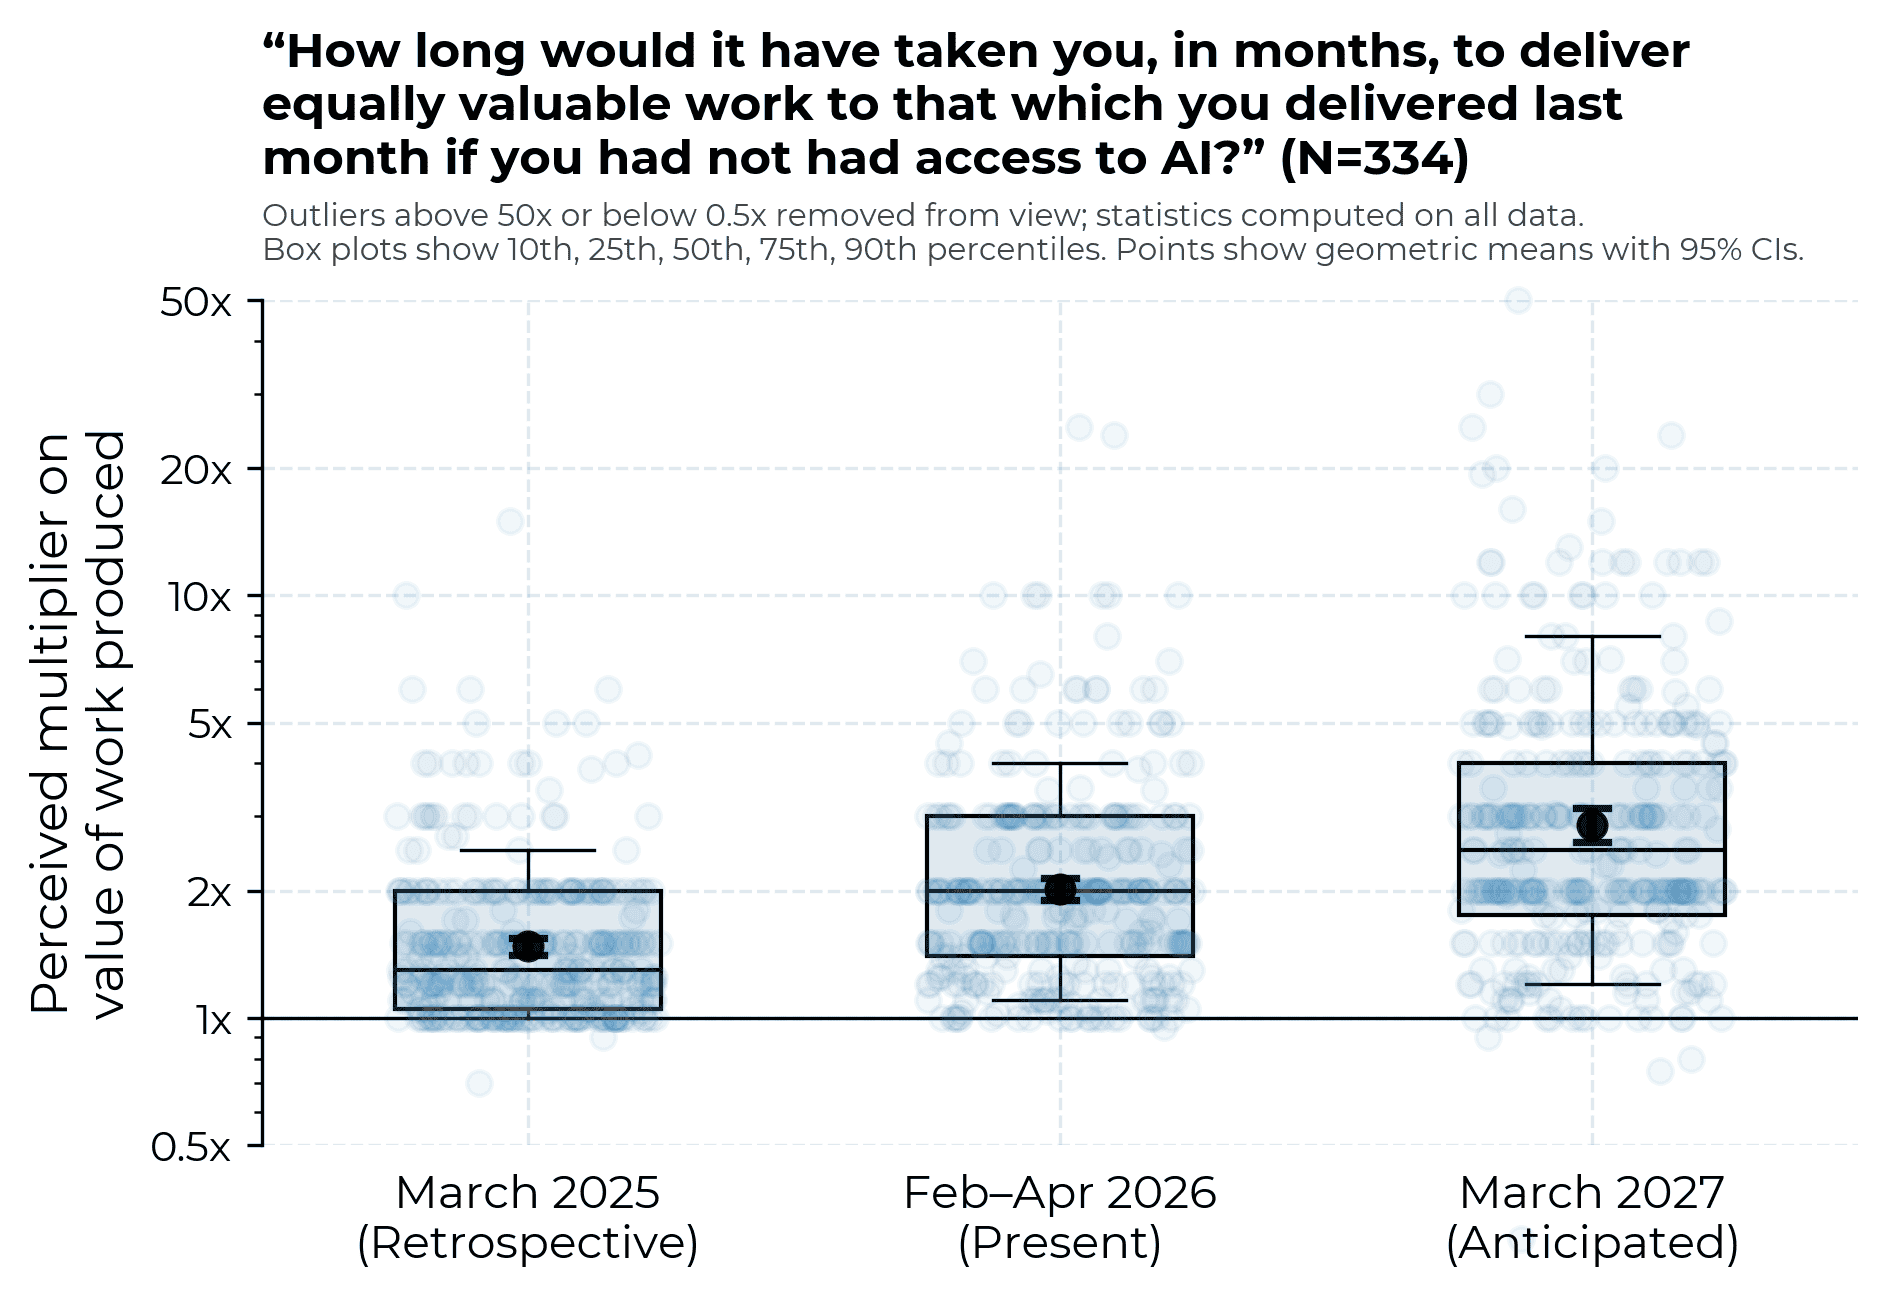
The median respondent retrospectively claims that their uplift was around 1.3x in March 2025; they expect 2.5x in 2027.
We think that averages this high are plausible estimates of typical participant beliefs. The values for March 202512 and today13 are consistent with past self-reports in public research, and we find that participants are at least moderately self-consistent in their survey answers.
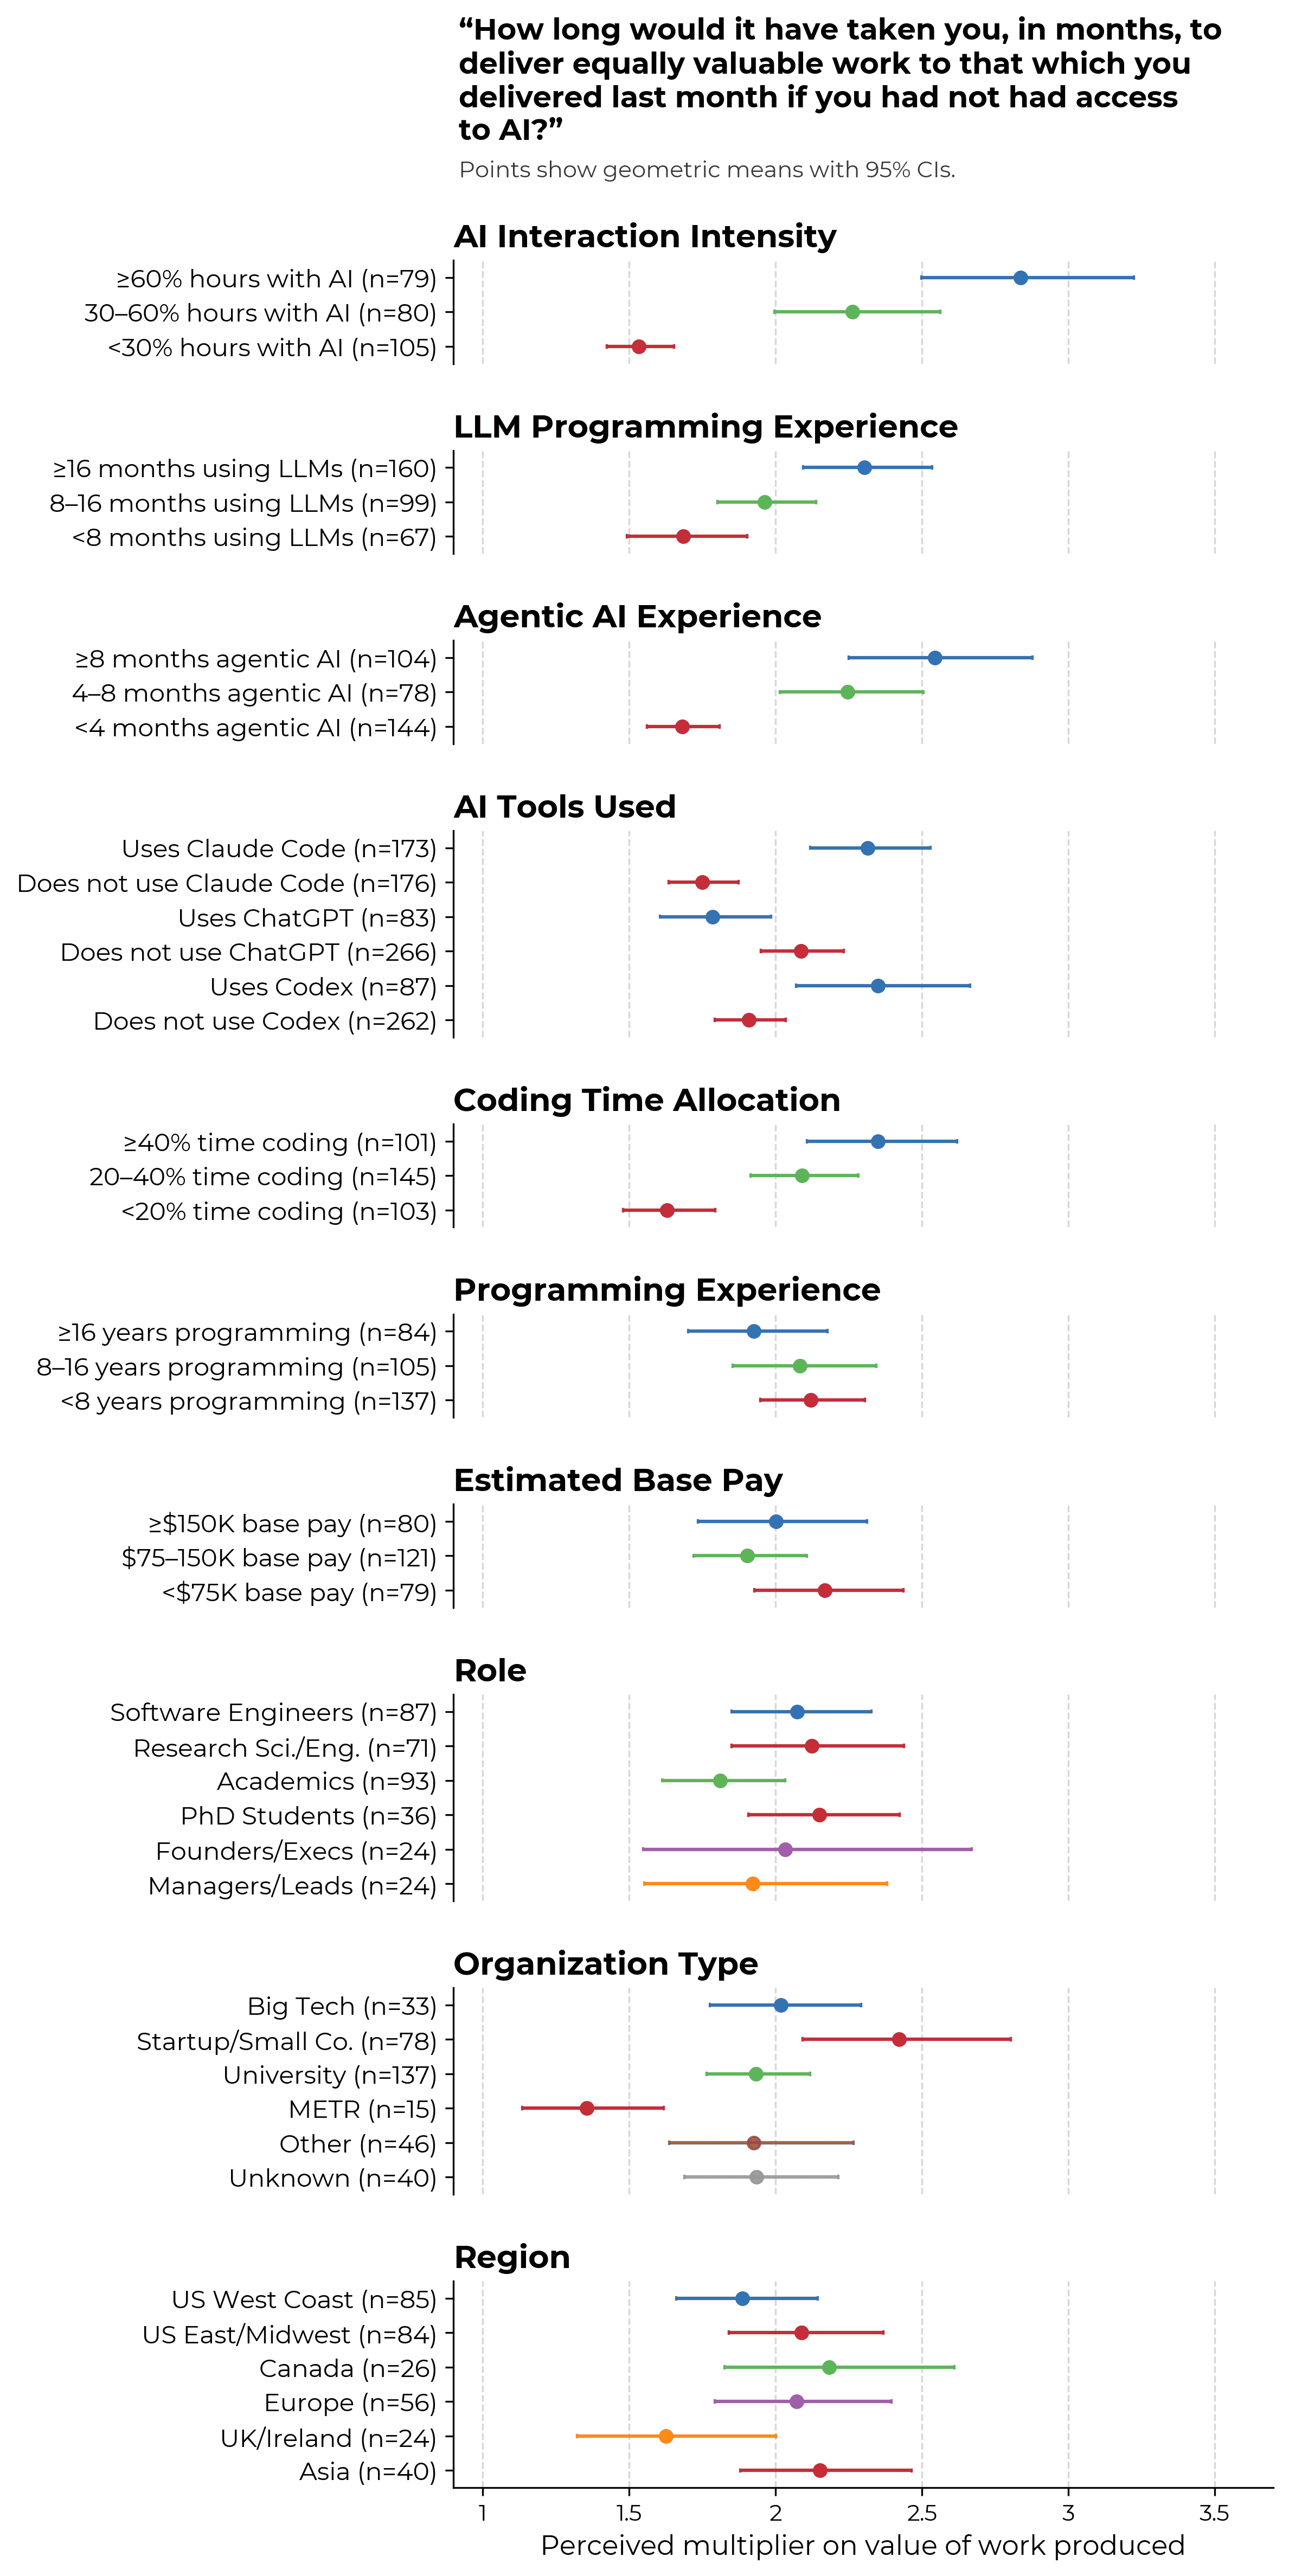
As would be expected, we find higher perceived value gains among respondents who use AI more, who have more experience using AI tools, or who use Claude Code or Codex.
On the other hand, METR employees tend to report lower value gains. We think that there are many possible hypotheses which could explain this result, including but not limited to:
Our intuition weakly points towards the first explanation, although it is challenging to make this explicit beyond documenting the differences in reported value multipliers.
In addition to collecting participants’ quantitative estimates, our survey prompts participants for their qualitative sense of the currently most impressive AI capabilities, where AI has been most helpful in their work, and so on. This gives us some information we can use to sense-check the quantitative estimates, albeit in an ad hoc manner with much room for researcher bias.
Overall, whilst we believe that averages as high as we observe are not implausible estimates of ‘true’ value multipliers, it does seem like a live possibility to us that respondents are giving larger answers than they would if they thought about the question for longer.
We reviewed in detail the 7 responses in our data for which at least two value measures have values greater than or equal to 10x. Our main impressions were:
This work suggests key improvements for surveys tracking the acceleration of AI R&D by AI tools, as compared to existing surveys such as those used by Anthropic. The core issue is eliciting calibrated estimates of a proxy for the acceleration of AI R&D. Two particularly promising improvements might be:
It is also important to ensure a sufficient sample size.
These are our highest-confidence recommendations. If you plan to run such a survey, please consider getting in touch to discuss in more detail. We would be glad to help.
Relative to our own survey, the top improvements we would make are:
Regardless of these lessons learned, we feel there is more information that could be obtained even from a survey exactly like this one:
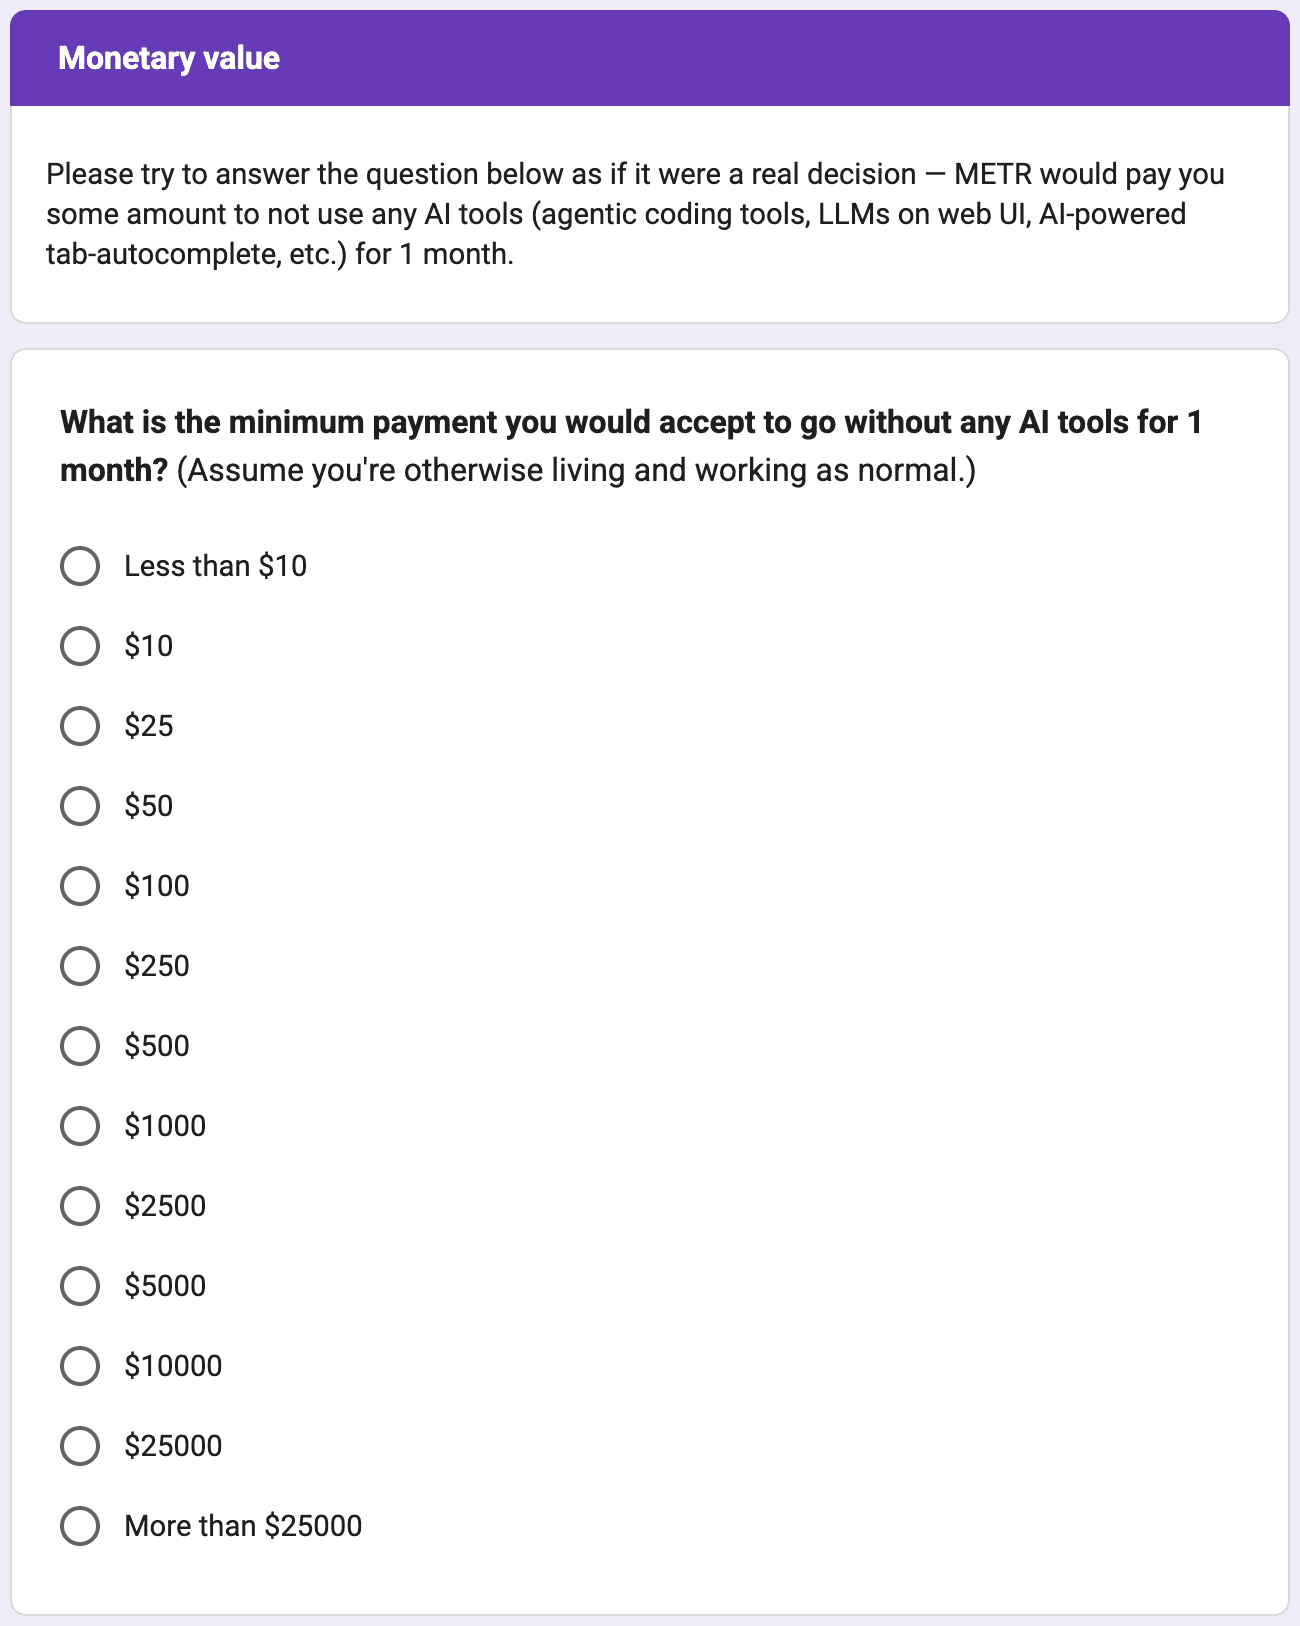
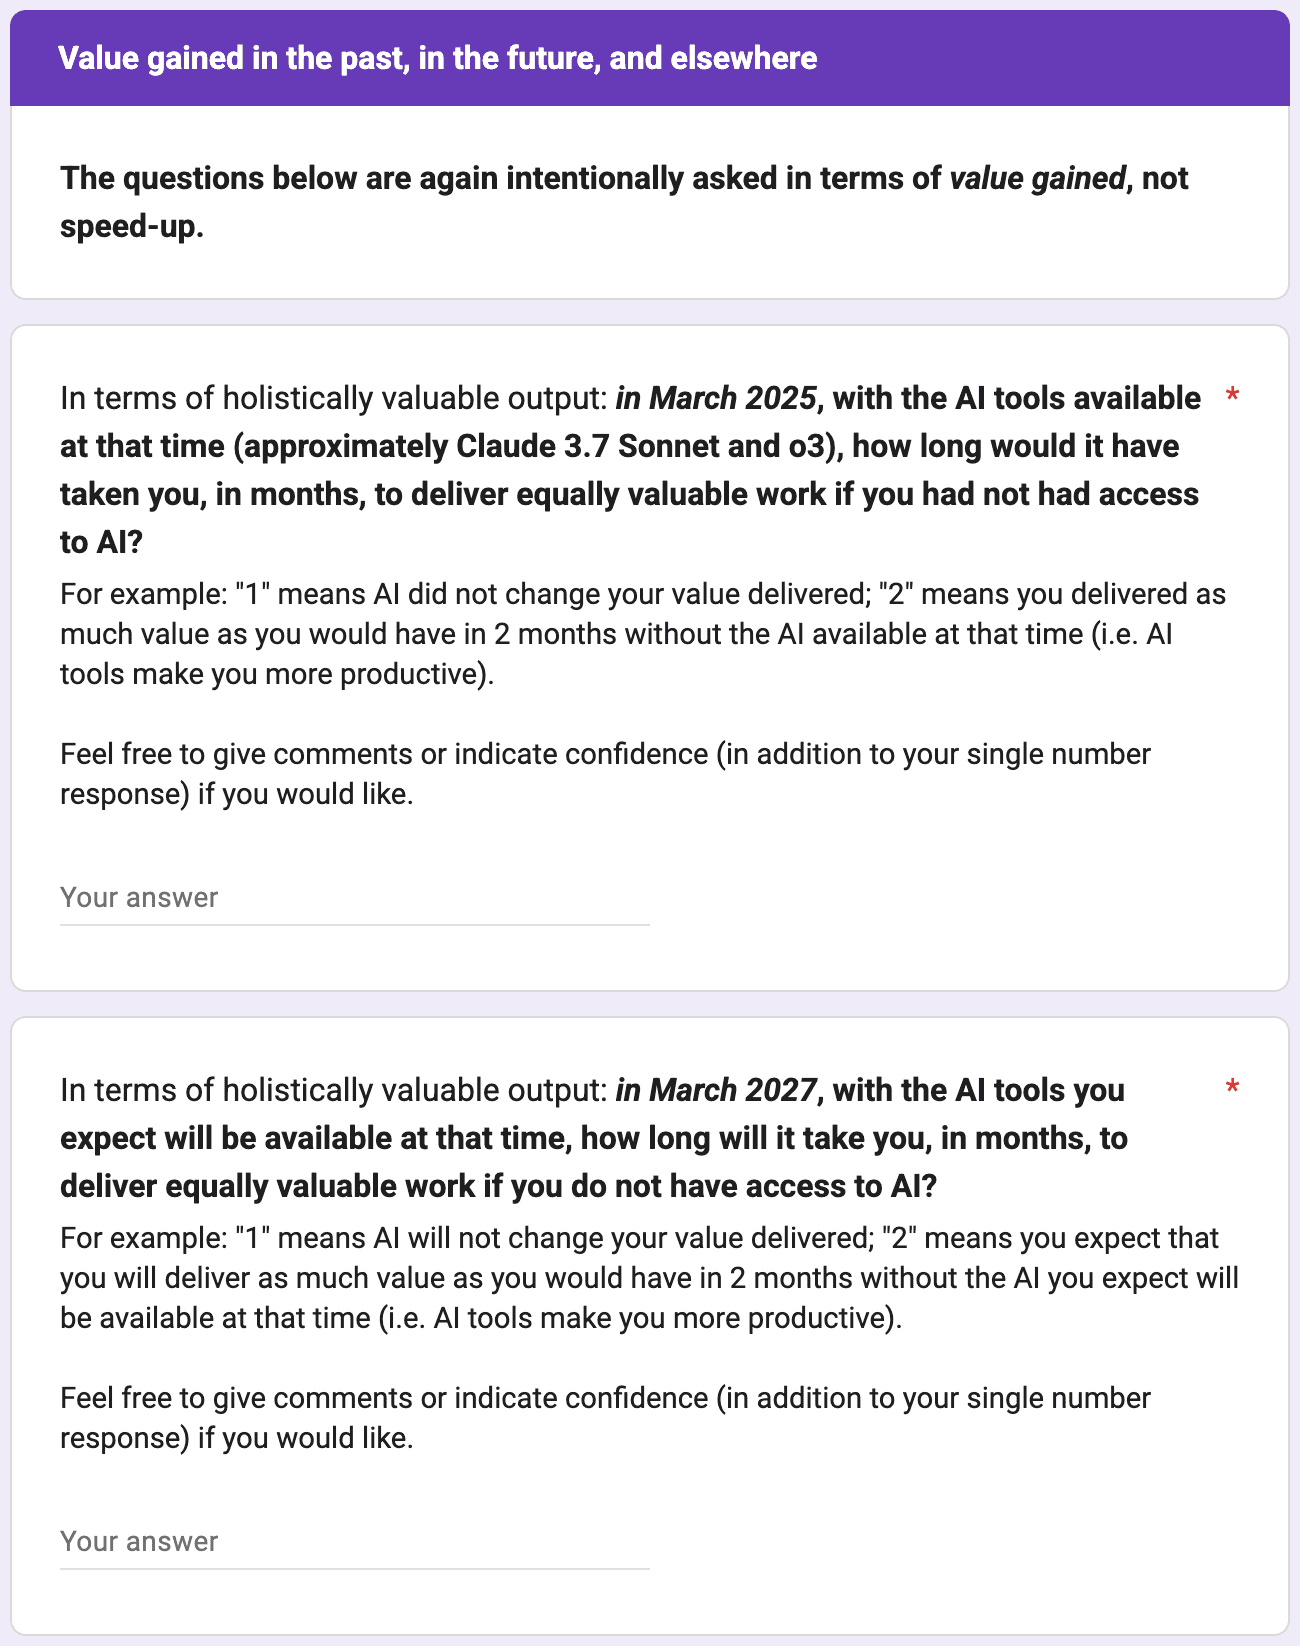
If real in some sense, perceived changes in value of work due to AI on the order of 2x would appear to have major implications for revealed preferences. For instance, naively it seems like workers should be willing to make large sacrifices to retain access to AI tools.
Indeed, the median participant claims that they would sacrifice 29% of their salary to keep access to AI tools for 1 month.
Although we interpret this finding as suggesting broad consistency between average answers among our survey participants, we consider the evidence to be weak.
First, we have many uncertainties about data quality. Our salary estimates come from Claude Opus 4.6 making a best estimate of base pay given the participants’ employer and location; we have done some validation of these numbers, but not nearly enough to feel confident about their accuracy. Additionally, the willingness-to-accept (WTA) data has surprisingly high variance (including people who would pay >100% of their estimated wage); apparent consistency between averages hides a lot of variation between participants.
Second, our comparison between WTA measures and ‘value’ multipliers is not straightforward to interpret. Asking people how much they would personally pay to retain access to AI tools at work is plausibly very flawed as a measure of the value they get out of AI, principally because employed workers aren’t the party capturing value (their employers are).14 Diminishing returns to income and consumption pose a further challenge.
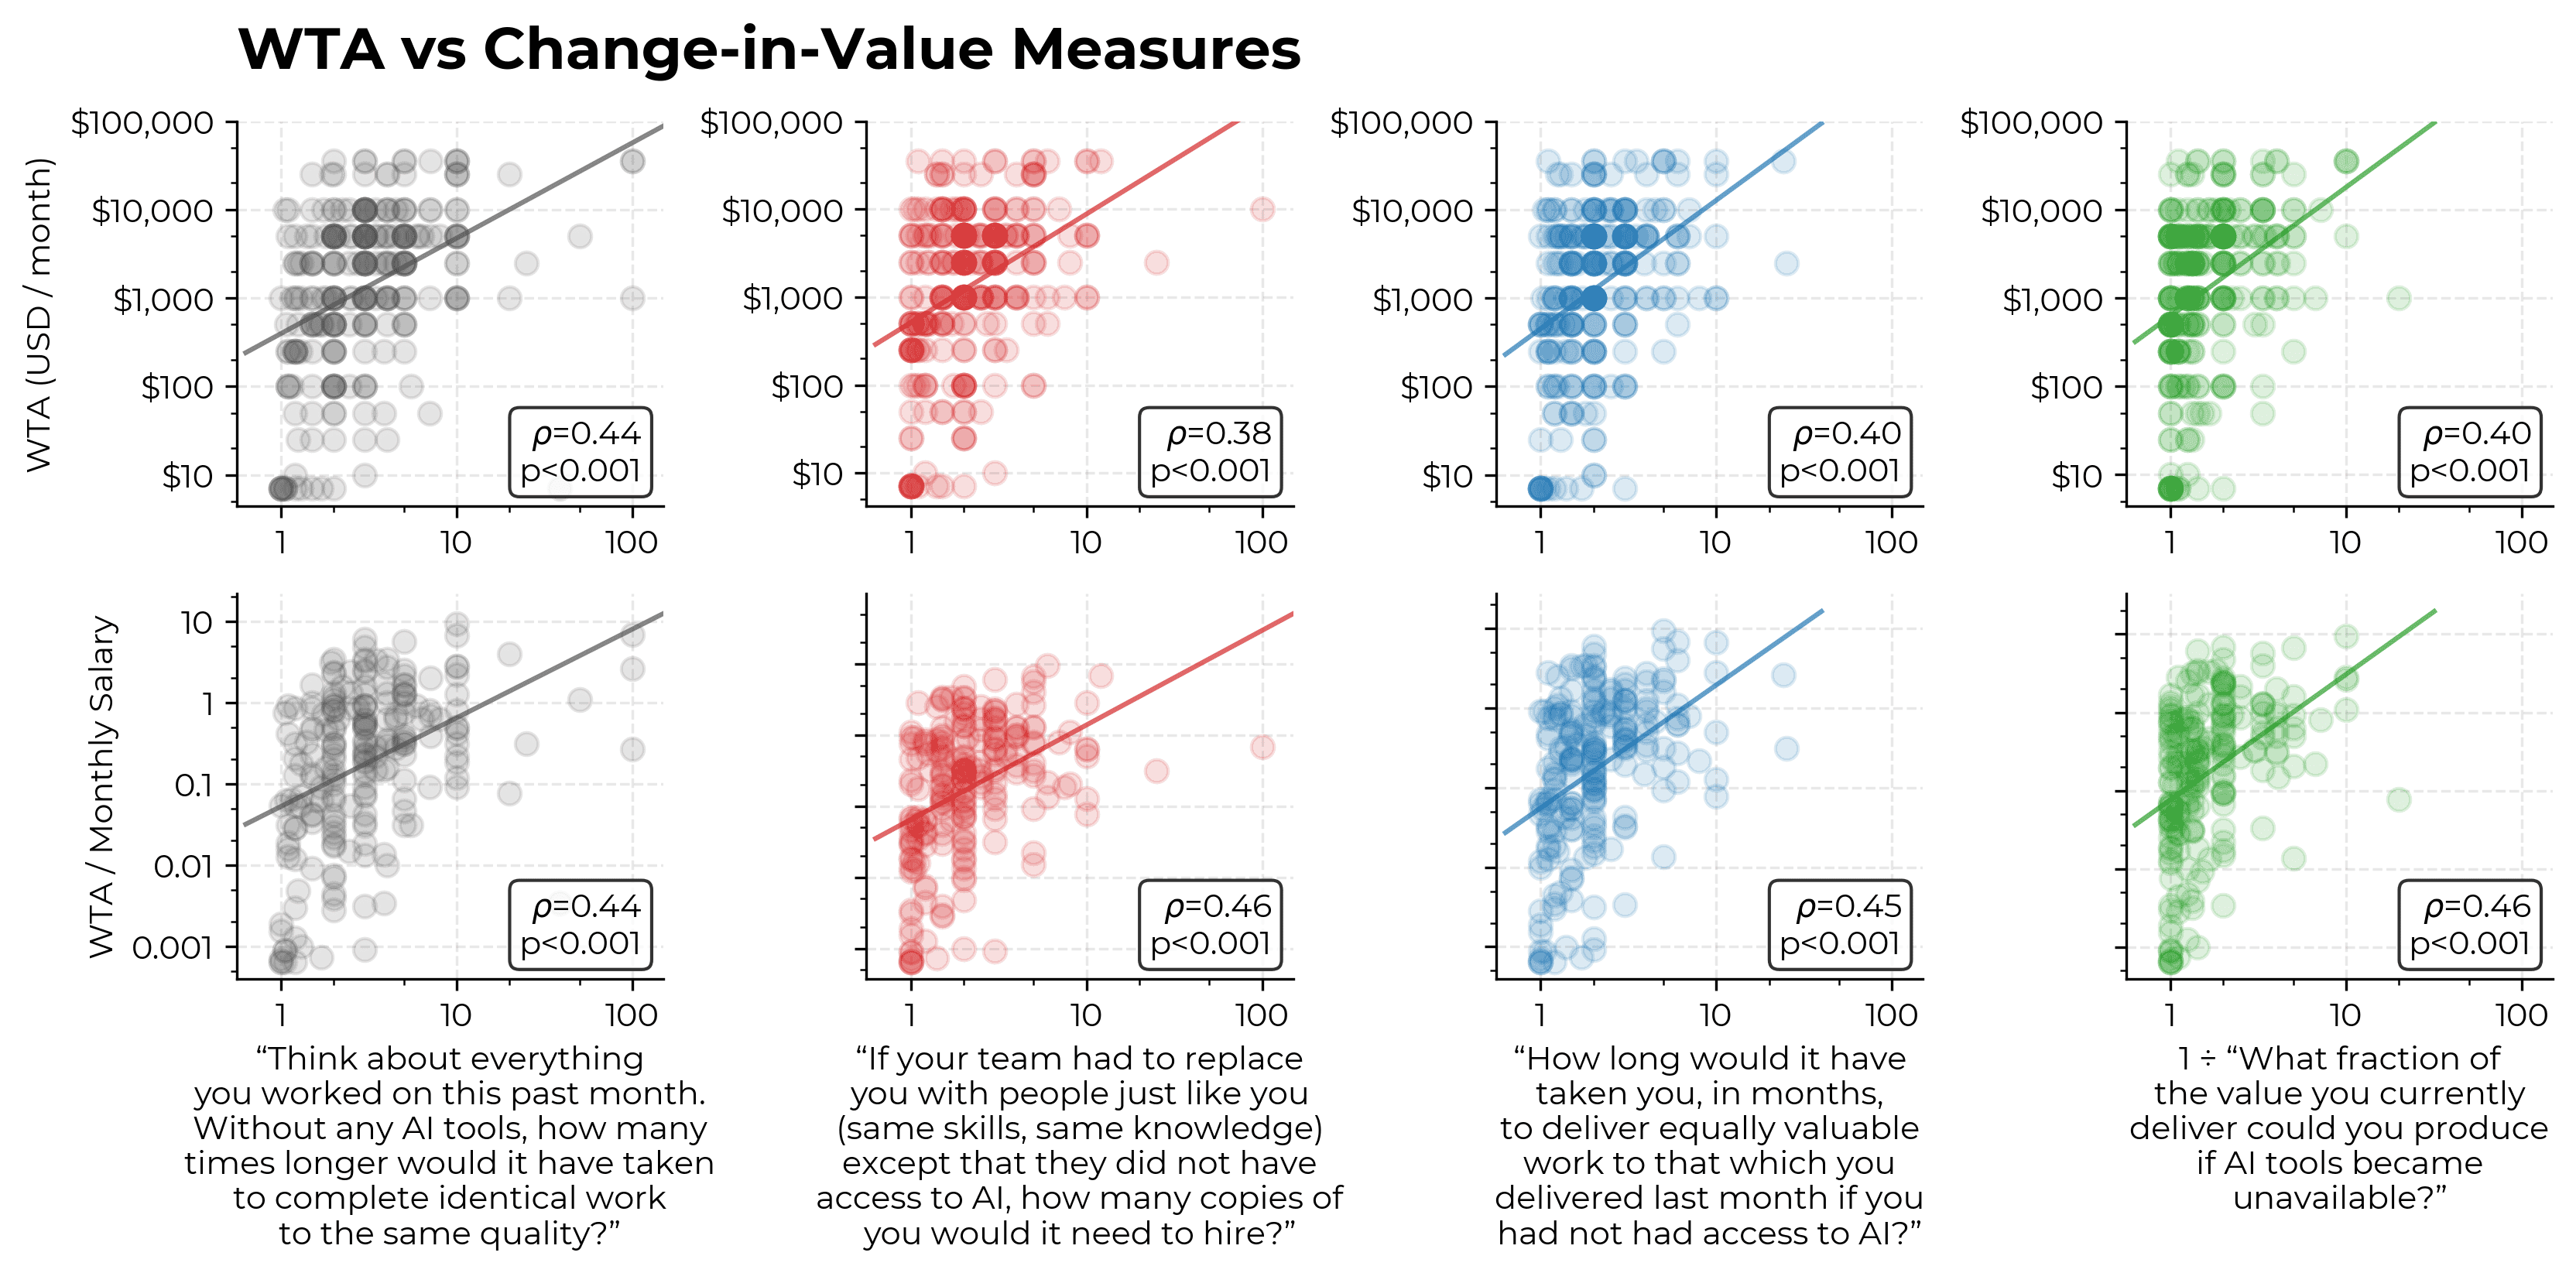
We filter out 10 responses from the 359 unique respondents in our raw data (3% of sample) due to a pattern of quality issues with their answers.
To determine which responses to filter out, we tally up points for possible data quality issues, then remove responses above a cut-off of 5 points.
Anomalous response flags and associated points are listed below. If responses are flagged as severe by some data quality criteria, they receive points for both moderate and severe tiers.
| Flag | Moderate | Severe | Points per tier |
|---|---|---|---|
| All work time allocation values identical (and >=3 filled) | - | - | 2 |
| All AI intensity ratings identical (and >=3 filled) | - | - | 2 |
| Agentic tool experience exceeds LLM tool experience | - | - | 3 |
| Skipped agent permissions question entirely | - | - | 1 |
| Skipped review practices question entirely | - | - | 1 |
| Work time lower-bound sum exceeds threshold | >= 150% | >= 300% | 1 |
| Value/speedup metrics disagree on direction | low=0.8, high=1.25 | low=0.6, high=1.67 | 3 |
| Q2 (months) and Q3 (copies) diverge | >= 3x | >= 10x | 1 |
| Q2 (months) and 1/Q4 diverge | >= 2x | >= 4x | 1 |
| Q3 (copies) and 1/Q4 diverge | >= 3x | >= 10x | 1 |
| Value estimate declines from 2025 to present | >= 1.1x | >= 2x | 1 |
| Value estimate declines from present to 2027 | >= 1.1x | >= 2x | 1 |
| Value estimate declines from 2025 to 2027 | >= 1.1x | >= 2x | 1 |
| Value trajectory timepoints not parsed | 2 not parsed | 3 not parsed | 1 |
| Willingness-to-accept far exceeds salary | >= 5x | >= 20x | 1 |
Respondents with >5 points are then filtered from the clean output. Approximately one third of respondents have 0 anomalous data flags.
Having a logically impossible work allocation is by far the most common bad data flag. Significantly declining uplift is next most common. That said, conditional on being filtered out for having plausibly bad data, potential data quality issues are fairly diverse.
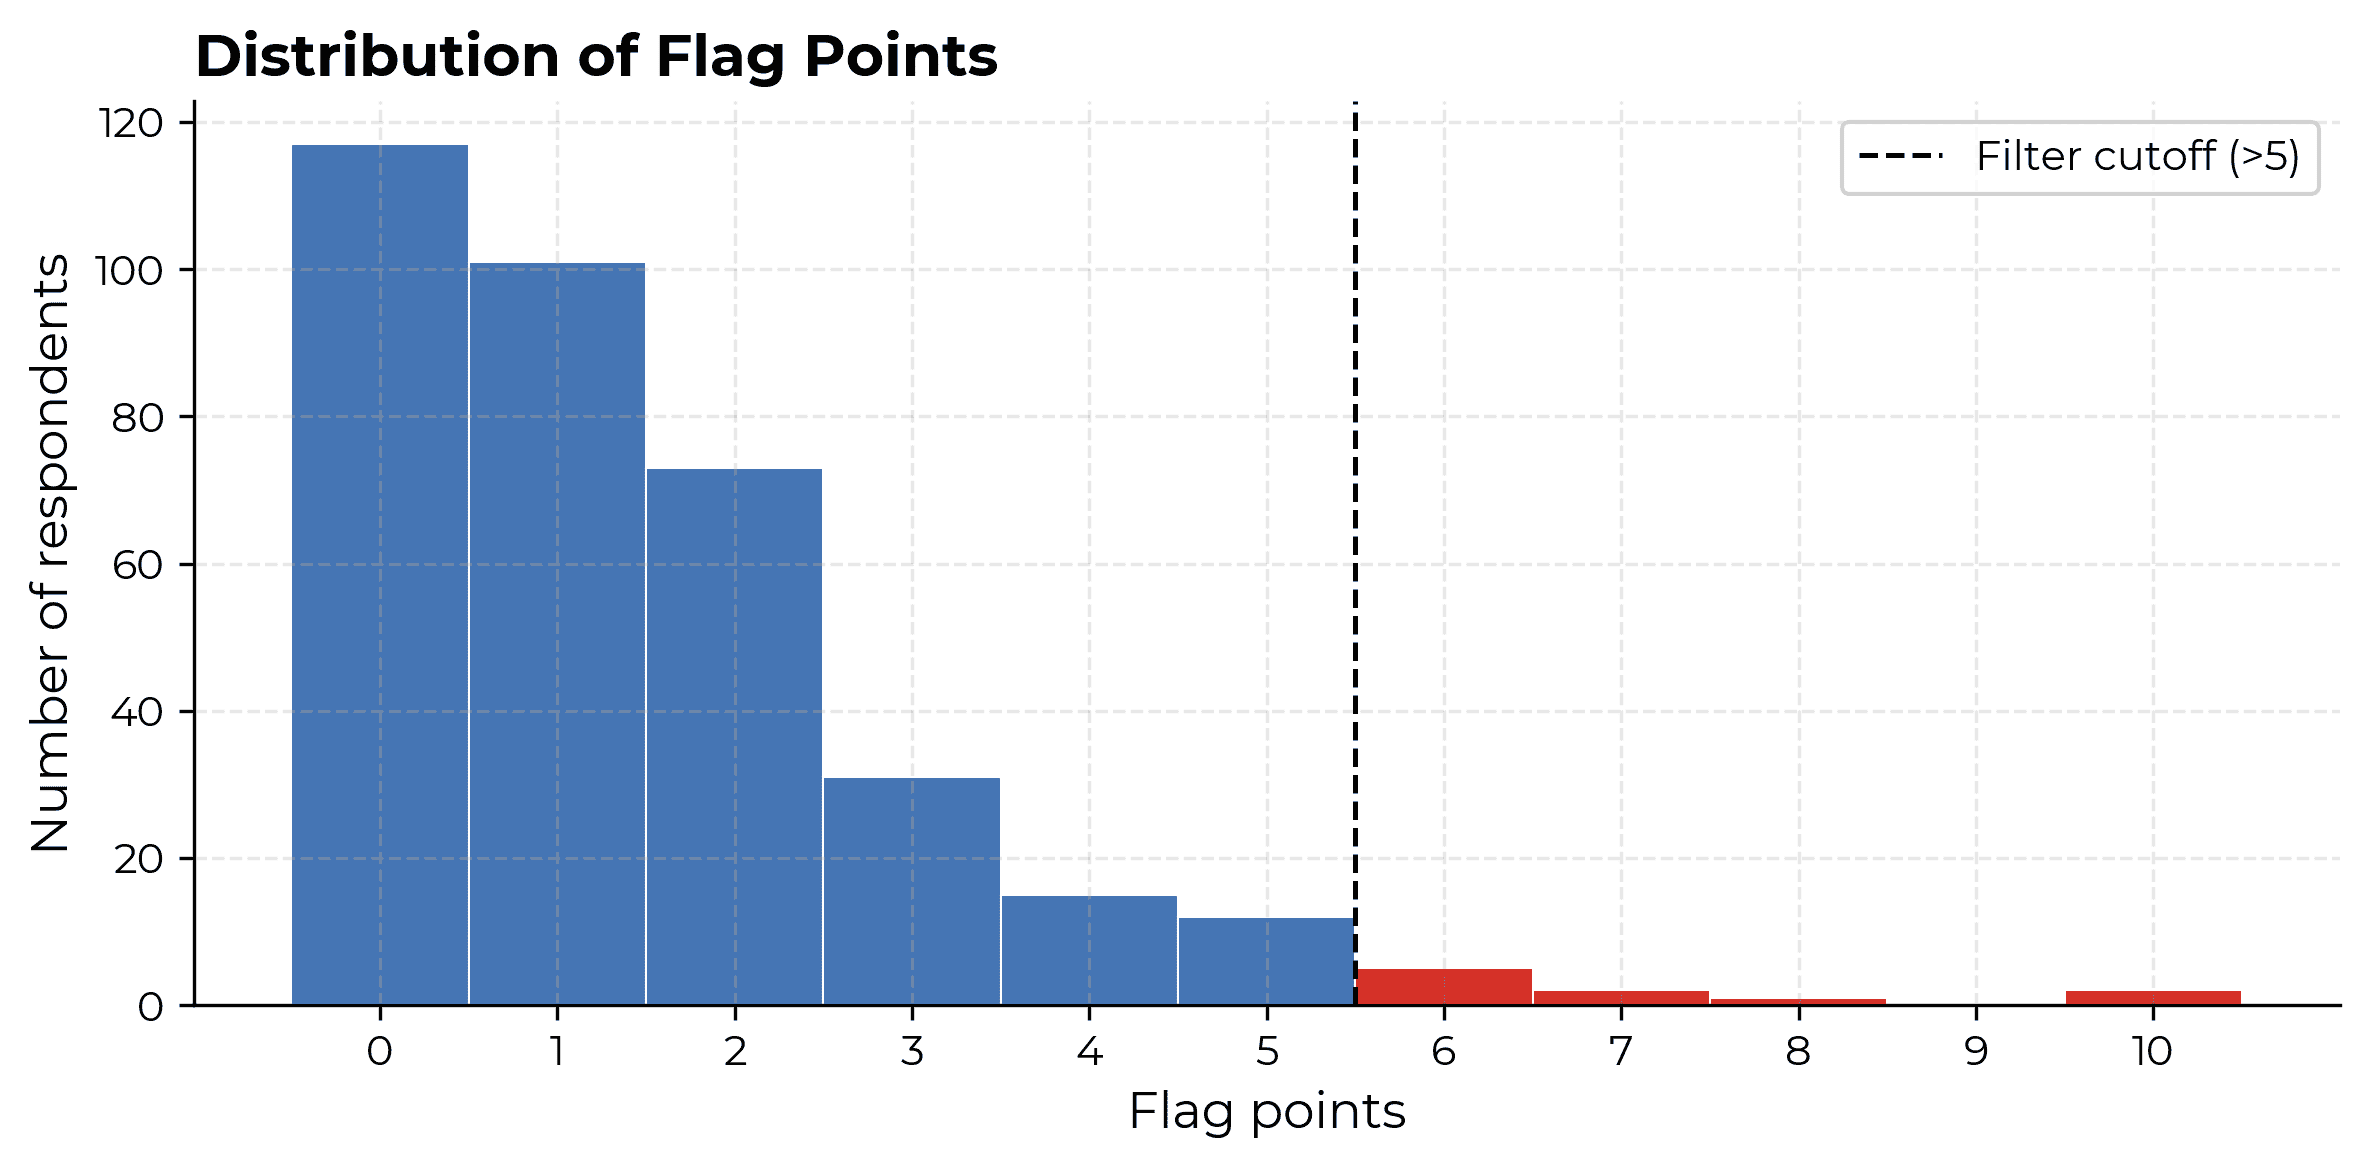
The majority of our central claims are not sensitive to the level at which we set our filter. The median answer to our speed measure is close to the boundary and so can be sensitive. The March 2027 value multiplier increases somewhat with very tight filters.
此内容由惯性聚合(RSS阅读器)自动聚合整理,仅供阅读参考。 原文来自 — 版权归原作者所有。