


Ok alright, I know I used a clickbait title, but bear with me. I want to share a function I've been using for ages. I originally wrote it to draw a hexagon – hexagons are cool, lots of hexagons are better, and tessellated hexagons are the best. So I wrote a function to draw one, which I could then repeat.
As I was doing so, I started modifying the hexagon to enable drawing a number of shapes that are based on just a couple of parameters. Let's begin with what I did with the hexagon and we'll take it from there.
Hexagons have six equal sides. If we imagine our starting point as the center of the hexagon, we can move around this point six times, joining each point as we go to make the sides.
Let's start off by creating a <canvas> with a 2d drawing context. We'll fix the size of the canvas to 400 x 200 pixels for this example and set the center point as (200, 100).
const canvas = document.querySelector("canvas");
canvas.width = 400;
canvas.height = 200;

const ctx = canvas.getContext("2d");
const cx = 200;
const cy = 100;
Now we need to figure out the x (horizontal) and y (vertical) position of points around the center, which when joined with a line, will make six equal sides. For this, we use the measurement from the center to the point (we'll call this the radius) and the angle of direction from the center.
As there are 360 degrees in a full rotation and six points we want to create, we can divide 360/6 and know we'll make a point every 60 degrees. However, there's a tiny caveat to this – JavaScript works with radians rather than degrees. One thing I always remember is that the value pi in radians is 180 degrees, or half a circle. So (Math.PI*2)/6 would give us each rotation in radians or even simpler Math.PI/3.
Next we need to add a bit of trigonometry to find the x and y position of each point. For the x position, we can use the sum radius multiplied by cos(angle) and for the y position radius multiplied by sin(angle). Let's put it all together, adding to our JavaScript code above:
// set the radius of the hexagon
const radius = 50;

// move the canvas to the center position
ctx.translate(cx, cy);

for (let i = 0; i < 6; i++) {
  // calculate the rotation
  const rotation = (Math.PI / 3) * i;

  // for the first point move to
  if (i === 0) {
    ctx.moveTo(radius * Math.cos(rotation), radius * Math.sin(rotation));
  } else {
    // for the rest draw a line
    ctx.lineTo(radius * Math.cos(rotation), radius * Math.sin(rotation));
  }
}

// close path and stroke it
ctx.closePath();
ctx.stroke();
Let's say we wanted to draw a triangle, a square, or an octagon. All we would need to modify in the above function, used to draw the hexagon, is the number of times we draw lines in our for loop and the angle for each point.
Let's turn this into a function that takes the center point, the radius, and number of sides as parameters:
const canvas = document.querySelector("canvas");
canvas.width = 400;
canvas.height = 200;

const ctx = canvas.getContext("2d");
function drawShape(x, y, r, sides) {
  // move the canvas to the center position
  ctx.translate(x, y);

  for (let i = 0; i < sides; i++) {
    // calculate the rotation
    const rotation = ((Math.PI * 2) / sides) * i;

    // for the first point move to
    if (i === 0) {
      ctx.moveTo(r * Math.cos(rotation), r * Math.sin(rotation));
    } else {
      // for the rest draw a line
      ctx.lineTo(r * Math.cos(rotation), r * Math.sin(rotation));
    }
  }

  // close path and stroke it
  ctx.closePath();
  ctx.stroke();

  // reset the translate position
  ctx.resetTransform();
}
Now we can draw different shapes by adjusting the sides parameter:
drawShape(100, 100, 50, 3);
drawShape(225, 100, 50, 7);
drawShape(350, 100, 50, 4);
This was a little introduction to the <canvas> element for drawing on a web page and a few of the methods you can use to draw shapes.
If you want to dive deeper into how all the pieces work, here's a recap of what we used:
<canvas>, the element on which we can display graphicsCanvasRenderingContext2D to draw 2D shapes to the canvastranslate() to move the origin to a new positionlineTo() to draw a line from one point to anotherclosePath() to join the first point to the last pointstroke() to stroke the path with a stroke styleTo calculate the position of each point, we used a little bit of maths and trigonometry:
Math.cos() to calculate the x position of a pointMath.sin() to calculate the y position of a pointMath.PI to calculate the angle of rotation in radiansTo get some more inspiration for what you can do with the <canvas> element, check out the Canvas tutorial that starts off with the basics and then covers more advanced topics like animation and pixel manipulation.
There are plenty of ways you can expand on this basic shape function. I like to include an inner radius, so you can create diamonds and stars. I've also experimented a little with curves instead of straight lines - feel free to experiment for yourself. Or try some tessellation, which is always fun!
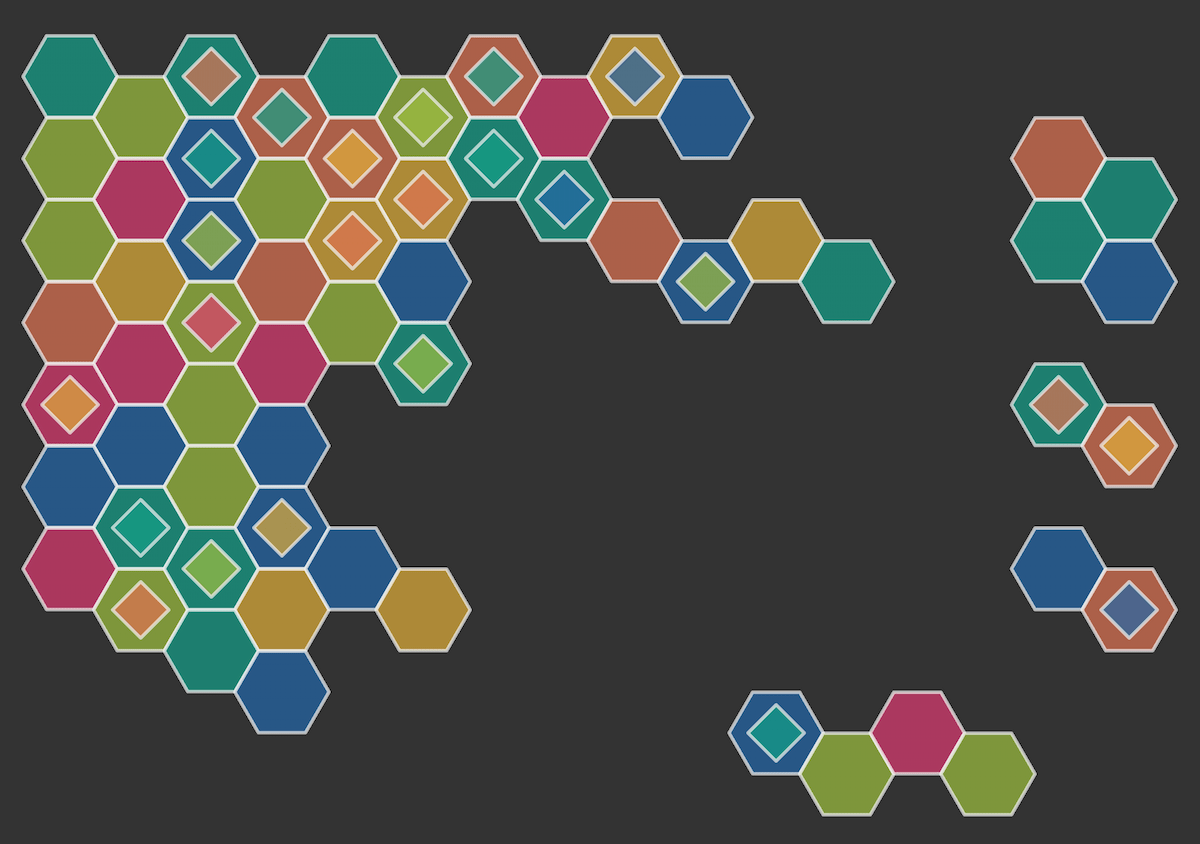
Let me know if you try out this function and if you like it as much as I do. As always, feel free to leave any feedback on the GitHub discussion or join us for a chat in the MDN Web Docs Discord server.
此内容由惯性聚合(RSS阅读器)自动聚合整理,仅供阅读参考。 原文来自 — 版权归原作者所有。