


惯性聚合 高效追踪和阅读你感兴趣的博客、新闻、科技资讯
阅读原文 在惯性聚合中打开

推荐订阅源

Martin Fowler
Martin Fowler
A
About on SuperTechFans
让小产品的独立变现更简单 - ezindie.com
aimingoo的专栏
aimingoo的专栏
T
The Blog of Author Tim Ferriss
IT之家
IT之家
罗磊的独立博客
博客园_首页
月光博客
月光博客
freeCodeCamp Programming Tutorials: Python, JavaScript, Git & More
Last Week in AI
Last Week in AI
OSCHINA 社区最新新闻
OSCHINA 社区最新新闻
量子位
Hugging Face - Blog
Hugging Face - Blog
G
Google Developers Blog
博客园 - 叶小钗
H
Help Net Security
N
Netflix TechBlog - Medium
B
Blog
Engineering at Meta
Engineering at Meta
Cyber Security Advisories - MS-ISAC
V
V2EX
Vercel News
Vercel News
博客园 - 三生石上(FineUI控件)

ImageKit.io Blog

Next.js Image Optimization with ImageKit Use Video as a Background in Your Next.js Project How to Fix Autoplay Video in Next.js How Durian Scaled a Visual-First Retail Experience to 350K Monthly Visitors Online How Matsmart accelerated image delivery across countries with ImageKit AI in Digital Asset Management: From Smart Workflows to Agentic Automation How Joseph Joseph unified and secured global video delivery with ImageKit How Modall powers fast, effortless media delivery across 40+ projects with ImageKit Digital Asset Management (DAM) Trends: 2026 Report How to add a poster image to Video.js player (and automate it) HLS streaming with Video.js + React Building the future of storytelling with fast, AI-powered video delivery How PushOwl delivers 100M+ image-rich notifications seamlessly with ImageKit How Homify delivers millions of interior design images seamlessly with ImageKit Better event discovery with lightning‑fast videos & images Adding video player in React Native Video player in Angular applications Crop and resize videos in React Next.js image and video upload React image and video upload React video optimization How we quadrupled our traffic to 625K monthly page views How Apollo 24|7 boosted performance & reduced costs with ImageKit Simplify your media workflows with ImageKit DAM integrations Extending Lighthouse for custom image and video optimization analysis Brand Asset Management: What is it? How does it work? WordPress Digital Asset Management Guide - Manage your WP media assets better Why Shopify retailers need a digital asset management solution DAM vs. SharePoint: Which is best for you? AI-powered Metadata and Tagging in Digital Asset Management
Measure how much bandwidth you saved with ImageKit.io
Manu Chaudhary · 2020-06-05 · via ImageKit.io Blog

You have been using ImageKit.io for a while now and sometimes get asked:

  1. How much bandwidth did we save after using ImageKit.io?
  2. Or what would have been our daily bandwidth consumption if there was no automatic optimization in the place?

Now you can get answers to these questions from your dashboard analytics.

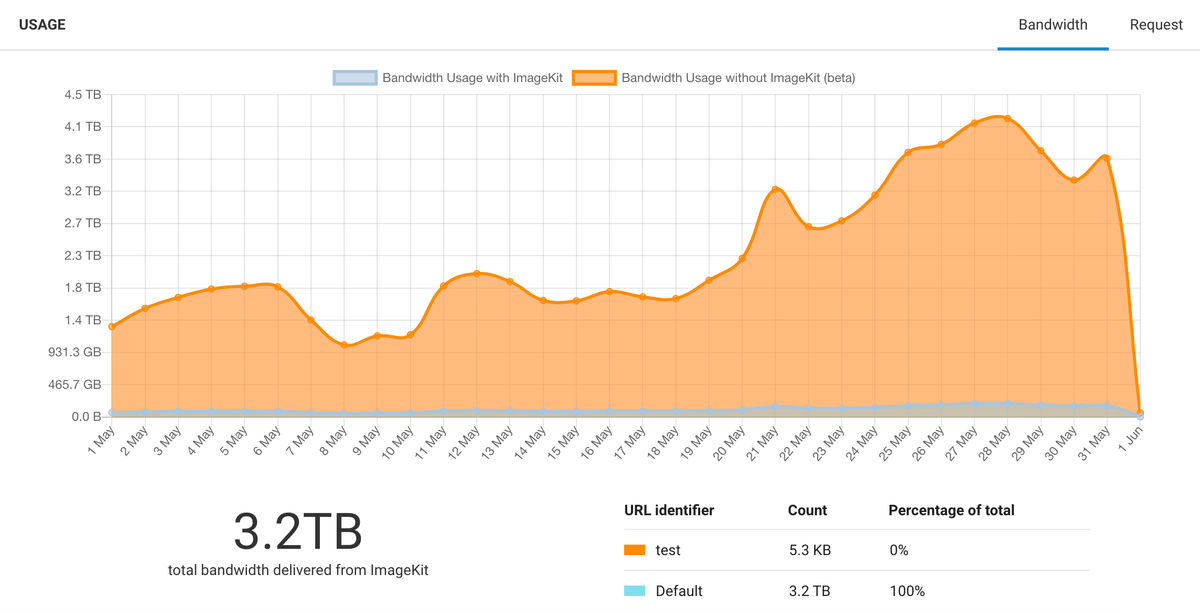
Total bandwidth savings using ImageKit.io in the month of May for a customer

The above image is a screenshot provided by one of our customers. This saving would obviously vary for all of you and also depends on:

  • If you are correctly resizing images or not?
  • The size of original files – and how unoptimized they were.

But overall, this will provide an exact idea of how much you have saved so far! And if that is not impressive, check out what can be improved using our website analyzer.

Now, combine the savings data with the website analyzer report and create a strategy to optimize images on your website and apps perfectly. Once you are done, start using performance monitoring to get automatic performance alerts (like below) in your inbox for key business pages.

Daily bandwidth savings graph

The usage section now has two graphs:

  • Bandwidth usage with ImageKit (your current usage)
  • Bandwidth usage without ImageKit.io (current usage + savings)

By clicking on "Bandwidth usage without ImageKit.io" legend, you can plot a daily bandwidth savings graph.
Daily bandwidth savings graph

You may notice more savings on a few days compared to others. The reason for the same would be – On a particular day, based on traffic, a specific set of images were requested more than the others. And this could result in not so linear savings graph.

How we calculate these savings?

Every time our core image processing servers optimize or resize an image, we store the corresponding savings number.

Saving = Original file size - file size after resizing & optimization

Now once an image is served, it is cached on the CDN. Our server doesn't get any request for it till the object is evicted from the cache.

So to calculate the cumulative savings on all repeat requests that are served from the CDN, we process CDN logs and combine our savings number for each URL. That means the savings that you see in the analytics are after considering every repeat request.

What else would you like to see?

A lot of customers asked us savings related questions, and we decided to work on it to provide the answers. This feature is in beta, and we would love to hear your feedback.

Let us know what else would you like to see in your analytics.