






If you can't measure it, you can't improve it. That's why website speed testing is of great interest to every webmaster. While there are many tools available to measure different metrics related to web page performance, relying on a particular metric alone often leads to inaccurate conclusions.
The aim of this guide is to highlight the bigger picture around website speed testing. It includes what to measure, how to measure it accurately, and various pitfalls in the whole process.
Let's cover them one by one:
What to measure during website speed testing?
When it comes to website speed testing, we immediately start thinking about the total page load time. And no doubt about the importance of this metric, but if you dig deeper you will know that caring too much about this particular metric, as reported by several tools, will often mislead you.
The page load time alone is a poor indicator of the user experience of your visitors.
Here's why.
For example, take a look at this image
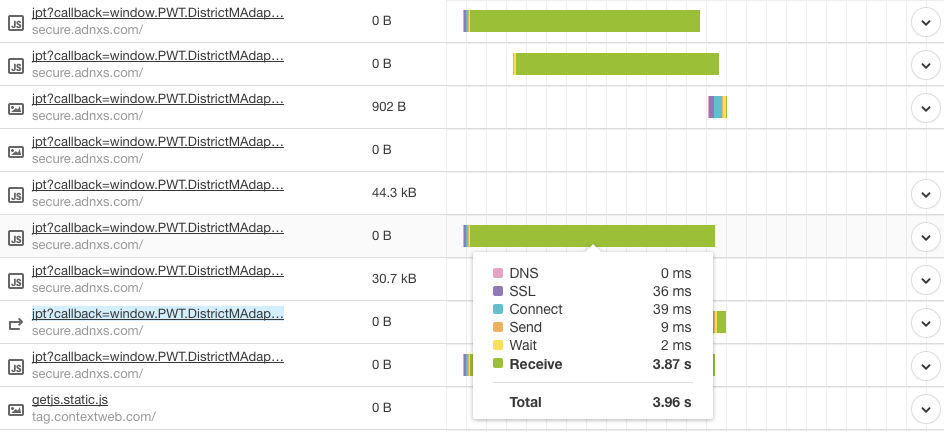
Notice how third party calls starting with ipt are taking quite a lot of time to load and increasing the reported page load time. Even though these calls happen asynchronously in the background after all the important content has been loaded, they are still reported in the total page load time. If you are in a similar situation, then ask yourself this question-
- Do any of these third party tracking API calls or ad scripts actually affect the way your user interacts with the page?
If the answer to the above question is no, then you need to stop taking decisions based on this metric alone.
In other words, you need to start measuring metrics that matter to your application, and are specific to your use case & business.
For example, on an e-commerce website, the users should be able to use filters and see the products. So all the JS files, HTML templates, and product images should load as quickly as possible. And this is exactly what you should be measuring.
We will soon discuss how you can measure the loading time of different assets individually.
On the other hand, for a news website, your visitors should be able to see the text and the associated images before losing interest and bouncing off.
Only after you quickly feed them the content by quickly loading your page, do the chances of getting more engagement, more ad impressions ,and more clicks increase.
Just as we know one size doesn't fit all, similarly not all metrics carry same the weight. Let's discuss how we can measure these page performance metrics separately and accurately.
How to measure different performance metrics of a web page?
There are broadly two measurement techniques:
- Synthetic testing with no actual user. This could be done using tools like CatchPoint or Pingdom.
- Real user monitoring in an actual user's browser by injecting javascript to collect timing metrics.
If you care about how your users are actually experiencing your applications, then Real User Monitoring(RUM) will provide the most accurate insights.
There are a few companies and open-source projects for RUM but you can build your own scripts too!
Skip the next section if you are already familiar with Resource Timing API and the related properties.
About Resource Timing API
The Resource Timing API is exposed through the performance property of the window object.window.performance.getEntries() provides an array of PerformanceResourceTiming object for every asset on the page. Each PerformanceResourceTiming object in this array contains following crucial timing information:
initiatorTyperepresents the type of resource that initiated the performance event. It could be element's localname, css or xmlhttprequest etc.redirectStartis recorded when the first HTTP redirect starts.redirectEndis recorded when the last HTTP redirect is completed.fetchStartis recorded when the browser is ready to fetch the document using an HTTP request. This moment is before the check to any application cache.domainLookupStartis recorded immediately before the domain name lookup.domainLookupEndis recorded immediately after the domain name lookup is successfully done.connectStartis recorded immediately before initiating the connection to the server.connectEndis recorded immediately after the connection to the server or the proxy is established.secureConnectionStartis recorded when the handshake begins for securing the connection. It is used only if TLS or SSL is in use.requestStartis recorded immediately before the device starts sending the request for the resource.responseStartis recorded immediately after the device receives the first byte of the response.responseEndis recorded immediately after receiving the last byte of the response.
A typical request lifecycle in the browser starts by a DNS lookup, then a TCP connection, and finally actual downloading.
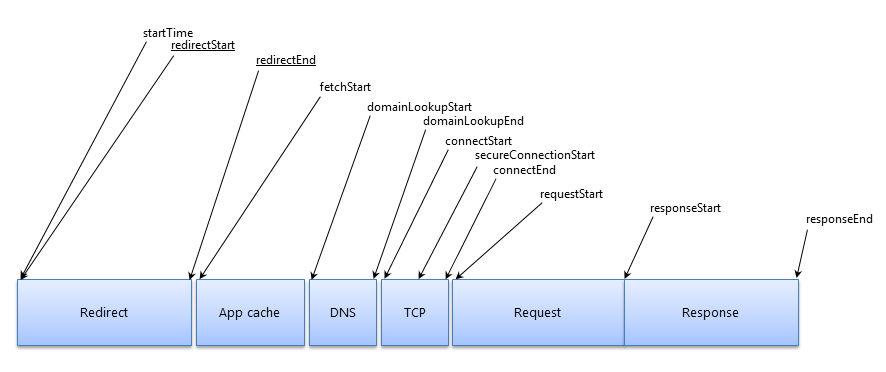
TTFB = responseStart - requestStart
Download time = responseEnd - responseStart
Total download time = responseEnd - requestStart
Here are a few scripts that you can use to see how your website is performing.
Demo script to calculate the download time of a specific JS file on a page
Suppose we want to measure the download time for a compiled JS file called vendor.js
function measureTimings() {
  var timingInfo = window.performance.getEntriesByName("https://imagekit.io/static/build/js/vendor.js");
  if(timingInfo.length) {
    var duration = timingInfo[0].duration;
    var beacon = new Image();
    beacon.src = "//example.com/rum/result/log-timings?script=vendor&duration=" + duration;
  }
}
Call measureTimings() after vendor.js is loaded.
Simply implement an end point on your backend, like the log-timings end point in the above example, to receive this duration data. You can then calculate data like average, median, and percentile load times to learn how long it takes before your web page is useful for your visitors.
This data reflects what your real users are experiencing on your website. You might have more than one JS file, or some other assets that are more important for your use case, go measure timings for those.
Instead of implementing your own backend for recording these timings, you can also leverage Google Analytics's User Timings tracking.
You can use send command like this:
ga('send', {
  hitType: 'timing',
  timingCategory: 'JS Dependency',
  timingVar: 'load',
  timingValue: 1249
});
Demo scripts to calculate the 90% percentile download time for all images on a page
To calculate how much time it takes before 90% of the images on a web page have been loaded, you can use something like this:
function measureImageTimings() {
  var timings = window.performance.getEntries();
  var sum = 0;
  for(var i=0, l=entries.length; i < l;i++) {
    // check on name property to check only for images or any other custom check you want
    if(entries[i].name.indexOf("images.example.com") != -1) {
      timings.push(entries[i].duration);
    }
  }
  timings.sort(function(a,b){ return a-b; });
  var len = timings.length, ninetieth, beacon;
  if(len) {
      ninetieth = timings[parseInt(len *.9)] || 0;
      beacon = new Image();
      beacon.src = "//example.com/rum/result/log-nineteenth-percentile?ninetieth="+ninetieth;
  }
}
Trigger measureImageTimings() a few seconds after the user has been on the page. Ideally, you would want to wait till most of the images have been loaded. You can also send timings.length to note how many images have been loaded at the time of this recording. Experiment with different wait times before triggering measureImageTimings() to increase this count. If you have a better idea for this, do share in the comments section below.
Various pitfalls during website speed testing
- Timing metrics not available
Not all timing metrics are exposed on every origin.
Timing-Allow-Origin response header should contain the whitelisted origin on which you want to allow access to the above timing information.
In case this check fails, responseStart and many other metrics will simply report 0 and your whole analysis can go wrong.
You can whitelist all origins like this to be safe side
Timing-Allow-Origin : *
2. While relying on RUM, you should always collect a lot of data to make up for any variance.
3. Median and percentiles should be given more importance than average.
4. Remove the outlier values when analysing the data.
5. Don't get overwhelmed with the sheer amount of data and always remember what to measure. Remember, the page load time example above. Don't get locked into a single metric.
6. Know the difference between duration field and actual download time
During a page load, there are many resources being downloaded in parallel and they all compete for a limited bandwidth.
On top of that, if your server is using HTTP/1 instead of HTTP/2, then browser puts a further restriction of only 6 TCP connections per origin at any point in time. This can result in queueing your requests for a much longer time than compared to the actual download time for that asset.
The browser can postpone your request for other reasons as well, like a lower priority request than critical resources (such as scripts/styles). This often happens with images. For example-
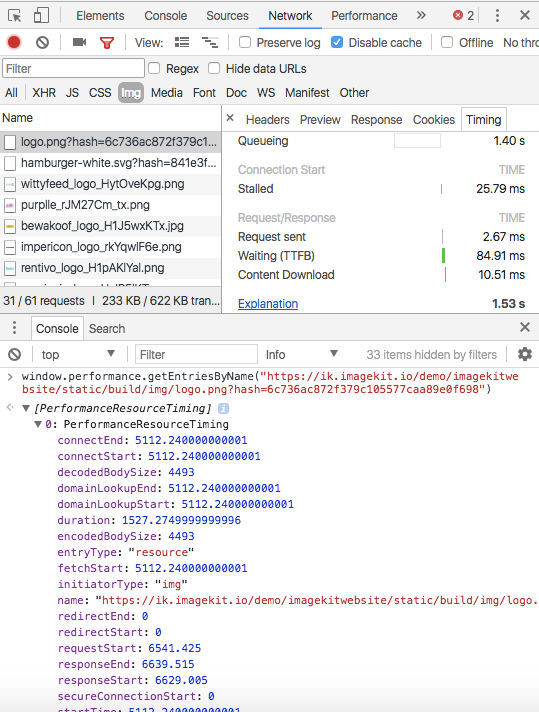
Now notice that the overall download time (TTFB + download time) is only around 95ms but since the request was queued for 1.4 seconds, the total download duration is reported as 1.5 seconds.
You need to make sure you are using a right field from the PerformanceResourceTiming object for your measurements.
For example, If you are comparing the performance of various CDNs, then you should care about TTFB and total download time.
On the other hand, if you want to measure how much time it takes before your images are actually visible to the visitors, or how much time it takes before your JS is downloaded (i.e. filters start working), then you should take into account the duration field. It will account for all the queuing, stalling, TCP handshakes, SSL handshake & DNS lookup times.
I hope you are all set to use these techniques for measuring the performance of your own website. Website speed testing is a continuous process, and besides RUM, you should also use other tools available to monitor the overall performance of your websites like Google PageSpeed Inshgits, WebPageTest, and Pingdom.
To gain deeper insights about your images health, try ImageKit website analyzer
If you see too many unoptimized images in the analyzer report, sign up on ImageKit now and give it a try. It is free to begin with and only takes a few of minutes to get up and running.
Not sure why image optimization is important, read this.
Please share this guide with your team and leave your feedback & views in the comments section below.