





- DESCRIPTION
- TABLE OF CONTENTS
- METHODOLOGY
- DOWNLOAD PDF
Microspheres Market by Type (Hollow, Solid), Raw Material (Glass, Ceramic, Fly Ash, Polymer, Metallic), Application (Building & Construction, Medical Technology, Cosmetics & Personal Care, Automotive, Oil & Gas) - Global Forecast to 2031

USD 6.47 BN
MARKET SIZE, 2031

CAGR 8.23%
(2026-2031)

250
REPORT PAGES

280
MARKET TABLES
OVERVIEW
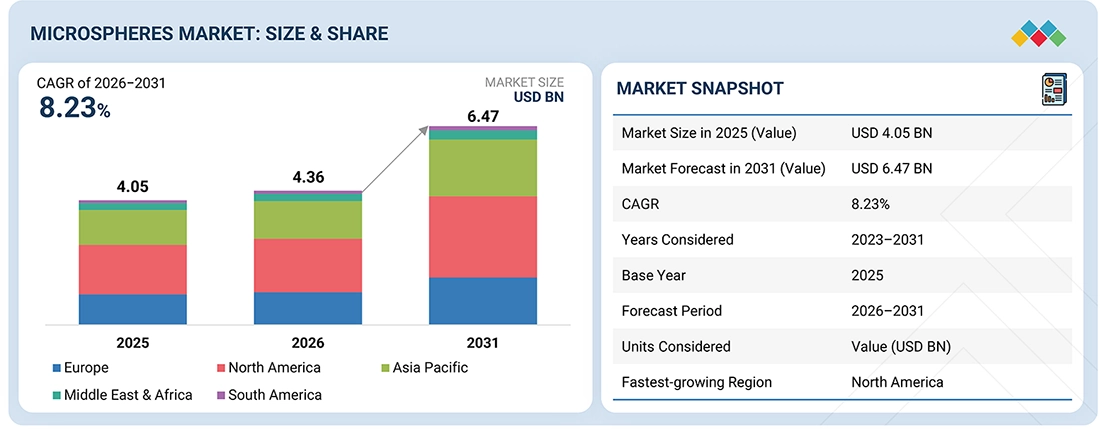
Source: Secondary Research, Interviews with Experts, MarketsandMarkets Analysis
The microspheres market is projected to grow from USD 4.36 billion in 2026 to USD 6.47 billion by 2031, at a CAGR of 8.23%. Microspheres are small, spherical particles whose sizes usually range from 1 to 1,000 micrometers and are composed of different materials, including glass, polymers, ceramics, or metals. They have many advantages, including a lightweight nature, controlled size of particles, and an ability to have various properties such as thermal insulation, enhancement of flow, and density reduction. Multiple factors are contributing to the growth of this market, including rising demand from industries such as construction, automotive, healthcare, and cosmetics, as well as an increased emphasis on enhancing performance and reducing material waste.
KEY TAKEAWAYS
-
BY REGION
North America accounted for 39.7% of the global microspheres market in 2025 in terms of value.
-
BY TYPE
The hollow segment led the microspheres market in 2025.
-
BY RAW MATERIAL
The polymer segment accounted for the largest market share in 2025.
-
BY APPLICATION
The medical technology segment is projected to register the highest CAGR of 11.01%, in terms of value, during the forecast period.
-
COMPETITIVE LANDSCAPE - KEY PLAYERS
3M Company, Nouryon, and Merck KGaA are identified as key players in the microspheres market. These companies have strong market presence and extensive product portfolios.
-
COMPETITIVE LANDSCAPE - STARTUPS
Trelleborg AB, Chase Corporation, and Sinosteel Maanshan New Material Technology Co., Ltd., among other emerging players, maintain solid positions within specialized niche segments, highlighting their potential to evolve into future leaders in the microspheres market.
The microsphere market is expected to continue growing over the next 10 years, owing to new developments in materials science and increased demand for stronger as well as lighter materials. Microspheres are widely used by manufacturers, given their better functionality, cost savings, and greater sustainability. The trend toward energy-efficient products, improved healthcare, and the production of eco-friendly materials will contribute to the widespread use of microspheres across many applications as a multi-functional material with an exceptional impact.
TRENDS & DISRUPTIONS IMPACTING CUSTOMERS' CUSTOMERS
The impact on consumers' business emerges from customer trends or disruptions. Upstream clients for microsphere manufacturers are the suppliers of raw materials used to produce microspheres and the distributors of those raw materials. Downstream applications for microspheres are those that provide end-user demand for microspheres. Downstream application trends in end-user use of microspheres are directly impacted by upstream trends in performance, sustainability, and regulations. Fluctuations or changes in end-user demand will then drive changes in the materials procurement volume handled by upstream suppliers and distributors as a result of direct downstream application demands.
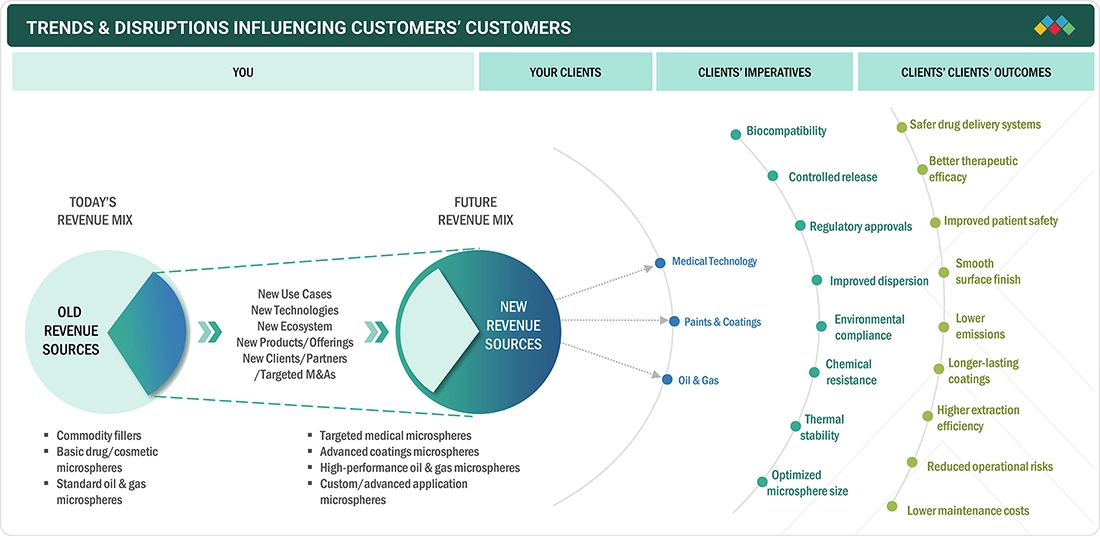
Source: Secondary Research, Interviews with Experts, MarketsandMarkets Analysis
MARKET DYNAMICS

Drivers
Impact
Level
-
Demand for lightweight & high-performance materials

-
Rising demand in medical & drug delivery applications


RESTRAINTS
Impact
Level
-
Raw material price volatility

-
High production & capital costs


OPPORTUNITIES
Impact
Level
-
Expansion in biomedical & pharmaceutical fields

-
Advancing sustainable & biodegradable microsphere solutions


CHALLENGES
Impact
Level
-
Complex manufacturing processes

-
Limitations in scaling production

Source: Secondary Research, Interviews with Experts, MarketsandMarkets Analysis
The microspheres market continues its growth trajectory owing to the demand for lightweight but high-performance materials in an ever-increasing number of sectors, such as automotive, aerospace, and construction. By utilizing microspheres, manufacturers have a lower density of their materials while still maintaining durable properties, enabling them to improve fuel efficiency, ease material handling, and enhance the performance of the overall structure. Additionally, when added to coatings, composites, and plastics, microspheres enhance thermal insulation properties, increase durability, and improve the appearance of the surface. Many industries will continue to look to incorporate microspheres into new formulations as they seek to improve how much material is used without compromising on functionality, thus driving the continued demand for microspheres in different high-value applications.
Changes in supply chain operations, energy prices, and resource availability have had a direct impact on the cost of manufacturing microspheres, in turn impacting the pricing stability for the end users of microspheres. Manufacturers also have to constantly adjust cost structures in order to maintain stable prices that could affect long-term relationships, as well as profitability. Smaller manufacturers may find it difficult to absorb large increases in costs incurred by their suppliers, which would reduce their competitiveness. Therefore, the uncertainty in the pricing of input materials makes it difficult for companies to determine procurement strategies, causing delays in decision-making around incorporating microspheres into production processes. This factor may limit the broader adoption of microspheres in products that have cost restrictions.
The biomedical and pharmaceutical sectors offer strong growth potential for the global microspheres sector. Microspheres have multiple applications, including controlled-release drug delivery systems, imaging diagnostic systems, and targeted treatments due to their controlled-release properties and the degree of compatibility with human tissue. They are also an effective means of providing drug-like substances directly into the body (precisely delivering active ingredients) with increased treatment efficacy and diminished overall side effects. Additionally, microspheres are gaining traction as a viable solution in both tissue engineering and regenerative medicine as new healthcare technologies are developed. Advancements in innovative, patient-centered medical solutions and increased funding for research and development will result in new opportunities for expanded microsphere applications and overall growth in the market.
The development of the global microspheres sector is affected by many obstacles resulting from the complexity of micromolding processes used to manufacture microspheres with consistent size, structure, and performance. It is an exact science to produce uniform microspheres because there are many variables that affect the production process (e.g., temperatures, pressures, and chemical compositions). If any of these operating conditions vary, then the quality of the manufactured microspheres may be adversely impacted, thereby compromising the ability to achieve desired performance from their intended applications. In order to produce uniform microspheres, many of the latest technologies available for producing microspheres require specialized equipment and technical skill sets. Thus, the operational costs of producing microspheres are higher, which limits the ability of some manufacturers to scale up their operations. The ability to consistently produce high-quality microspheres to meet varying application requirements continues to be one of the most significant challenges facing microsphere manufacturers.
MICROSPHERES MARKET: COMMERCIAL USE CASES ACROSS INDUSTRIES
| COMPANY | USE CASE DESCRIPTION | BENEFITS |
|---|---|---|
|
|
Use of polymeric microspheres in skincare and cosmetic formulations for texture enhancement and controlled release of active ingredients. | Improved product feel and spreadability, enhanced sensory appeal, controlled ingredient delivery, and better formulation stability. |
|
|
Incorporation of hollow microspheres in industrial and architectural coatings to improve film build and reduce weight. | Enhanced coverage efficiency, reduced paint consumption, improved insulation properties, and consistent surface finish. |
|
|
Use of microspheres in lightweight composite components and underbody coatings for vehicle weight reduction. | Improved fuel efficiency, reduced vehicle weight, enhanced corrosion resistance, and better noise and vibration damping. |
|
|
Deployment of hollow microspheres in drilling fluids and cementing systems for density control and thermal insulation. | Optimized fluid performance, improved well stability, reduced operational risks, and enhanced efficiency in deep-well drilling operations. |




Logos and trademarks shown above are the property of their respective owners. Their use here is for informational and illustrative purposes only.
MARKET ECOSYSTEM
The microspheres market is an ecosystem consisting of raw material suppliers (Ciner Group, Tokuyama Corporation, PQ, Cabot Corporation) and end users (Unilever, Baker Hughes Company, PPG Industries, Inc., Toyota Motor Corporation). Examples of raw materials used by microsphere manufacturers include glass, polymer resins, ceramics, and fly ash. These materials can be processed into hollow and solid microspheres, which possess specific engineered characteristics that include low density, thermal insulation, controlled particle size, and improved flowability. When end-users consume a high-performance microsphere, it helps reduce product weight, improve product durability, enhance surface finishes, and enable controlled release functionality. Therefore, end-users create demand for multi-functional materials, and manufacturers provide consistency of quality, scalability, and application-driven/unique customisations to deliver these materials to end-users.
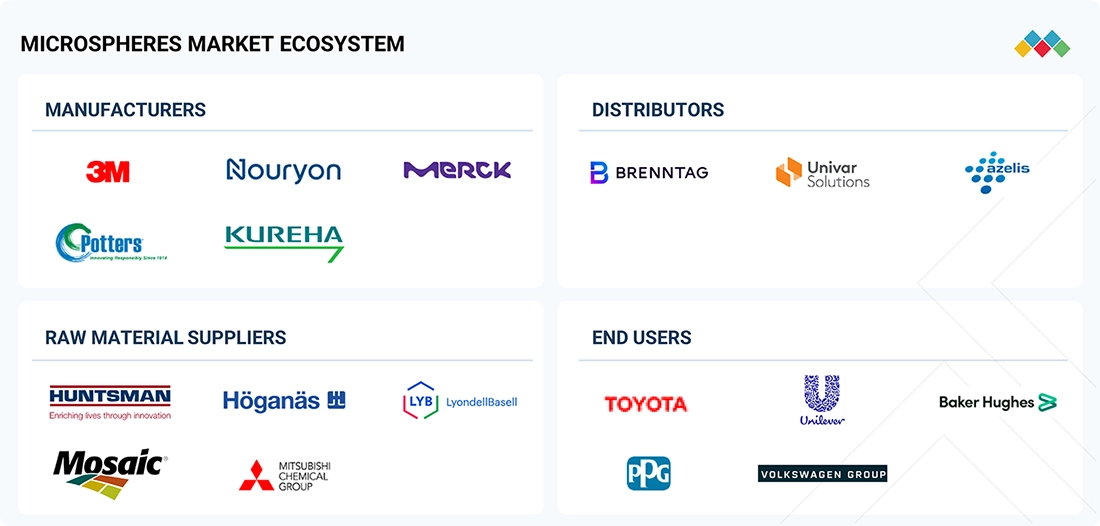
Logos and trademarks shown above are the property of their respective owners. Their use here is for informational and illustrative purposes only.
MARKET SEGMENTS
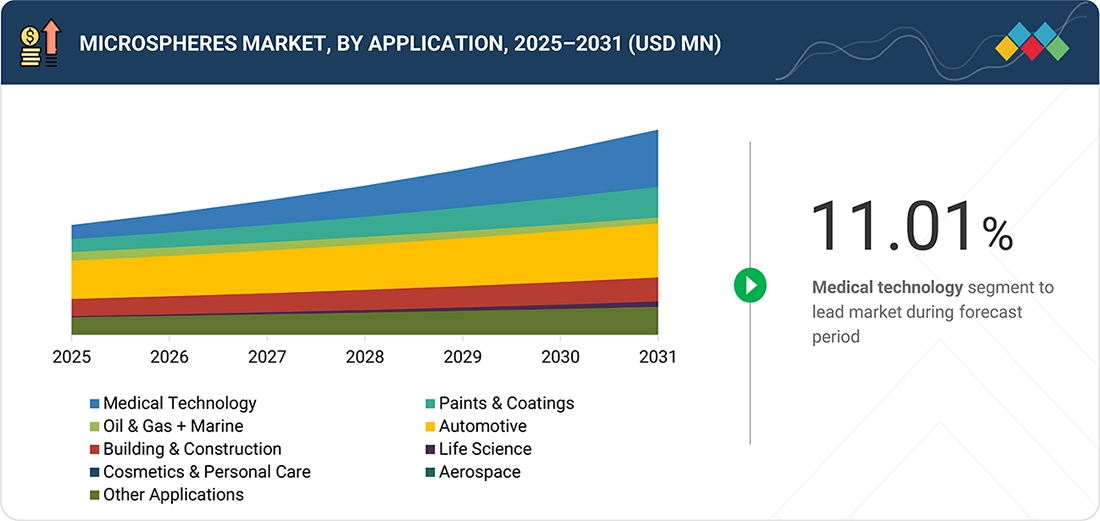
Source: Secondary Research, Interviews with Experts, MarketsandMarkets Analysis
In 2025, the hollow segment accounted for the largest market share. Hollow microspheres are experiencing a significant increase in demand due to their ability to provide substantial weight reductions while yielding comparable performance in terms of functionality. The weight reduction created by the void provides benefits ranging from improved fuel efficiency to reduced shipping costs. Materials manufacturing is actively working toward meeting efficiency and sustainability goals by replacing heavier materials with lightweight materials.
In 2025, the polymer segment accounted for the largest market share. Polymer microspheres provide excellent compatibility with many types of organic materials (resins, glues, adhesives, etc.) used in the manufacture of coatings and adhesives, resulting in efficient mixing and stable dispersion of polymer microspheres into various formulations. The strong compatibility of polymer microspheres with organic materials reduces the challenges associated with formulating polymers; therefore, polymer microspheres provide the advantage of improved consistency, going from processing to application for manufacturing industries that rely on complex chemical systems. As advanced formulations become more common, the compatibility of polymer microspheres with organic systems will increase the demand for this product class in an array of applications.
In 2025, the medical technology segment accounted for the largest market share in terms of value. Advancements in medical technology are creating less invasive surgical procedures. Since microspheres are created in a standard size and shape, they can be delivered accurately through small catheters into hard-to-reach areas and can allow for very precise and accurate treatment without an invasive surgical procedure, resulting in lower risks and improved patient safety and comfort while decreasing overall costs for the healthcare system, fueling growth.
REGION
North America to be fastest-growing region in global microspheres market during forecast period
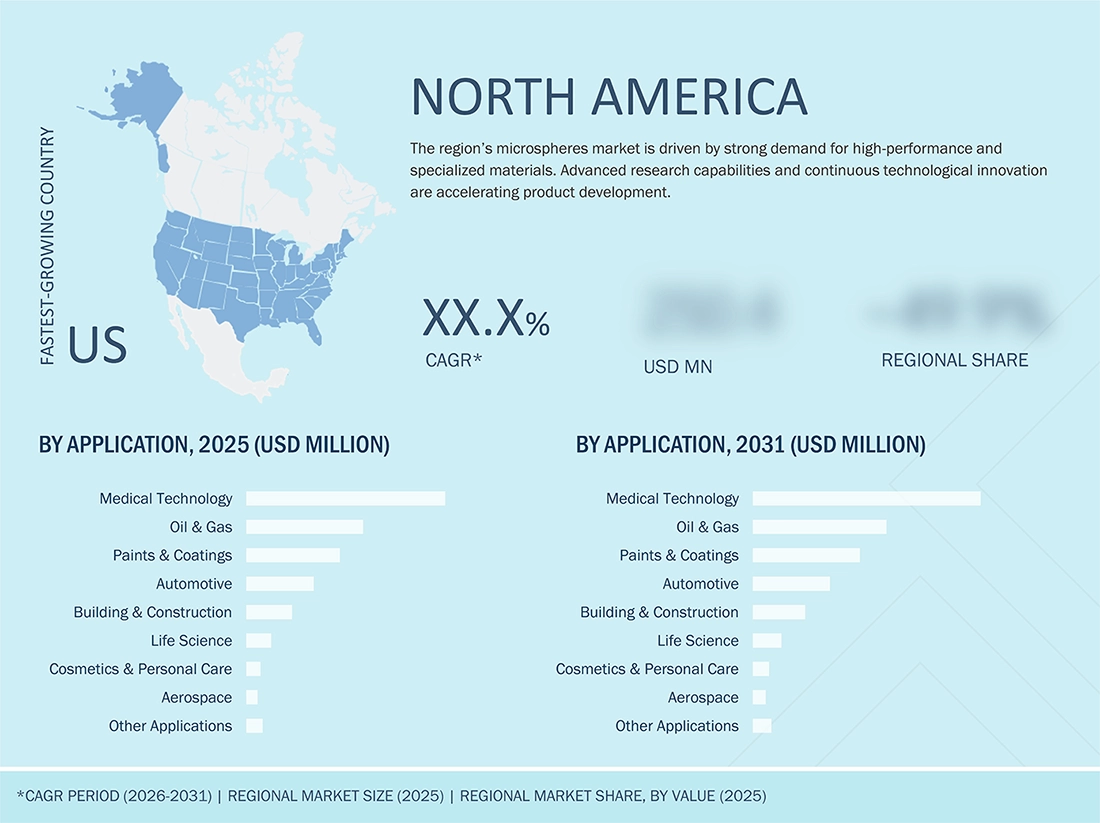
North America accounted for the largest share of the global microspheres market in 2025. The market in this region is also projected to witness the highest growth rate during the forecast period. The aerospace sector in North America has been recognized as one of the most active areas of technological and material innovation, with a primary emphasis on reducing the weight of aircraft structures without compromising on performance, while also maximizing their structural integrity. By incorporating microspheres into composite materials, sealant applications, and various types of coatings, manufacturers are able to lower the overall density of these materials without any detriment to performance characteristics. This supports a continued increase in demand for innovative, advanced materials like microsphere composites in North America's aerospace manufacturing industry.
MICROSPHERES MARKET: COMPANY EVALUATION MATRIX
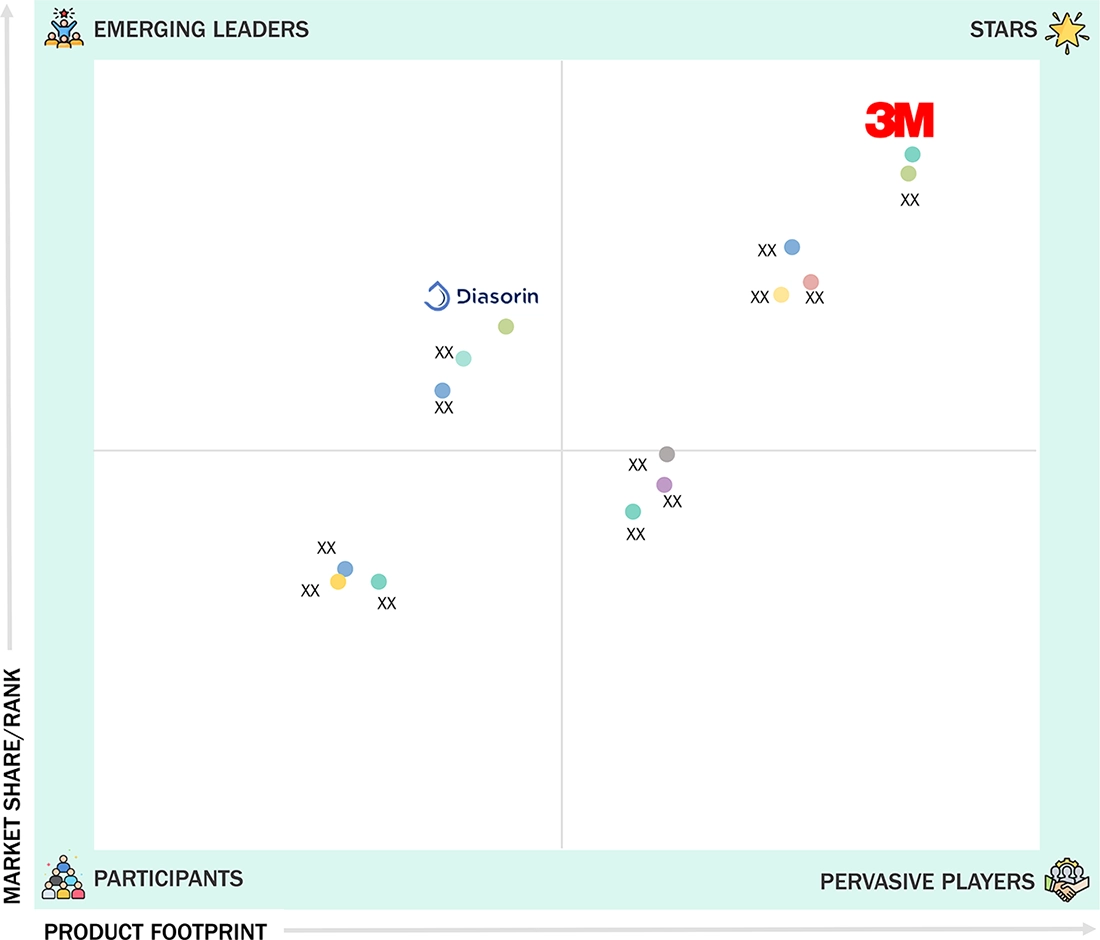
In the microspheres market matrix, 3M Company (Star) leads with a strong market share and broad product portfolio in glass and polyethylene materials, which are used in many building products, automotive parts, healthcare applications, oil and gas, and other related industries. DiaSorin S.p.A. (Emerging Leader) is more focused on utilizing technology for creating diagnostic and immunoassay platforms to manufacture microspheres for use in advanced life sciences and healthcare applications. While 3M leads in terms of supply chain strength, technological breadth, and product diversity, DiaSorin's strengths lie in its ability to provide innovative solutions for specific applications.
Source: Secondary Research, Interviews with Experts, MarketsandMarkets Analysis
KEY MARKET PLAYERS
- 3M Company (US)
- Nouryon (Netherlands)
- Merck KGaA (Germany)
- Potters Industries LLC (US)
- Thermo Fisher Scientific Inc. (US)
- Diasorin S.p.A. (Italy)
- Merit Medical Systems, Inc. (US)
- Terumo Corporation (Japan)
- Jiangsu NOVORAY New Material Co., Ltd. (China)
- Kureha Corporation (Japan)
MARKET SCOPE
| REPORT METRIC | DETAILS |
|---|---|
| Market Size in 2025 (Value) | USD 4.05 Billion |
| Market Size in 2026 (Value) | USD 4.36 Billion |
| Market Size in 2031 (Value) | USD 6.47 Billion |
| Growth Rate | CAGR of 8.23% from 2026 to 2031 |
| Years Considered | 2023–2031 |
| Base Year | 2025 |
| Forecast Period | 2026–2031 |
| Units Considered | Value (USD Million/Billion) |
| Report Coverage | Revenue forecast, company ranking, competitive landscape, growth factors, and trends |
| Segments Covered | By Type: Hollow, Solid l By Raw Material: Glass, Polymer, Ceramic, Fly Ash, Metallic, Other Raw Materials l By Application: Building & Construction, Medical Technology, Life Science, Paints & Coatings, Automotive, Cosmetics & Personal Care, Oil & Gas + Marine, Aerospace, Other Applications |
| Regions Covered | Asia Pacific, Europe, North America, Middle East & Africa, and South America |
WHAT IS IN IT FOR YOU: MICROSPHERES MARKET REPORT CONTENT GUIDE
DELIVERED CUSTOMIZATIONS
We have successfully delivered the following deep-dive customizations:
| CLIENT REQUEST | CUSTOMIZATION DELIVERED | VALUE ADDS |
|---|---|---|
| Europe-based Microspheres Manufacturer |
|
|
| Asia Pacific-based Microspheres Manufacturer |
|
|
RECENT DEVELOPMENTS
- March 2025 : Nouryon launched its new microspheres, an extra-small grade designed especially for interior paints.
- December 2024 : Brenntag SE extended its distribution agreement with 3M Company for glass bubbles, expanding the partnership beyond the UK into France and Iberia. This collaboration enhances regional access to hollow glass microspheres from 3M Company.
- April 2024 : Terumo launched BioPearl microspheres, the first resorbable drug-eluting microspheres designed for embolization procedures.
- October 2023 : Merit Medical Systems, Inc. launched the Maestro microcatheter line to support advanced embolization procedures, including the delivery of Embosphere Microspheres.
- June 2023 : Potters Industries LLC acquired glass bead production assets formerly owned by Ennis-Flint Inc. in Palestine, Texas and Thomasville, North Carolina.
Table of Contents
 Exclusive indicates content/data unique to MarketsandMarkets and not available with any competitors.
TITLE
PAGE NO
1
INTRODUCTION
21
2
EXECUTIVE SUMMARY
28
3
PREMIUM INSIGHTS
33
4
MARKET OVERVIEW
36
4.1
INTRODUCTION
4.2
MARKET DYNAMICS
4.2.1
DRIVERS
4.2.1.1
DEMAND FOR LIGHTWEIGHT & HIGH-PERFORMANCE MATERIALS
4.2.1.2
RISING DEMAND IN MEDICAL & DRUG DELIVERY APPLICATIONS
4.2.2
RESTRAINTS
4.2.2.1
RAW MATERIAL PRICE VOLATILITY
4.2.2.2
HIGH PRODUCTION AND CAPITAL COSTS
4.2.3
OPPORTUNITIES
4.2.3.1
EXPANSION IN BIOMEDICAL AND PHARMACEUTICAL FIELDS
4.2.3.2
ADVANCING SUSTAINABLE AND BIODEGRADABLE MICROSPHERE SOLUTIONS
4.2.4
CHALLENGES
4.2.4.1
COMPLEX MANUFACTURING PROCESSES
4.2.4.2
LIMITATIONS IN SCALING PRODUCTION
4.3
INTERCONNECTED MARKETS AND CROSS-SECTOR OPPORTUNITIES
4.3.1
INTERCONNECTED MARKETS
4.3.2
CROSS-SECTOR OPPORTUNITIES
5
INDUSTRY TRENDS
41
5.1
PORTER’S FIVE FORCES ANALYSIS
5.1.1
THREAT OF NEW ENTRANTS
5.1.2
THREAT OF SUBSTITUTES
5.1.3
BARGAINING POWER OF SUPPLIERS
5.1.4
BARGAINING POWER OF BUYERS
5.1.5
INTENSITY OF COMPETITIVE RIVALRY
5.2
MACROECONOMIC INDICATORS
5.2.1
INTRODUCTION
5.2.2
GDP TRENDS AND FORECAST
5.2.3
TRENDS IN GLOBAL CONSTRUCTION INDUSTRY
5.2.4
TRENDS IN GLOBAL PAINTS & COATINGS INDUSTRY
5.2.5
TRENDS IN GLOBAL MEDICAL & LIFE SCIENCE INDUSTRY
5.2.6
TRENDS IN GLOBAL COSMETICS & PERSONAL CARE INDUSTRY
5.2.7
TRENDS IN GLOBAL AUTOMOTIVE INDUSTRY
5.2.8
TRENDS IN GLOBAL OIL & GAS INDUSTRY
5.3
SUPPLY CHAIN ANALYSIS
5.4
ECOSYSTEM ANALYSIS
5.5
TRADE ANALYSIS
5.5.1
IMPORT SCENARIO (HS CODE 701820)
5.5.2
EXPORT SCENARIO (HS CODE 701820)
5.6
KEY CONFERENCES & EVENTS IN 2026–2027
5.7
TRENDS/DISRUPTIONS IMPACTING CUSTOMERS' BUSINESSES
5.8
INVESTMENT AND FUNDING SCENARIO
5.9
CASE STUDY ANALYSIS
5.9.1
HIGH-PERFORMANCE COOL ROOF COATING ENABLED BY EXPANDABLE MICROSPHERES
5.9.2
LIGHTWEIGHT TPO COMPONENTS ENABLED BY GLASS MICROSPHERES
5.9.3
ADVANCED WINE CORK SOLUTIONS ENABLED BY EXPANDABLE MICROSPHERES OF NOURYON
5.10
IMPACT OF 2025 US TARIFF - MICROSPHERES MARKET
5.10.1
INTRODUCTION
5.10.2
KEY TARIFF RATES
5.10.3
PRICE IMPACT ANALYSIS
5.10.4
IMPACT ON COUNTRY/REGION
5.10.4.1
US
5.10.4.2
EUROPE
5.10.4.3
ASIA PACIFIC
5.10.5
IMPACT ON APPLICATIONS
6
TECHNOLOGICAL ADVANCEMENTS, AI-DRIVEN IMPACT, PATENTS, AND INNOVATIONS
64
6.1
KEY EMERGING TECHNOLOGIES
6.1.1
POLYMERIZATION TECHNOLOGY
6.1.2
THERMAL SPHEROIDIZATION
6.2
COMPLEMENTARY TECHNOLOGIES
6.2.1
MICROFLUIDICS
6.2.2
SURFACE FUNCTIONALIZATION TECHNOLOGIES
6.3
TECHNOLOGY/PRODUCT ROADMAP
6.3.1
SHORT-TERM (2025–2027)
6.3.2
MID-TERM (2027–2030) | EXPANSION & STANDARDIZATION
6.3.3
LONG-TERM (2030–2035+)
6.4
PATENT ANALYSIS
6.4.1
APPROACH
6.4.2
DOCUMENT TYPE
6.4.3
TOP APPLICANTS
6.4.4
JURISDICTION ANALYSIS
6.5
IMPACT OF AI/GEN AI
6.5.1
TOP USE CASES AND MARKET POTENTIAL
6.5.2
BEST PRACTICES IN MICROSPHERES PROCESSING
6.5.3
CASE STUDIES OF AI IMPLEMENTATION IN MICROSPHERES MARKET
6.5.4
INTERCONNECTED ADJACENT ECOSYSTEM AND IMPACT ON MARKET PLAYERS
6.5.5
CLIENTS' READINESS TO ADOPT GENERATIVE AI IN MICROSPHERES MARKET
7
REGULATORY LANDSCAPE AND SUSTAINABILITY INITIATIVES
75
7.1
REGIONAL REGULATIONS AND COMPLIANCE
7.1.1
REGULATORY BODIES, GOVERNMENT AGENCIES, AND OTHER ORGANIZATIONS
7.1.2
INDUSTRY STANDARDS
7.2
SUSTAINABILITY INITIATIVES
7.2.1
RESOURCE EFFICIENCY & LIGHTWEIGHTING
7.2.2
ENVIRONMENTAL SAFETY & COMPLIANCE
7.3
SUSTAINABILITY IMPACT AND REGULATORY POLICY INITIATIVES
7.4
CERTIFICATIONS, LABELING, AND ECO-STANDARDS
8
CUSTOMER LANDSCAPE & BUYER BEHAVIOR
83
8.1
DECISION-MAKING PROCESS
8.2
BUYER STAKEHOLDERS AND BUYING EVALUATION CRITERIA
8.2.1
KEY STAKEHOLDERS IN BUYING PROCESS
8.2.2
BUYING CRITERIA
8.3
ADOPTION BARRIERS & INTERNAL CHALLENGES
8.4
UNMET NEEDS IN VARIOUS APPLICATIONS
9
MICROSPHERES MARKET, BY RAW MATERIAL
88
9.1
INTRODUCTION
9.2
GLASS MICROSPHERES
9.3
POLYMER MICROSPHERES
9.4
CERAMIC MICROSPHERES
9.5
FLY ASH MICROSPHERES
9.6
METALLIC MICROSPHERES
9.7
OTHER MICROSPHERES
10
MICROSPHERES MARKET, BY TYPE
92
10.1
INTRODUCTION
10.2
HOLLOW MICROSPHERES
10.3
SOLID MICROSPHERES
11
MICROSPHERES MARKET, BY APPLICATION
95
11.1
INTRODUCTION
11.2
BUILDING & CONSTRUCTION
11.2.1
LOW DENSITY AND THERMAL INSULATION DRIVING MICROSPHERES ADOPTION
11.3
MEDICAL TECHNOLOGY
11.3.1
RISING USE OF MICROSPHERES IN DRUG DELIVERY AND MEDICAL TREATMENTS
11.4
LIFE SCIENCE & BIOTECHNOLOGY
11.4.1
INCREASING USE OF MICROSPHERES IN DIAGNOSTICS, RESEARCH, AND BIOTECHNOLOGY APPLICATIONS
11.5
PAINTS & COATINGS
11.5.1
ENHANCED PERFORMANCE AND INSULATION BENEFITS DRIVING MARKET
11.6
COSMETICS & PERSONAL CARE
11.6.1
SHIFT TOWARD SUSTAINABLE ALTERNATIVES
11.7
OIL & GAS
11.7.1
OPERATIONAL EFFICIENCY AND LIGHTWEIGHT FLUID SYSTEMS ENCOURAGING ADOPTION
11.8
AUTOMOTIVE
11.8.1
LIGHTWEIGHTING AND PERFORMANCE ENHANCEMENT PROPELLING MARKET GROWTH
11.9
AEROSPACE
11.9.1
ENABLING LIGHTWEIGHT AND HIGH-PERFORMANCE MATERIALS IN AEROSPACE APPLICATION
11.10
OTHER APPLICATIONS
12
MICROSPHERES MARKET, BY REGION
113
12.1
INTRODUCTION
12.2
NORTH AMERICA
12.2.1
US
12.2.1.1
STRONG INDUSTRIAL BASE AND END-USE DEMAND DRIVING MARKET
12.2.2
CANADA
12.2.2.1
OIL & GAS LEADERSHIP AND R&D EXPANSION SUPPORTING MARKET GROWTH
12.2.3
MEXICO
12.2.3.1
MANUFACTURING EXPANSION AND INDUSTRIAL DEMAND SUPPORTING MICROSPHERES ADOPTION
12.3
EUROPE
12.3.1
GERMANY
12.3.1.1
TECHNOLOGICAL ADVANCEMENT AND INDUSTRIAL DEMAND STRENGTHENING MARKET
12.3.2
FRANCE
12.3.2.1
STRONG INDUSTRIAL APPLICATIONS AND ESTABLISHED MANUFACTURING ECOSYSTEMS
12.3.3
UK
12.3.3.1
ADVANCED HEALTHCARE ECOSYSTEM AND INDUSTRIAL APPLICATIONS SHAPING MARKET
12.3.4
ITALY
12.3.4.1
DIVERSE INDUSTRIAL APPLICATIONS AND AUTOMOTIVE SHIFT INFLUENCING MARKET
12.3.5
SPAIN
12.3.5.1
INDUSTRIAL EXPANSION AND EMERGING LIFE SCIENCE APPLICATIONS DRIVING MARKET
12.4
ASIA PACIFIC
12.4.1
CHINA
12.4.1.1
INDUSTRIAL EXPANSION AND STRONG PRODUCTION BASE DRIVING MARKET
12.4.2
JAPAN
12.4.2.1
ESTABLISHED AUTOMOTIVE AND MEDICAL SECTORS SUPPORTING MARKET
12.4.3
INDIA
12.4.3.1
RAPID MARKET EXPANSION AND GROWING INDUSTRIAL APPLICATIONS
12.4.4
SOUTH KOREA
12.4.4.1
RAPID INDUSTRIALIZATION AND TECHNOLOGICAL ADVANCEMENTS DRIVING MARKET
12.5
MIDDLE EAST & AFRICA
12.6
SOUTH AMERICA
12.6.1
BRAZIL
12.6.1.1
DOMINANT REGIONAL POSITION AND EXPANDING INDUSTRIAL APPLICATIONS
13
COMPETITIVE LANDSCAPE
145
13.1
INTRODUCTION
13.2
KEY PLAYERS’ STRATEGIES/RIGHT TO WIN, JANUARY 2021–MARCH 2026
13.3
MARKET SHARE ANALYSIS, 2025
13.4
REVENUE ANALYSIS, 2023–2025
13.5
COMPANY EVALUATION MATRIX: KEY PLAYERS, 2025
13.5.1
STARS
13.5.2
EMERGING LEADERS
13.5.3
PERVASIVE PLAYERS
13.5.4
PARTICIPANTS
13.5.5
COMPANY FOOTPRINT: KEY PLAYERS, 2025
13.5.5.1
COMPANY FOOTPRINT
13.5.5.2
REGION FOOTPRINT
13.5.5.3
TYPE FOOTPRINT
13.5.5.4
RAW MATERIAL FOOTPRINT
13.5.5.5
APPLICATION FOOTPRINT
13.6
COMPANY EVALUATION MATRIX: STARTUPS/SMES, 2025
13.6.1
PROGRESSIVE COMPANIES
13.6.2
RESPONSIVE COMPANIES
13.6.3
DYNAMIC COMPANIES
13.6.4
STARTING BLOCKS
13.6.5
COMPETITIVE BENCHMARKING: STARTUPS/SMES, 2025
13.6.5.1
DETAILED LIST OF KEY STARTUPS/SMES
13.6.5.2
COMPETITIVE BENCHMARKING OF KEY STARTUPS/SMES
13.7
BRAND/PRODUCT COMPARISON
13.8
COMPANY VALUATION AND FINANCIAL METRICS
13.9
COMPETITIVE SCENARIO
13.9.1
PRODUCT LAUNCHES
13.9.2
DEALS
13.9.3
EXPANSIONS
14
COMPANY PROFILES
164
14.1
KEY PLAYERS
14.1.1
3M COMPANY
14.1.1.1
BUSINESS OVERVIEW
14.1.1.2
PRODUCTS/SOLUTIONS/SERVICES OFFERED
14.1.1.3
RECENT DEVELOPMENTS
14.1.1.3.1
DEALS
14.1.1.4
MNM VIEW
14.1.1.4.1
KEY STRENGTHS
14.1.1.4.2
STRATEGIC CHOICES
14.1.1.4.3
WEAKNESSES AND COMPETITIVE THREATS
14.1.2
NOURYON
14.1.3
THERMO FISHER SCIENTIFIC INC.
14.1.4
POTTERS INDUSTRIES LLC
14.1.5
MERCK KGAA
14.1.6
DIASORIN S.P.A.
14.1.7
MERIT MEDICAL SYSTEMS, INC.
14.1.8
TERUMO CORPORATION
14.1.9
JIANGSU NOVORAY NEW MATERIAL CO., LTD.
14.1.10
KUREHA CORPORATION
14.2
STARTUP/SMES
14.2.1
TRELLEBORG AB
14.2.2
CHASE CORPORATION
14.2.3
SINOSTEEL MAANSHAN NEW MATERIAL TECHNOLOGY CO., LTD.
14.2.4
MOMENTIVE PERFORMANCE MATERIALS INC.
14.2.5
SUZHOU NANOMICRO TECHNOLOGY CO., LTD.
14.2.6
POLYSCIENCES, INC.
14.2.7
MITSUI CHEMICALS, INC.
14.2.8
ZHENGZHOU HOLLOWLITE MATERIALS CO., LTD.
14.2.9
MATSUMOTO YUSHI SEIYAKU CO., LTD.
14.2.10
SIGMUND LINDNER GMBH
14.2.11
LINGSHOU COUNTY KEHUI MICA CO., LTD.
14.2.12
LAMBERTI S.P.A.
14.2.13
OMYA INTERNATIONAL AG
14.2.14
CRERAX SCIENCE AND TECHNOLOGY CO., LTD.
14.2.15
WAYTOP MICROSPHERES CO., LTD.
15
RESEARCH METHODOLOGY
204
15.1
RESEARCH DATA
15.1.1
SECONDARY DATA
15.1.1.1
KEY DATA FROM SECONDARY SOURCES
15.1.2
PRIMARY DATA
15.1.2.1
KEY DATA FROM PRIMARY SOURCES
15.1.2.2
KEY PRIMARY PARTICIPANTS
15.1.2.3
BREAKDOWN OF PRIMARY INTERVIEWS
15.1.2.4
KEY INDUSTRY INSIGHTS
15.2
MARKET SIZE ESTIMATION
15.2.1
BOTTOM-UP APPROACH
15.2.2
TOP-DOWN APPROACH
15.3
GROWTH FORECAST
15.3.1
SUPPLY-SIDE ANALYSIS
15.3.2
DEMAND-SIDE ANALYSIS
15.4
DATA TRIANGULATION
15.5
FACTOR ANALYSIS
15.6
RESEARCH ASSUMPTIONS
15.7
RESEARCH LIMITATIONS
15.8
RISK ASSESSMENT
16
APPENDIX
216
16.1
DISCUSSION GUIDE
16.2
KNOWLEDGESTORE: MARKETSANDMARKETS’ SUBSCRIPTION PORTAL
16.3
CUSTOMIZATION OPTIONS
16.4
RELATED REPORTS
16.5
AUTHOR DETAILS
LIST OF TABLES
TABLE 1
MICROSPHERES MARKET: IMPACT OF PORTER’S FIVE FORCES
TABLE 2
GDP TRENDS AND FORECAST OF MAJOR ECONOMIES, 2021–2030 (USD BILLION)
TABLE 3
GLOBAL PAINTS & COATINGS MARKET, BY END-USE INDUSTRY, 2024–2030 (USD BILLION)
TABLE 4
GLOBAL CRUDE OIL PRODUCTION: KEY COUNTRIES, 2024
TABLE 5
MICROSPHERES MARKET: ROLE OF COMPANIES IN ECOSYSTEM
TABLE 6
IMPORT DATA FOR HS CODE 701820, 2020–2024 (USD MILLION)
TABLE 7
EXPORT DATA FOR HS CODE 701820, 2020–2024 (USD MILLION)
TABLE 8
MICROSPHERES MARKET: DETAILED LIST OF CONFERENCES & EVENTS, 2026–2027
TABLE 9
MICROSPHERES MARKET: INVESTMENT AND FUNDING SCENARIO, 2024–2025
TABLE 10
US ADJUSTED RECIPROCAL TARIFF RATES
TABLE 11
PATENT STATUS: PATENT APPLICATIONS AND GRANTED PATENTS
TABLE 12
LIST OF MAJOR PATENTS RELATED TO MICROSPHERES, 2015–2025
TABLE 13
TOP USE CASES AND MARKET POTENTIAL
TABLE 14
BEST PRACTICES: COMPANIES IMPLEMENTING USE CASES
TABLE 15
MICROSPHERES MARKET: CASE STUDIES RELATED TO GEN AI IMPLEMENTATION
TABLE 16
INTERCONNECTED ADJACENT ECOSYSTEM AND IMPACT ON MARKET PLAYERS
TABLE 17
GLOBAL: REGULATORY BODIES, GOVERNMENT AGENCIES, AND OTHER ORGANIZATIONS
TABLE 18
NORTH AMERICA: REGULATORY BODIES, GOVERNMENT AGENCIES, AND OTHER ORGANIZATIONS
TABLE 19
EUROPE: REGULATORY BODIES, GOVERNMENT AGENCIES, AND OTHER ORGANIZATIONS
TABLE 20
ASIA PACIFIC: REGULATORY BODIES, GOVERNMENT AGENCIES, AND OTHER ORGANIZATIONS
TABLE 21
SOUTH AMERICA: REGULATORY BODIES, GOVERNMENT AGENCIES, AND OTHER ORGANIZATIONS
TABLE 22
MIDDLE EAST & AFRICA: REGULATORY BODIES, GOVERNMENT AGENCIES, AND OTHER ORGANIZATIONS
TABLE 23
CERTIFICATIONS, LABELING, AND ECO-STANDARDS IN MICROSPHERES MARKET
TABLE 24
INFLUENCE OF STAKEHOLDERS ON BUYING PROCESS FOR TOP THREE APPLICATIONS (%)
TABLE 25
KEY BUYING CRITERIA FOR TOP THREE APPLICATIONS
TABLE 26
MICROSPHERES MARKET: UNMET NEEDS IN KEY APPLICATIONS
TABLE 27
MICROSPHERES MARKET, BY RAW MATERIAL, 2023–2025 (USD MILLION)
TABLE 28
MICROSPHERES MARKET, BY RAW MATERIAL, 2026–2031 (USD MILLION)
TABLE 29
MICROSPHERES MARKET, BY TYPE, 2023–2025 (USD MILLION)
TABLE 30
MICROSPHERES MARKET, BY TYPE, 2026–2031 (USD MILLION)
TABLE 31
INDUSTRY-WISE APPLICATIONS OF MICROSPHERES
TABLE 32
MICROSPHERES MARKET, BY APPLICATION, 2023–2025 (USD MILLION)
TABLE 33
MICROSPHERES MARKET, BY APPLICATION, 2026–2031 (USD MILLION)
TABLE 34
BUILDING & CONSTRUCTION: MICROSPHERES MARKET, BY REGION, 2023–2025 (USD MILLION)
TABLE 35
BUILDING & CONSTRUCTION: MICROSPHERES MARKET, BY REGION, 2026–2031 (USD MILLION)
TABLE 36
BUILDING & CONSTRUCTION: MICROSPHERES MARKET, BY SUB-APPLICATION, 2023–2025 (USD MILLION)
TABLE 37
BUILDING & CONSTRUCTION: MICROSPHERES MARKET, BY SUB-APPLICATION, 2026–2031 (USD MILLION)
TABLE 38
MEDICAL TECHNOLOGY: MICROSPHERES MARKET, BY REGION, 2023–2025 (USD MILLION)
TABLE 39
MEDICAL TECHNOLOGY: MICROSPHERES MARKET, BY REGION, 2026–2031 (USD MILLION)
TABLE 40
LIFE SCIENCE & BIOTECHNOLOGY: MICROSPHERES MARKET, BY REGION, 2023–2025 (USD MILLION)
TABLE 41
LIFE SCIENCE & BIOTECHNOLOGY: MICROSPHERES MARKET, BY REGION, 2026–2031 (USD MILLION)
TABLE 42
PAINTS & COATINGS: MICROSPHERES MARKET, BY REGION, 2023–2025 (USD MILLION)
TABLE 43
PAINTS & COATINGS: MICROSPHERES MARKET, BY REGION, 2026–2031 (USD MILLION)
TABLE 44
PAINTS & COATINGS: MICROSPHERES MARKET, BY SUB-APPLICATION, 2023–2025 (USD MILLION)
TABLE 45
PAINTS & COATINGS: MICROSPHERES MARKET, BY SUB-APPLICATION, 2026–2031 (USD MILLION)
TABLE 46
COSMETICS & PERSONAL CARE: MICROSPHERES MARKET, BY REGION, 2023–2025 (USD MILLION)
TABLE 47
COSMETICS & PERSONAL CARE: MICROSPHERES MARKET, BY REGION, 2026–2031 (USD MILLION)
TABLE 48
OIL & GAS: MICROSPHERES MARKET, BY REGION, 2023–2025 (USD MILLION)
TABLE 49
OIL & GAS: MICROSPHERES MARKET, BY REGION, 2026–2031 (USD MILLION)
TABLE 50
AUTOMOTIVE: MICROSPHERES MARKET, BY REGION, 2023–2025 (USD MILLION)
TABLE 51
AUTOMOTIVE: MICROSPHERES MARKET, BY REGION, 2026–2031 (USD MILLION)
TABLE 52
AUTOMOTIVE: MICROSPHERES MARKET, BY SUB-APPLICATION, 2023–2025 (USD MILLION)
TABLE 53
AUTOMOTIVE: MICROSPHERES MARKET, BY SUB-APPLICATION, 2026–2031 (USD MILLION)
TABLE 54
AEROSPACE: MICROSPHERES MARKET, BY REGION, 2023–2025 (USD MILLION)
TABLE 55
AEROSPACE: MICROSPHERES MARKET, BY REGION, 2026–2031 (USD MILLION)
TABLE 56
OTHER APPLICATIONS: MICROSPHERES MARKET, BY REGION, 2023–2025 (USD MILLION)
TABLE 57
OTHER APPLICATIONS: MICROSPHERES MARKET, BY REGION, 2026–2031 (USD MILLION)
TABLE 58
MICROSPHERES MARKET, BY REGION, 2023–2025 (USD MILLION)
TABLE 59
MICROSPHERES MARKET, BY REGION, 2026–2031 (USD MILLION)
TABLE 60
NORTH AMERICA: MICROSPHERES MARKET, BY COUNTRY, 2023–2025 (USD MILLION)
TABLE 61
NORTH AMERICA: MICROSPHERES MARKET, BY COUNTRY, 2026–2031 (USD MILLION)
TABLE 62
NORTH AMERICA: MICROSPHERES MARKET, BY APPLICATION, 2023–2025 (USD MILLION)
TABLE 63
NORTH AMERICA: MICROSPHERES MARKET, BY APPLICATION, 2026–2031 (USD MILLION)
TABLE 64
US: MICROSPHERES MARKET, BY APPLICATION, 2023–2025 (USD MILLION)
TABLE 65
US: MICROSPHERES MARKET, BY APPLICATION, 2026–2031 (USD MILLION)
TABLE 66
CANADA: MICROSPHERES MARKET, BY APPLICATION, 2023–2025 (USD MILLION)
TABLE 67
CANADA: MICROSPHERES MARKET, BY APPLICATION, 2026–2031 (USD MILLION)
TABLE 68
MEXICO: MICROSPHERES MARKET, BY APPLICATION, 2023–2025 (USD MILLION)
TABLE 69
MEXICO: MICROSPHERES MARKET, BY APPLICATION, 2026–2031 (USD MILLION)
TABLE 70
EUROPE: MICROSPHERES MARKET, BY COUNTRY, 2023–2025 (USD MILLION)
TABLE 71
EUROPE: MICROSPHERES MARKET, BY COUNTRY, 2026–2031 (USD MILLION)
TABLE 72
EUROPE: MICROSPHERES MARKET, BY APPLICATION, 2023–2025 (USD MILLION)
TABLE 73
EUROPE: MICROSPHERES MARKET, BY APPLICATION, 2026–2031 (USD MILLION)
TABLE 74
GERMANY: MICROSPHERES MARKET, BY APPLICATION, 2023–2025 (USD MILLION)
TABLE 75
GERMANY: MICROSPHERES MARKET, BY APPLICATION, 2026–2031 (USD MILLION)
TABLE 76
FRANCE: MICROSPHERES MARKET, BY APPLICATION, 2023–2025 (USD MILLION)
TABLE 77
FRANCE: MICROSPHERES MARKET, BY APPLICATION, 2026–2031 (USD MILLION)
TABLE 78
UK: MICROSPHERES MARKET, BY APPLICATION, 2023–2025 (USD MILLION)
TABLE 79
UK: MICROSPHERES MARKET, BY APPLICATION, 2026–2031 (USD MILLION)
TABLE 80
ITALY: MICROSPHERES MARKET, BY APPLICATION, 2023–2025 (USD MILLION)
TABLE 81
ITALY: MICROSPHERES MARKET, BY APPLICATION, 2026–2031 (USD MILLION)
TABLE 82
SPAIN: MICROSPHERES MARKET, BY APPLICATION, 2023–2025 (USD MILLION)
TABLE 83
SPAIN: MICROSPHERES MARKET, BY APPLICATION, 2026–2031 (USD MILLION)
TABLE 84
ASIA PACIFIC: MICROSPHERES MARKET, BY COUNTRY, 2023–2025 (USD MILLION)
TABLE 85
ASIA PACIFIC: MICROSPHERES MARKET, BY COUNTRY, 2026–2031 (USD MILLION)
TABLE 86
ASIA PACIFIC: MICROSPHERES MARKET, BY APPLICATION, 2023–2025 (USD MILLION)
TABLE 87
ASIA PACIFIC: MICROSPHERES MARKET, BY APPLICATION, 2026–2031 (USD MILLION)
TABLE 88
CHINA: MICROSPHERES MARKET, BY APPLICATION, 2023–2025 (USD MILLION)
TABLE 89
CHINA: MICROSPHERES MARKET, BY APPLICATION, 2026–2031 (USD MILLION)
TABLE 90
JAPAN: MICROSPHERES MARKET, BY APPLICATION, 2023–2025 (USD MILLION)
TABLE 91
JAPAN: MICROSPHERES MARKET, BY APPLICATION, 2026–2031 (USD MILLION)
TABLE 92
INDIA: MICROSPHERES MARKET, BY APPLICATION, 2023–2025 (USD MILLION)
TABLE 93
INDIA: MICROSPHERES MARKET, BY APPLICATION, 2026–2031 (USD MILLION)
TABLE 94
SOUTH KOREA: MICROSPHERES MARKET, BY APPLICATION, 2023–2025 (USD MILLION)
TABLE 95
SOUTH KOREA: MICROSPHERES MARKET, BY APPLICATION, 2026–2031 (USD MILLION)
TABLE 96
MIDDLE EAST & AFRICA: MICROSPHERES MARKET, BY APPLICATION, 2023–2025 (USD MILLION)
TABLE 97
MIDDLE EAST & AFRICA: MICROSPHERES MARKET, BY APPLICATION, 2026–2031 (USD MILLION)
TABLE 98
SOUTH AMERICA: MICROSPHERES MARKET, BY COUNTRY, 2023–2025 (USD MILLION)
TABLE 99
SOUTH AMERICA: MICROSPHERES MARKET, BY COUNTRY, 2026–2031 (USD MILLION)
TABLE 100
SOUTH AMERICA: MICROSPHERES MARKET, BY APPLICATION, 2023–2025 (USD MILLION)
TABLE 101
SOUTH AMERICA: MICROSPHERES MARKET, BY APPLICATION, 2026–2031 (USD MILLION)
TABLE 102
BRAZIL: MICROSPHERES MARKET, BY APPLICATION, 2023–2025 (USD MILLION)
TABLE 103
BRAZIL: MICROSPHERES MARKET, BY APPLICATION, 2026–2031 (USD MILLION)
TABLE 104
STRATEGIES ADOPTED BY KEY MICROSPHERES MANUFACTURERS, JANUARY 2021–MARCH 2026
TABLE 105
MICROSPHERES MARKET: DEGREE OF COMPETITION
TABLE 106
MICROSPHERES MARKET: REGION FOOTPRINT
TABLE 107
MICROSPHERES MARKET: TYPE FOOTPRINT
TABLE 108
MICROSPHERES MARKET: RAW MATERIAL FOOTPRINT
TABLE 109
MICROSPHERES MARKET: APPLICATION FOOTPRINT
TABLE 110
MICROSPHERES MARKET: DETAILED LIST OF KEY STARTUPS/SMES
TABLE 111
MICROSPHERES MARKET: COMPETITIVE BENCHMARKING OF KEY STARTUPS/SMES
TABLE 112
MICROSPHERES MARKET: PRODUCT LAUNCHES, JANUARY 2021–MARCH 2026
TABLE 113
MICROSPHERES MARKET: DEALS, JANUARY 2021–MARCH 2026
TABLE 114
MICROSPHERES MARKET: EXPANSIONS, JANUARY 2021–MARCH 2026
TABLE 115
3M COMPANY: COMPANY OVERVIEW
TABLE 116
3M COMPANY: PRODUCTS/SOLUTIONS/SERVICES OFFERED
TABLE 117
3M COMPANY: DEALS
TABLE 118
NOURYON: COMPANY OVERVIEW
TABLE 119
NOURYON: PRODUCTS/SOLUTIONS/SERVICES OFFERED
TABLE 120
NOURYON: PRODUCT LAUNCHES
TABLE 121
NOURYON: DEALS
TABLE 122
NOURYON: EXPANSIONS
TABLE 123
THERMO FISHER SCIENTIFIC INC.: COMPANY OVERVIEW
TABLE 124
THERMO FISHER SCIENTIFIC INC.: PRODUCTS/SOLUTIONS/SERVICES OFFERED
TABLE 125
POTTERS INDUSTRIES LLC: COMPANY OVERVIEW
TABLE 126
POTTERS INDUSTRIES LLC: PRODUCTS/SOLUTIONS/SERVICES OFFERED
TABLE 127
POTTERS INDUSTRIES LLC: DEALS
TABLE 128
POTTERS INDUSTRIES LLC: EXPANSIONS
TABLE 129
MERCK KGAA: COMPANY OVERVIEW
TABLE 130
MERCK KGAA: PRODUCTS/SOLUTIONS/SERVICES OFFERED
TABLE 131
DIASORIN S.P.A.: COMPANY OVERVIEW
TABLE 132
DIASORIN S.P.A.: PRODUCTS/SOLUTIONS/SERVICES OFFERED
TABLE 133
DIASORIN S.P.A.: PRODUCT LAUNCHES
TABLE 134
DIASORIN S.P.A.: DEALS
TABLE 135
MERIT MEDICAL SYSTEMS, INC.: COMPANY OVERVIEW
TABLE 136
MERIT MEDICAL SYSTEMS, INC.: PRODUCTS/SOLUTIONS/SERVICES OFFERED
TABLE 137
MERIT MEDICAL SYSTEMS, INC.: PRODUCT LAUNCHES
TABLE 138
TERUMO CORPORATION: COMPANY OVERVIEW
TABLE 139
TERUMO CORPORATION: PRODUCTS/SOLUTIONS/SERVICES OFFERED
TABLE 140
TERUMO CORPORATION: PRODUCT LAUNCHES
TABLE 141
TERUMO CORPORATION: DEALS
TABLE 142
JIANGSU NOVORAY NEW MATERIAL CO., LTD.: COMPANY OVERVIEW
TABLE 143
JIANGSU NOVORAY NEW MATERIAL CO., LTD.: PRODUCTS/SOLUTIONS/SERVICES OFFERED
TABLE 144
KUREHA CORPORATION: COMPANY OVERVIEW
TABLE 145
KUREHA CORPORATION: PRODUCTS/SOLUTIONS/SERVICES OFFERED
TABLE 146
TRELLEBORG AB: COMPANY OVERVIEW
TABLE 147
CHASE CORPORATION: COMPANY OVERVIEW
TABLE 148
SINOSTEEL MAANSHAN NEW MATERIAL TECHNOLOGY CO., LTD.: COMPANY OVERVIEW
TABLE 149
MOMENTIVE PERFORMANCE MATERIALS INC.: COMPANY OVERVIEW
TABLE 150
SUZHOU NANOMICRO TECHNOLOGY CO., LTD.: COMPANY OVERVIEW
TABLE 151
POLYSCIENCES, INC.: COMPANY OVERVIEW
TABLE 152
MITSUI CHEMICALS, INC.: COMPANY OVERVIEW
TABLE 153
ZHENGZHOU HOLLOWLITE MATERIALS CO., LTD.: COMPANY OVERVIEW
TABLE 154
MATSUMOTO YUSHI SEIYAKU CO., LTD.: COMPANY OVERVIEW
TABLE 155
SIGMUND LINDNER GMBH: COMPANY OVERVIEW
TABLE 156
LINGSHOU COUNTY KEHUI MICA CO., LTD.: COMPANY OVERVIEW
TABLE 157
LAMBERTI S.P.A.: COMPANY OVERVIEW
TABLE 158
OMYA INTERNATIONAL AG: COMPANY OVERVIEW
TABLE 159
CRERAX SCIENCE AND TECHNOLOGY CO., LTD.: COMPANY OVERVIEW
TABLE 160
WAYTOP MICROSPHERES CO., LTD.: COMPANY OVERVIEW
TABLE 161
MICROSPHERES MARKET: RISK ASSESSMENT
LIST OF FIGURES
FIGURE 1
MICROSPHERES MARKET SEGMENTATION AND REGIONAL SCOPE
FIGURE 2
KEY INSIGHTS AND MARKET SCENARIO
FIGURE 3
GLOBAL MICROSPHERES MARKET, 2023–2031
FIGURE 4
MAJOR STRATEGIES ADOPTED BY KEY PLAYERS IN MICROSPHERES MARKET
FIGURE 5
DISRUPTIVE TRENDS IMPACTING GROWTH OF MICROSPHERES MARKET
FIGURE 6
HIGH-GROWTH SEGMENTS IN MICROSPHERES MARKET, 2026–2031
FIGURE 7
NORTH AMERICA TO BE LARGEST AND FASTEST-GROWING MARKET DURING FORECAST PERIOD
FIGURE 8
ADVANCEMENTS IN HIGH-PERFORMANCE AND CUSTOMIZED MICROSPHERES TO DRIVE MARKET
FIGURE 9
NORTH AMERICA ACCOUNTED FOR LARGEST MARKET SHARE IN 2025
FIGURE 10
SOLID MICROSPHERES TO BE FASTEST-GROWING SEGMENT DURING FORECAST PERIOD
FIGURE 11
GERMANY TO RECORD HIGHEST CAGR DURING FORECAST PERIOD
FIGURE 12
MICROSPHERES MARKET: DRIVERS, RESTRAINTS, OPPORTUNITIES, AND CHALLENGES
FIGURE 13
MICROSPHERES MARKET: PORTER’S FIVE FORCES ANALYSIS
FIGURE 14
GLOBAL CONSTRUCTION OUTPUT, BY SECTOR, 2025
FIGURE 15
GLOBAL ELECTRIC VEHICLE SALES, 2019–2024
FIGURE 16
MICROSPHERES MARKET: SUPPLY CHAIN ANALYSIS
FIGURE 17
MICROSPHERES MARKET: KEY PARTICIPANTS IN ECOSYSTEM
FIGURE 18
MICROSPHERES MARKET: ECOSYSTEM ANALYSIS
FIGURE 19
IMPORT SCENARIO FOR HS CODE 701820, BY KEY COUNTRIES, 2020–2024
FIGURE 20
EXPORT SCENARIO FOR HS CODE 701820, BY KEY COUNTRIES, 2020–2024
FIGURE 21
TREND/DISRUPTIONS IMPACTING CUSTOMERS' BUSINESSES
FIGURE 22
PATENTS REGISTERED, 2015–2025
FIGURE 23
LIST OF MAJOR PATENTS RELATED TO MICROSPHERES
FIGURE 24
LEGAL STATUS OF PATENTS FILED RELATED TO MICROSPHERES, 2015–2025
FIGURE 25
MAXIMUM PATENTS FILED IN US JURISDICTION, 2015–2025
FIGURE 26
MICROSPHERES MARKET: IMPACT OF AI/GEN AI
FIGURE 27
MICROSPHERES MARKET: DECISION-MAKING FACTORS
FIGURE 28
INFLUENCE OF STAKEHOLDERS ON BUYING PROCESS FOR TOP THREE APPLICATIONS
FIGURE 29
KEY BUYING CRITERIA FOR TOP THREE APPLICATIONS
FIGURE 30
ADOPTION BARRIERS & INTERNAL CHALLENGES
FIGURE 31
POLYMER SEGMENT TO LEAD MICROSPHERES MARKET DURING FORECAST PERIOD
FIGURE 32
HOLLOW SEGMENT TO DOMINATE MICROSPHERES MARKET DURING FORECAST PERIOD
FIGURE 33
MEDICAL TECHNOLOGY TO BE LARGEST APPLICATION OF MICROSPHERES DURING FORECAST PERIOD
FIGURE 34
NORTH AMERICA TO LEAD GLOBAL MICROSPHERES MARKET DURING FORECAST PERIOD
FIGURE 35
NORTH AMERICA: MICROSPHERES MARKET SNAPSHOT
FIGURE 36
EUROPE: MICROSPHERES MARKET SNAPSHOT
FIGURE 37
ASIA PACIFIC: MICROSPHERES MARKET SNAPSHOT
FIGURE 38
MICROSPHERES MARKET SHARE ANALYSIS, 2025
FIGURE 39
MICROSPHERES MARKET: REVENUE ANALYSIS OF KEY PLAYERS, 2023–2025
FIGURE 40
MICROSPHERES MARKET: COMPANY EVALUATION MATRIX (KEY PLAYERS), 2025
FIGURE 41
MICROSPHERES MARKET: COMPANY FOOTPRINT
FIGURE 42
MICROSPHERES MARKET: COMPANY EVALUATION MATRIX (STARTUPS/SMES), 2025
FIGURE 43
MICROSPHERES MARKET: BRAND/PRODUCT COMPARISON
FIGURE 44
MICROSPHERES MARKET: EV/EBITDA OF KEY MANUFACTURERS
FIGURE 45
MICROSPHERES MARKET: ENTERPRISE VALUATION OF KEY PLAYERS
FIGURE 46
3M COMPANY: COMPANY SNAPSHOT
FIGURE 47
THERMO FISHER SCIENTIFIC INC.: COMPANY SNAPSHOT
FIGURE 48
MERCK KGAA: COMPANY SNAPSHOT
FIGURE 49
DIASORIN S.P.A.: COMPANY SNAPSHOT
FIGURE 50
MERIT MEDICAL SYSTEMS, INC.: COMPANY SNAPSHOT
FIGURE 51
TERUMO CORPORATION: COMPANY SNAPSHOT
FIGURE 52
KUREHA CORPORATION: COMPANY SNAPSHOT
FIGURE 53
MICROSPHERES MARKET: RESEARCH DESIGN
FIGURE 54
MARKET SIZE ESTIMATION METHODOLOGY: APPROACH 1 (SUPPLY SIDE) - COLLECTIVE MARKET SHARE OF KEY PLAYERS
FIGURE 55
MARKET SIZE ESTIMATION METHODOLOGY: APPROACH 2 - BOTTOM-UP (SUPPLY SIDE) - COLLECTIVE REVENUE OF ALL PRODUCTS
FIGURE 56
MARKET SIZE ESTIMATION METHODOLOGY: APPROACH 3 - BOTTOM-UP (DEMAND SIDE)
FIGURE 57
MARKET SIZE ESTIMATION METHODOLOGY: APPROACH 4 - TOP-DOWN
FIGURE 58
MARKET CAGR PROJECTIONS FROM SUPPLY SIDE
FIGURE 59
MARKET GROWTH PROJECTIONS FROM DEMAND-SIDE DRIVERS AND OPPORTUNITIES
FIGURE 60
MICROSPHERES MARKET: DATA TRIANGULATION
Methodology
This study involved four major activities in estimating the market size for microspheres. Exhaustive secondary research was done to collect information on the market, the peer market, and the parent market. The next step was to validate these findings, assumptions, and sizing with industry experts across the value chain through primary research. Both top-down and bottom-up approaches were employed to estimate the complete market size. After that, the market breakdown and data triangulation procedures were used to estimate the market size of the segments and subsegments.
Secondary Research
Secondary sources used in this study included annual reports, press releases, and investor presentations of companies; white papers; certified publications; articles from recognized authors; and gold-standard and silver-standard websites, such as Factiva, ICIS, Bloomberg, and others. The findings of this study were verified through primary research, which involved conducting extensive interviews with key officials, including CEOs, VPs, directors, and other executives. The breakdown of profiles of the primary interviewees is illustrated in the figure below:
Primary Research
The microspheres market comprises several stakeholders, such as raw material suppliers, end-product manufacturers, and regulatory organizations in the supply chain. Various primary sources from both the supply and demand sides of the market were interviewed to obtain qualitative and quantitative information.
BREAKDOWN OF PRIMARY PARTICIPANTS
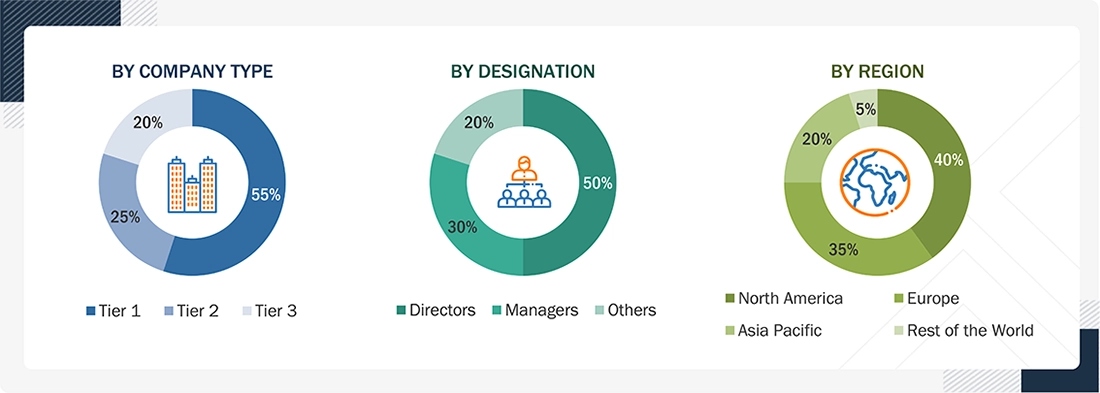
Notes: Tier 1, Tier 2, and Tier 3 companies are classified based on their market revenue in 2023/2024, available in the public domain, product portfolios, and geographical presence. Other designations include consultants and sales, marketing, and procurement managers.
|
COMPANY NAME |
DESIGNATION |
|
3M Company |
Senior Manager |
|
Nouryon |
Innovation Manager |
|
Merck KGaA |
Vice President |
|
Potters Industries LLC |
Production Supervisor |
|
Thermo Fisher Scientific Inc. |
Sales Manager |
To know about the assumptions considered for the study, download the pdf brochure
Market Size Estimation
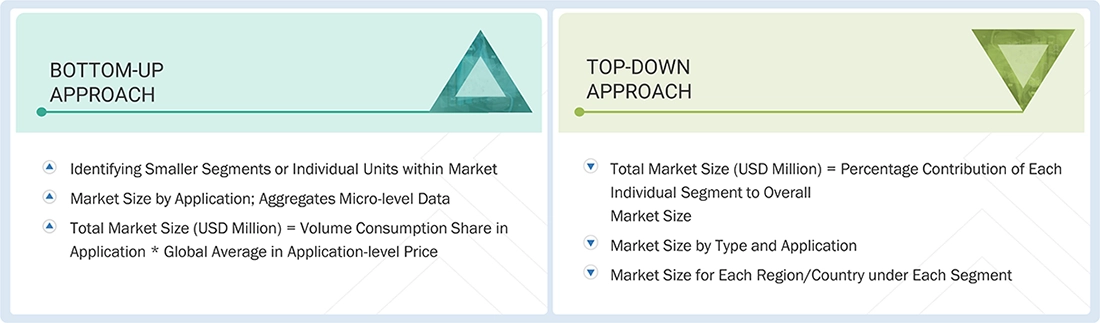
Both top-down and bottom-up approaches were used to estimate and validate the total size of the microspheres market. These methods were also used extensively to estimate the size of various subsegments in the market. The research methodology used to estimate the market size includes the following:
- The key players in the industry were identified through extensive secondary research.
- The supply chain of the industry was determined through primary and secondary research.
- All percentage shares, splits, and breakdowns were determined using secondary sources and verified through primary sources.
- All possible parameters that affect the markets covered in this research study were accounted for, viewed in extensive detail, verified through primary research, and analyzed to obtain the final quantitative and qualitative data.
Microspheres Market: Bottom-up and Top-DownApproach
Data Triangulation
After determining the overall market size using the market size estimation processes explained above, the market was divided into several segments and subsegments. To complete the overall market engineering process and determine the exact statistics for each market segment and subsegment, data triangulation and market breakdown procedures were employed, as applicable. The data was triangulated by studying various factors and trends from both the demand and supply sides in the microspheres industry.
Market Definition
According to the International Journal of Pharmaceutical Research and Applications, microspheres are engineered spherical particles, typically ranging from 1 to 1000 micrometers (µm) in diameter, produced in hollow or solid forms from materials such as polymers, glass, ceramics, fly ash, metals, and other specialty compounds. They are designed with controlled size, structure, and surface properties to function as lightweight fillers, performance enhancers, or carrier systems across diverse applications. They help improve properties such as density, strength, insulation, flow behavior, and controlled delivery performance.
Key Stakeholders
- Microspheres manufacturers
- Microspheres distributors
- Raw material suppliers
- Government and research organizations
- Investment banks and private equity firms
Report Objectives
- To analyze and forecast the size of the microspheres market in terms of value
- To provide detailed information about the major drivers, restraints, challenges, and opportunities influencing the market growth
- To define, describe, and segment the market based on type, raw material, application, and region
- To forecast the size of the market segments based on regions such as Asia Pacific, North America, Europe, Middle East & Africa, and South America.
- To strategically analyze micromarkets with respect to individual growth trends, prospects, and their contribution to the overall market
- To strategically analyze the segmented markets with respect to individual growth trends, prospects, and contributions to the overall market
- To identify and analyze opportunities for stakeholders in the market
- To analyze competitive developments such as expansions, partnerships, joint ventures, mergers & acquisitions, agreements, and product launches in the market
- To strategically profile the key companies and comprehensively analyze their core competencies.
Available customizations:
Using the provided market data, MarketsandMarkets offers customizations tailored to the company’s specific needs. The following customization options are available for the report.
Product analysis
- Product comparative analysis, which gives a detailed comparison of innovative products being offered by prominent vendors
Geographic analysis
- Further breakup of additional European countries by offering, business function, data type, and vertical
- Further breakup of additional Asia Pacific countries by offering, business function, data type, and vertical
- Further breakup of additional Middle East & African countries by offering, business function, data type, and vertical
- Further breakup of additional Latin American countries by offering, business function, data type, and vertical
Company information
- Detailed analysis and profiling of additional market players (up to five)
⚡ Growth Signals
Personalize This Research
- Triangulate with your Own Data
- Get Data as per your Format and Definition
- Gain a Deeper Dive on a Specific Application, Geography, Customer or Competitor
- Any level of Personalization
Let Us Help You
- What are the Known and Unknown Adjacencies Impacting the Microspheres Market
- What will your New Revenue Sources be?
- Who will be your Top Customer; what will make them switch?
- Defend your Market Share or Win Competitors
- Get a Scorecard for Target Partners


We at Nissan Chemicals Corporation have been clients of MarketsandMarkets for more than a year now. We recently consulted MarketsandMarkets for a study, the team at MarketsandMarkets was extremely professional and organized. The business insights were very detailed and aligned well with our expectations that really helped us formulate the Business Plans and device new strategies for development themes. MarketsandMarkets offers a unique combination of expertise and dedicated engagement model. Their research findings have helped us in designing our Pricing Strategy which will make it easier for us to predict the future sales and profits for the next ten years. We look forward to working with MarketsandMarkets in the future.
VP of Strategy & New Business Development
Leading Specialty Chemical Company
The MarketsandMarkets Engagement Model, composed of both the Knowledge Store and advisory custom research, has greatly helped us in understanding our markets and making strategic decisions. The Knowledge Store is a fast way to allow everyone in our organization to understand more about most any market they are interested in. The ability to then get custom research done and get answers to specific strategic questions and market insight has been spectacular. The Markets and Markets team feel more like colleagues than vendors and their services have helped us change our culture where statements of things like growth opportunities and competitive position are always backed by industry research.

Rich Gibson,
Director, Corporate Strategy
Milliken & Company,
Leading Industrial Manufacturer of specialty chemical, floor covering, performance and protective textile materials, and healthcare
MarketsandMarkets is a trusted resource that helps us to better understand markets that are near-adjacencies-whether its technology, value chain or geography. Their Knowledge Store platform provides a dashboard of markets and their characteristics which is easy to use and saves us time.
Adam Shaw,
Market Development and Strategy Manager
AdvanSix Inc. USA,
An American Leader in Chemicals
The Knowledge Store from MarketsandMarkets is a valuable tool which has helped my team acquire greater insight in to the end markets that our business serves. This has enabled us to help our company build stronger strategies throughout our planning process.
TOSHIO KINOSHITA
Senior Chif Consultion Research & Consulting Division
Mitsubishi Chemical Research Corporation,
Leading Manufacturer of Chemical Products

We recently engaged with MarketsandMarkets for a study, the team not only clearly understood our business objectives but was also extremely professional in the way they handled the entire project. The study was efficiently conducted in a phase-wise manner, and the engagement model furnished us with high-quality business insights that far exceeded our expectations at each phase. We were especially happy that MarketsandMarkets could provide us with both, an English as well as a Japanese version of the study. A special thanks to the Analyst Team and Client Services Team, whose fluency in Japanese enhanced our comfort level, as we could converse with them in our preferred language.
Independent entrepreneurs
Arrow Precision
We approached MarketsandMarkets for study on Proppants Market, and their work exceeded our expectations. The study conducted was comprehensive and enabled us to view the market through the various dimensions. In addition, the team was extraordinarily responsive throughout the process and resolved our queries on time. I strongly recommend MarketsandMarkets and will certainly consider them for additional market assessments we will need in the future.
Global engineering company, Japan
Deputy Manager,
Strategic Planning Office
The high-quality insights shared by the MarketsandMarkets team helped us understand the pharmaceutical plant designers in a specific geography. It also captured the risks that we may likely face in communicating with our potential partners. The study would enable us identify partners, which would impact our future growth.

Still Researching the
Microspheres Ecosystem?
See the competitors, opportunities, and growth signals shaping it - instantly.
Generate 15+ consulting-grade strategic insights tailored to your growth question.
Explore Microspheres Intelligence
Powered by 17 years of MarketsandMarkets intelligence
