











- DESCRIPTION
- TABLE OF CONTENTS
- METHODOLOGY
- DOWNLOAD PDF
Exhaust System Market by Component (Sensor, Muffler, Catalytic Converter, Manifold, Tailpipe), Aftertreatment Device (DOC, DPF, LNT, SCR, GPF), Off-highway Equipment, Vehicle Type, Aftermarket, Fuel Type, Sales Channel & Region - Global Forecast to 2033

USD 65.26 BN
MARKET SIZE, 2033



OVERVIEW
Source: Secondary Research, Interviews with Experts, MarketsandMarkets Analysis
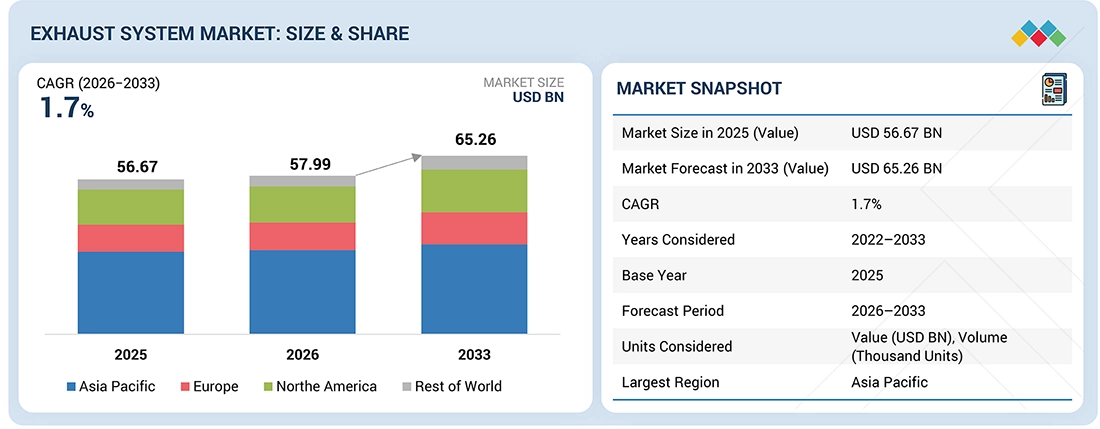
The global exhaust system market size was valued at USD 57.99 billion in 2026 and is expected to reach USD 65.26 billion by 2033, at a CAGR of 1.7% during the forecast period (2026-2033). Asia remains the dominant market for exhaust systems. Market growth is driven by stringent emission norms and increasing vehicle production worldwide. The growing adoption of turbocharged engines requires advanced exhaust flow management, thermal insulation, and backpressure optimization. Rising average vehicle age in several major markets sustains replacement demand for mufflers, tailpipes, catalytic converters, and associated mounting components across on-road applications. Alternatively, integrating complex aftertreatment components within limited vehicle packaging space while maintaining thermal efficiency, durability, and NVH performance is the key challenge for the industry.
KEY TAKEAWAYS
-
EXHAUST SYSTEM MARKET, BY REGION
The Asia Pacific region in terms of value has the largest share of >50% in global exhaust system market in 2026.
-
BY COMPONENT
The sensors segment is projected to record the fastest growth rate of 2.5% over the forecast period, 2026 to 2033.
-
OFF-HIGHWAY EQUIPMENT, BY AFTER-TREATMENT DEVICE
Selective catalytic reduction devices are expected to be the largest and fastest-growing off-highway aftertreatment devices segment, at a CAGR of 8.1% over the forecast period.
-
BY SALES CHANNEL
The exhaust system aftermarket segment is estimated to hold the largest share of >70% in 2026.
-
AFTERMARKET, BY AFTER-TREATMENT DEVICE
The selective catalytic reduction segment is expected to dominate the after-treatment device aftermarket.
-
COMPETITIVE LANDSCAPE - KEY PLAYERS
Major market players have adopted both organic and inorganic strategies, including partnerships and investments. Key players include Tenneco Inc., Forvia, Eberspächer, Freidrich Boysen GmbH & Co KG, and Futaba Industrial Co., Ltd.
-
COMPETITIVE LANDSCAPE - STARTUPS
Bosal and Katcon Global have distinguished themselves among emerging players by securing strong footholds in specialized areas.
The exhaust system market is growing steadily as manufacturers focus on cleaner combustion, fuel efficiency, and stricter emissions control across various vehicle types. OEMs are increasingly integrating advanced aftertreatment systems and compact exhaust architectures to improve thermal efficiency and reduce emissions, while suppliers are expanding localized production to support rising vehicle output and platform standardization. The accelerating shift toward battery electric vehicles, which is reducing long-term demand for conventional exhaust systems, is forcing suppliers to diversify their product portfolios toward thermal management, lightweighting, and adjacent EV components.
TRENDS & DISRUPTIONS IMPACTING CUSTOMERS' CUSTOMERS
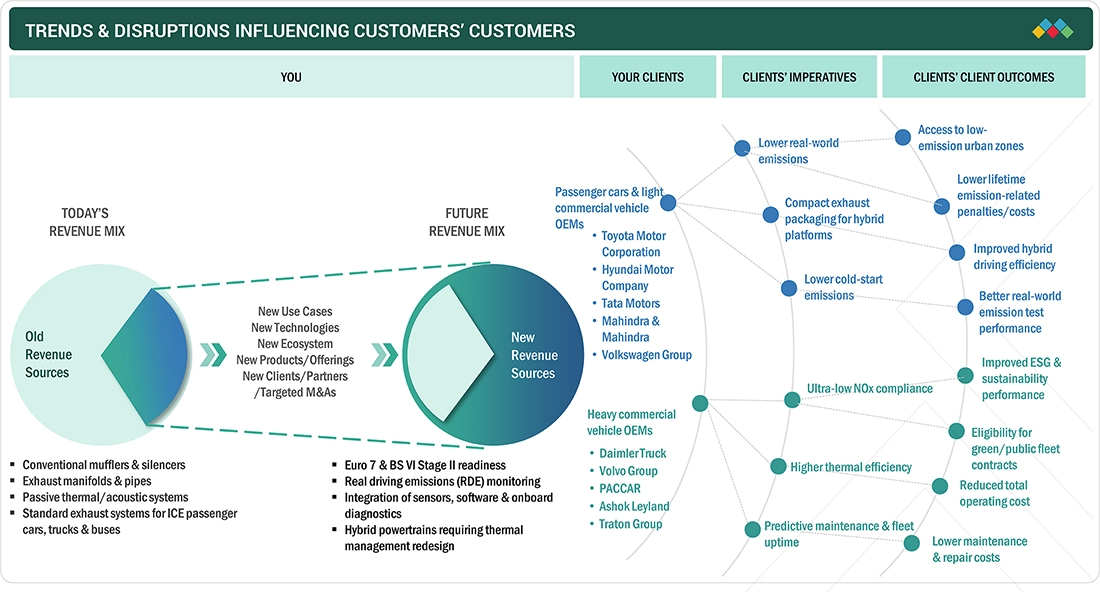
The exhaust system market is undergoing a transformation as global OEMs face tightening emissions regulations, rapid hybridization, rising fleet efficiency expectations, and growing adoption of connected vehicle technologies. Across passenger cars, commercial vehicles, and off-highway equipment, customers are shifting from conventional exhaust components to advanced aftertreatment, smart diagnostics, lightweight architectures, and low-emission thermal management systems. These trends are reshaping OEM priorities and creating new revenue opportunities for exhaust system suppliers through compliance-driven innovation, predictive maintenance capabilities, and next-generation emission-control technologies.
Source: Secondary Research, Interviews with Experts, MarketsandMarkets Analysis
MARKET DYNAMICS

-
Transition toward EVs to reduce demand for exhaust systems


OPPORTUNITIES
Impact
Level
-
Growing integration of adaptive exhaust systems in premium vehicles

-
Development of heat-resistant materials for downsized turbo engines

Source: Secondary Research, Interviews with Experts, MarketsandMarkets Analysis
Vehicle architectures require exhaust components with higher thermal efficiency, tighter packaging, and improved durability than conventional naturally aspirated systems. Turbocharged engines rely on exhaust gas energy to drive the turbine, making exhaust manifolds, downpipes, catalytic converter housings, and mufflers critical to engine responsiveness and emissions performance. To maximize turbo efficiency, manufacturers increasingly adopt integrated exhaust manifolds, thin-wall stainless-steel downpipes, and thermally insulated routing systems that minimize heat loss and maintain high exhaust gas velocity. This trend is accelerating as automakers deploy downsized turbocharged engines to meet stringent fleet CO2 and fuel efficiency regulations, including the European Union CO2 emission reduction framework for passenger vehicles, India’s Corporate Average Fuel Efficiency standards, and US EPA greenhouse gas rules. Hybrid powertrain integration creates an additional growth opportunity by imposing unique thermal and structural demands on exhaust systems. In hybrid vehicles, repeated engine shutdown and restart cycles cause frequent temperature fluctuations across manifolds, catalytic converter shells, mufflers, and hangers, increasing the risk of thermal fatigue, weld stress, and substrate degradation. To address these challenges, manufacturers are developing low-thermal-mass manifolds for faster heat buildup, close-coupled converter packaging for rapid catalyst activation, and flexible hanger systems capable of absorbing repeated thermal expansion.
The transition to electric vehicles is a major headwind for the exhaust system market, as battery electric vehicles eliminate the need for core exhaust components such as manifolds, catalytic converter housings, downpipes, mufflers, tailpipes, and hangers. Unlike combustion-based vehicles, EVs do not generate exhaust gases and therefore do not require emission control or gas routing systems. As automakers increasingly shift to dedicated electric platforms, exhaust system integration is being removed entirely from vehicle architecture, reducing OEM demand for exhaust components. Several global OEMs, including Volvo, Mercedes-Benz, and General Motors, have announced timelines to significantly reduce or phase out pure ICE vehicle development, directly impacting future exhaust component volumes. BEVs such as the Tesla Model Y and Hyundai IONIQ 5 completely eliminate traditional exhaust assemblies, removing demand for catalytic converters, silencers, and tailpipe systems. Major suppliers, including Tenneco and FORVIA, are increasingly investing in EV thermal management and lightweight technologies as long-term exhaust demand growth slows in developed markets.
Integration of adaptive exhaust systems in premium vehicles is increasing demand for technologically advanced, higher-value exhaust components beyond conventional fixed-flow assemblies. Adaptive exhaust systems use electronically controlled valves, bypass channels, integrated actuators, position sensors, and dual-path muffler architectures to dynamically alter exhaust gas routing based on drive mode selection, engine load, and vehicle speed. This creates a major opportunity for component manufacturers because every adaptive exhaust-equipped vehicle requires additional high-precision hardware, more complex internal chamber designs, advanced thermal protection for electronic elements, and tighter calibration between exhaust flow management and vehicle control systems. Compared with traditional passive exhaust assemblies, adaptive systems significantly increase bill-of-material value and engineering content per vehicle, enabling suppliers to move toward higher-margin component portfolios focused on intelligent exhaust functionality. Adaptive exhaust systems support one of the premium vehicle segment’s key product differentiators, a configurable driving experience. Premium buyers expect vehicles to switch seamlessly between refined, low-noise cruising and performance-oriented exhaust character. Adaptive systems enable this by altering gas flow paths in real time.
Automotive manufacturers operate in a global market but must comply with emission standards that differ by country and region. This lack of uniformity not only complicates the design and manufacturing of exhaust systems but also increases compliance costs. Engineers and designers must develop exhaust systems that meet the most stringent regulations worldwide, resulting in complex, often region-specific designs to ensure compliance. Moreover, the absence of standardized regulations makes it difficult for manufacturers to achieve economies of scale in production, as they may need to tailor exhaust systems for different markets, further driving up costs and complicating supply chains. Furthermore, the lack of standardization in emission regulations hampers innovation and technological advancements in automotive exhaust systems. Manufacturers face challenges in investing in R&D for new exhaust system technologies when regulatory requirements vary significantly between regions. This fragmentation in regulations restricts innovation as manufacturers focus on meeting existing standards rather than developing groundbreaking solutions for emissions reduction. Ultimately, achieving global standardization in emission regulations would streamline the design and manufacturing process for automotive exhaust systems, encourage innovation, and drive down costs, benefiting both manufacturers and consumers alike. However, until such standardization is realized, the automotive industry will continue to struggle with the challenges posed by disparate emission regulations across different regions.
EXHAUST SYSTEM MARKET SIZE, SHARE & ANALYSIS: COMMERCIAL USE CASES ACROSS INDUSTRIES
| COMPANY | USE CASE DESCRIPTION | BENEFITS |
|---|---|---|
|
|
Supplies close-coupled catalytic converters and integrated NOx sensor modules for turbocharged gasoline passenger cars and hybrid SUVs. The systems are positioned closer to the engine manifold to achieve faster catalyst activation during urban stop-start driving cycles. | Improves cold start emission control, reduces catalyst warm up time, supports compact engine structure |
|
|
Develops lightweight stainless steel mufflers and tailpipe systems for premium passenger vehicles where OEMs seek lower NVH levels without increasing vehicle weight | Reduces cabin resonance, improves acoustic tuning |
|
|
Provides SCR catalytic converters, particulate sensors, and heavy-duty exhaust manifolds for long haul diesel trucks | Enhances NOx conversion efficiency under variable load conditions, improves onboard diagnostics accuracy |
|
|
Provides thin wall stainless steel exhaust manifolds and performance downpipes for premium passenger cars equipped with high output turbocharged engines | Improves turbocharger response, lowers thermal losses between engine and catalyst |
|
|
Produces exhaust manifolds, mufflers, and catalytic converter housings for mass market hybrid passenger vehicles in Asia. The systems are optimized for compact transverse engine layouts. | Improves manufacturability for high volume OEM production, reduces vibration transfer to the cabin |


Logos and trademarks shown above are the property of their respective owners. Their use here is for informational and illustrative purposes only.
MARKET ECOSYSTEM
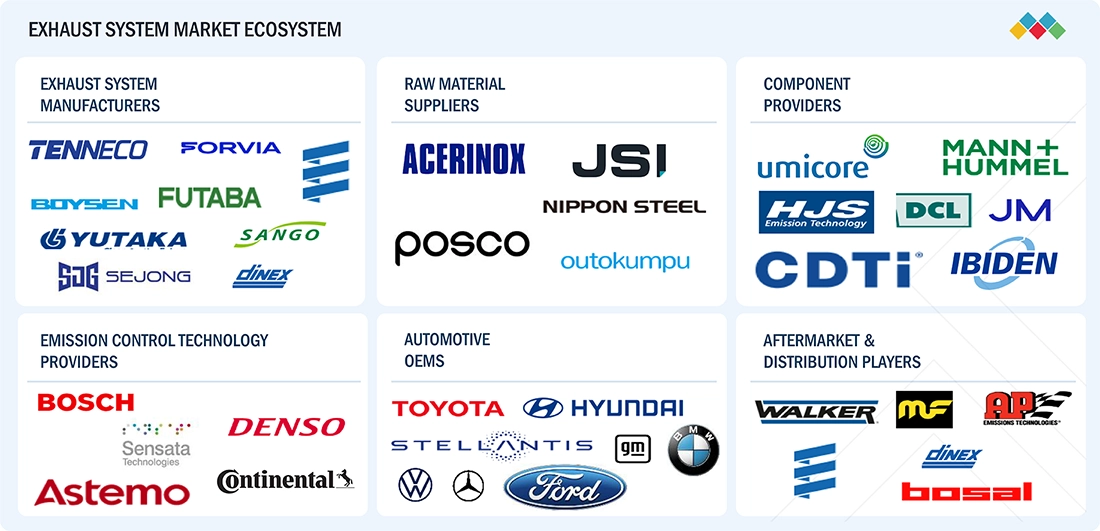
The exhaust system market ecosystem comprises stakeholders such as exhaust system manufacturers, raw material and component suppliers, automotive OEMs, emission control technology providers, and distributors. Market performance is shaped by close collaboration among these stakeholders to meet evolving emissions regulations, vehicle platform requirements, durability standards, and cost-optimization targets. The ecosystem is influenced by advances in aftertreatment technologies, materials engineering, and powertrain diversification, making supplier specialization and OEM integration critical to competitive positioning across global markets.
Logos and trademarks shown above are the property of their respective owners. Their use here is for informational and illustrative purposes only.
MARKET SEGMENTS
Source: Secondary Research, Interviews with Experts, MarketsandMarkets Analysis
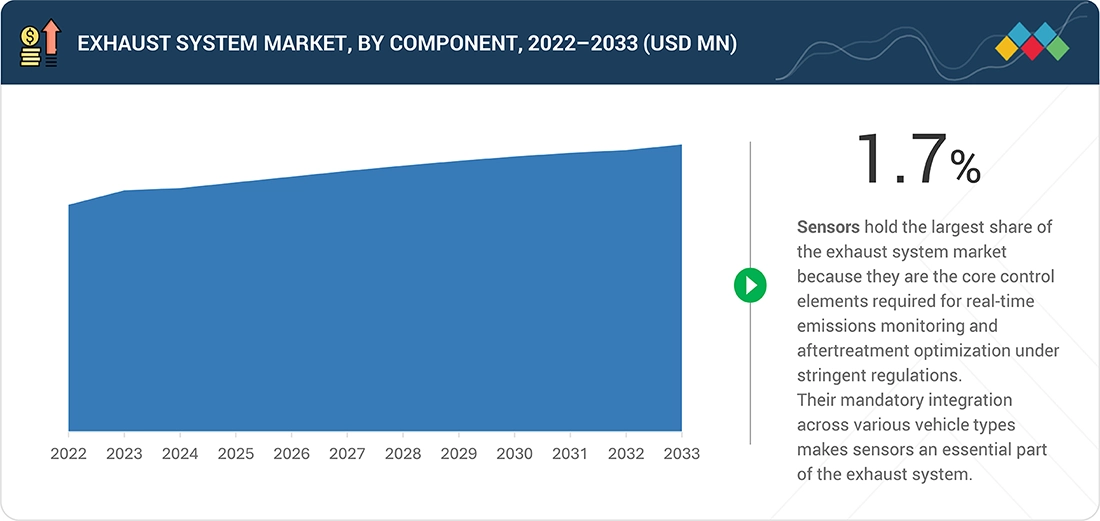
Sensors hold the largest market share by value and are the fastest-growing segment in the exhaust system market, driven by their role as core control elements required for real-time emissions monitoring and aftertreatment optimization under stringent regulations. Their mandatory integration across various vehicle types, combined with higher replacement demand and greater unit value, makes sensors an essential part of the exhaust system.
The SCR segment is the largest and fastest-growing in the exhaust system market, driven by its preference as an aftertreatment solution for higher-horsepower construction, mining, and agricultural equipment, where maintaining engine power, fuel efficiency, and long operating hours is critical. SCR enables efficient NOx reduction while allowing engines to operate at higher combustion temperatures, which supports better fuel economy in heavy-load applications.
Aftermarket holds the largest share in the exhaust system market because exhaust systems and their subcomponents require repeated replacement throughout the vehicle life cycle, whereas OE demand is limited to a one-time fitment during vehicle production. Components are exposed to continuous thermal cycling, moisture, and road-borne contaminants, leading to progressive wear and functional degradation that requires periodic servicing through dealership networks and independent workshops.
The SCR segment is the fastest-growing after-treatment device in the exhaust system market because it is the most widely deployed NOx control system in modern diesel passenger and, especially, commercial vehicle platforms. Aftermarket demand is driven by multiple service-prone components within the system, including dosing injectors, pumps, control units, and NOx sensors, all of which are separately replaceable. Compared with DOC and DPF, SCR systems generate higher replacement intensity due to both component complexity and operational dependence on precise dosing performance.
REGION
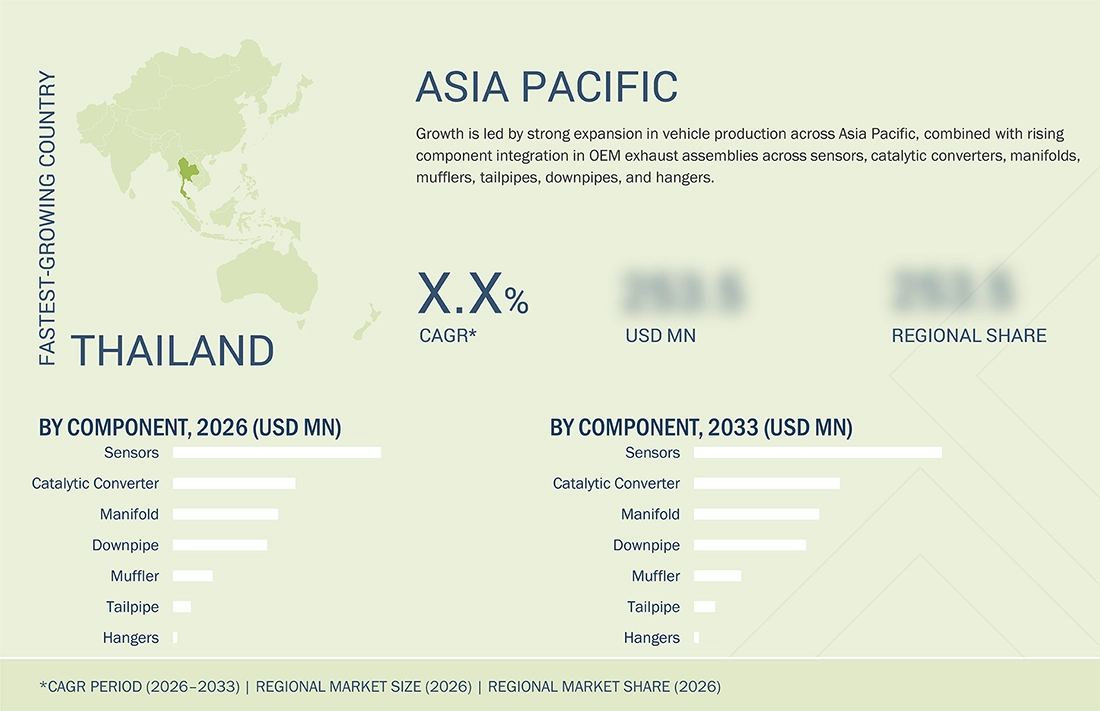
Asia is the largest region in global exhaust system market in 2026
Asia Pacific holds the largest market due to its scale of vehicle manufacturing and its strong concentration of component production for manifolds, mufflers, tailpipes, downpipes, hangers, and exhaust sensing systems. The region accounts for the highest global vehicle production volumes, led by China, Japan, and India. China and India also host large manufacturing clusters for fabricated metal exhaust parts and precision sensor assemblies.
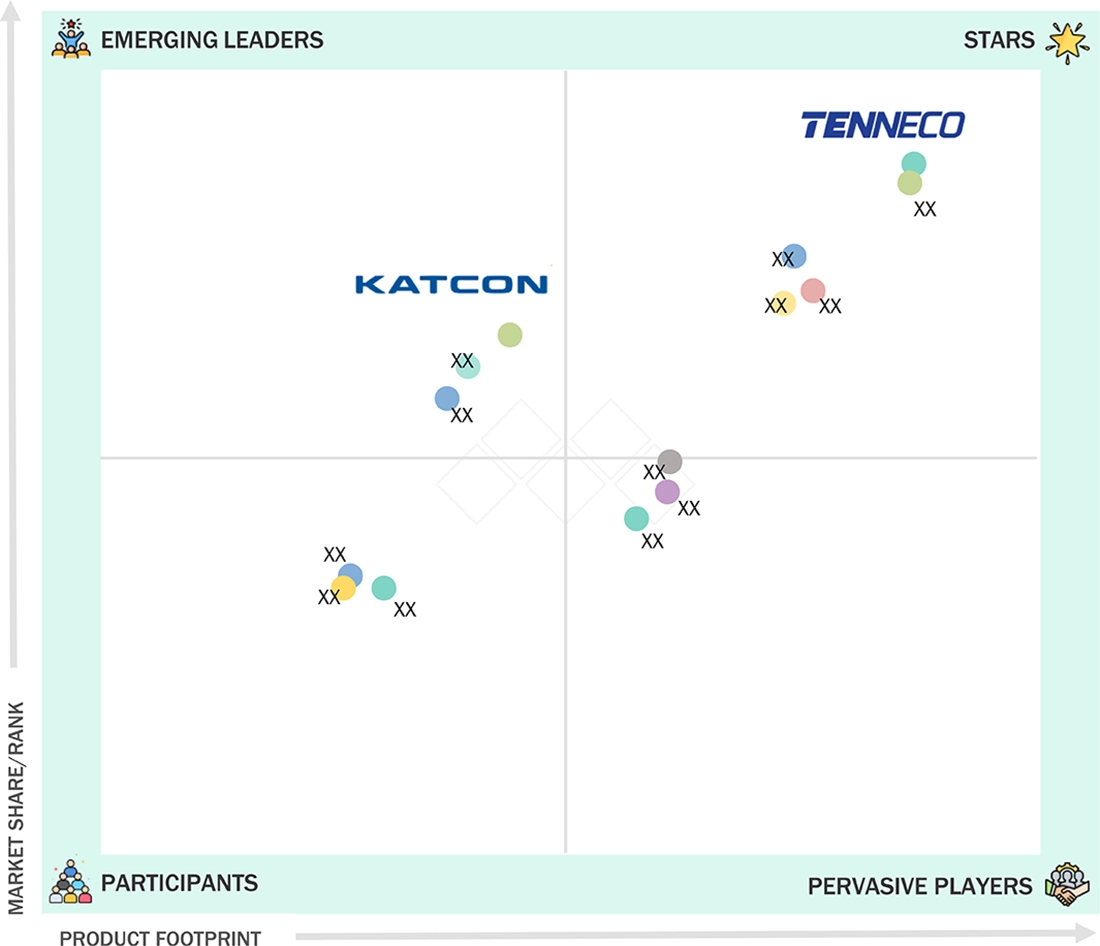
EXHAUST SYSTEM MARKET SIZE, SHARE & ANALYSIS: COMPANY EVALUATION MATRIX
In the exhaust system market matrix, Tenneco (Star) leads with a strong global manufacturing footprint and a broad exhaust product portfolio, supported by advanced emission control technologies, OEM partnerships, and integrated thermal management capabilities across passenger and commercial vehicle platforms. Katcon Global (Emerging Leader) is gaining traction through its focus on lightweight exhaust architectures, close-coupled aftertreatment systems, and regional expansion strategies aligned with evolving emission standards and hybrid vehicle requirements. While Tenneco benefits from scale, diversified product integration, and long-standing OEM relationships, Katcon shows strong potential to strengthen its market position as demand rises for compact, high-efficiency, and next-generation emission control solutions.
Source: Secondary Research, Interviews with Experts, MarketsandMarkets Analysis
MARKET SCOPE
| REPORT METRIC | DETAILS |
|---|---|
| Market Size in 2026 (Value) | USD 57.99 Billion |
| Market Forecast in 2033 (Value) | USD 65.26 Billion |
| Growth Rate | CAGR of 1.7% from 2026-2033 |
| Years Considered | 2022-2033 |
| Base Year | 2025 |
| Forecast Period | 2026-2033 |
| Units Considered | Value (USD Million/Billion), Volume (Thousand Units) |
| Report Coverage | Revenue forecast, company ranking, competitive landscape, growth factors, and trends |
| Segments Covered |
|
| Regions Covered | Asia Pacific, Europe, North America, and Rest of the World |
WHAT IS IN IT FOR YOU: EXHAUST SYSTEM MARKET SIZE, SHARE & ANALYSIS REPORT CONTENT GUIDE
DELIVERED CUSTOMIZATIONS
We have successfully delivered the following deep-dive customizations:
| CLIENT REQUEST | CUSTOMIZATION DELIVERED | VALUE ADDS |
|---|---|---|
| Global Exhaust System OEM | Conducted competitive benchmarking of Forvia, Tenneco, Eberspächer, Friedrich Boysen, and Futaba Industrial, with detailed analysis of catalytic converters, mufflers, diesel particulate filters, SCR systems, and exhaust manifolds across passenger and commercial vehicles | Helps identify technology gaps in advanced aftertreatment systems and supports long-term product portfolio expansion strategies |
| Commercial Vehicle Manufacturer | Evaluated exhaust system demand across heavy duty trucks and buses, including analysis of NOx reduction technologies, thermal management systems, and high durability exhaust architectures for long haul applications | Enables better compliance planning for upcoming emission norms and improved sourcing strategy for heavy duty exhaust platforms |
| Passenger Vehicle OEM | Assessed lightweight exhaust system materials and modular architectures for hybrid passenger cars, including benchmarking of integrated muffler and manifold designs | Supports vehicle lightweighting goals, reduced packaging complexity, and improved fuel efficiency and NVH performance |
| Tier 1 Component Supplier | Developed demand forecasts for sensors, mufflers, downpipes, tailpipes, and catalytic converters across passenger cars, LCVs, and trucks, along with localization analysis of manufacturing capabilities | Identifies high growth component opportunities and supported expansion into cost competitive export supply chains |
| Aftermarket Distributor | Analyzed replacement trends for catalytic converters, mufflers, and exhaust pipes in the European aftermarket, including benchmarking of premium and value segment suppliers | Improves inventory planning for high replacement rate components and strengthened positioning in the aftermarket exhaust segment |
RECENT DEVELOPMENTS
- May 2026 : Purem by Eberspächer and RWTH Aachen University developed the De-Hydrator, an exhaust system component that cools the fuel cell’s exhaust air via a heat exchanger. This helps prevent obstructed visibility in road traffic and increases the practical suitability of fuel cell trucks.
- December 2025 : Tenneco introduced 118 CARB-compliant catalytic converters under its Walker CalCat product line, expanding coverage for more than 9 million high-demand vehicles. This portfolio expansion strengthens the company’s aftermarket exhaust and emissions control offerings, enhances its ability to meet stringent regulatory requirements, and broadens product availability across key automotive applications.
- February 2025 : Purem by Eberspächer partnered with AMBARtec ag. with a common goal of efficient transport and safe storage of hydrogen. AMBARtec intends to develop a process for transporting and storing hydrogen onto the market; the partnership aims to drive forward the scaling of this process.
Table of Contents
 Exclusive indicates content/data unique to MarketsandMarkets and not available with any competitors.
4
MARKET OVERVIEW
47
4.2.1.1
GROWING USE OF TURBOCHARGED AND HYBRID POWERTRAINS
4.2.1.2
INCREASING DEMAND FOR REFINED VEHICLE ACOUSTICS
4.2.2.1
TRANSITION TOWARD EVS
4.2.3.1
INTEGRATION OF ADAPTIVE EXHAUST SYSTEMS IN PREMIUM VEHICLES
4.2.3.2
DEVELOPMENT OF HEAT-RESISTANT MATERIALS FOR DOWNSIZED TURBO ENGINES
4.2.4.1
LACK OF UNIFORMITY IN GLOBAL EMISSIONS REGULATIONS
4.2.4.2
COMPLEX EXHAUST SYSTEM DESIGNS FOR COMPACT VEHICLE PLATFORMS
4.3
UNMET NEEDS AND WHITE SPACES
4.4
INTERCONNECTED MARKETS AND CROSS-SECTOR OPPORTUNITIES
4.5
STRATEGIC MOVES BY TIER-1/2/3 PLAYERS
4.6
STRATEGIC MOVES BY OEMS ON POWERTRAIN ALIGNMENT
5
INDUSTRY TRENDS
64
5.1
MACROECONOMIC INDICATORS
5.1.1
GDP TRENDS AND FORECAST
5.1.2
TRENDS IN GLOBAL AUTOMOTIVE AND TRANSPORTATION INDUSTRY
5.2.1
RAW MATERIAL SUPPLIERS
5.2.2
COMPONENT PROVIDERS
5.2.3
EMISSION CONTROL TECHNOLOGY PROVIDERS
5.2.4
EXHAUST SYSTEM MANUFACTURERS
5.2.6
AFTERMARKET AND DISTRIBUTION PLAYERS
5.3
SUPPLY CHAIN ANALYSIS
5.4.1
AVERAGE SELLING PRICE, BY COMPONENT, 2025
5.4.2
AVERAGE SELLING PRICE, BY REGION, 2025
5.5
TRENDS/DISRUPTIONS IMPACTING CUSTOMER BUSINESS
5.6
KEY CONFERENCES AND EVENTS, 2026–2027
5.7.1
IMPORT SCENARIO (HS CODE 870892)
5.7.2
EXPORT SCENARIO (HS CODE 870892)
5.8.1
TENNECO INTRODUCES ADVANCED MUFFLER TECHNOLOGY FOR NOISE REDUCTION
5.8.2
FORVIA EXPANDS COMPACT EXHAUST MANIFOLD SOLUTIONS FOR HYBRID VEHICLES
5.8.3
EBERSPÄCHER DEVELOPS LIGHTWEIGHT EXHAUST SYSTEMS FOR PASSENGER CARS
5.8.4
FUTABA INDUSTRIAL ENHANCES EXHAUST PIPE DURABILITY FOR HEAVY COMMERCIAL VEHICLES
5.8.5
BOSAL IMPROVES MODULAR EXHAUST COMPONENT ARCHITECTURE FOR OFF-HIGHWAY EQUIPMENT
5.9
IMPACT OF EU–INDIA FTA TRADE DEAL ON AUTOMOTIVE AND TRANSPORTATION INDUSTRY
5.9.1
IMPACT ON EXHAUST SYSTEM MARKET
5.10
IMPACT OF ISRAEL–IRAN CONFLICT ON AUTOMOTIVE AND TRANSPORTATION INDUSTRY
5.10.1
IMPACT ON EXHAUST SYSTEM MARKET
6
TECHNOLOGICAL ADVANCEMENTS, PATENTS, INNOVATIONS, AND FUTURE APPLICATIONS
82
6.1.1
ADVANCED EXHAUST MATERIALS
6.1.2
HYDROFORMED EXHAUST TUBE MANUFACTURING
6.2
COMPLEMENTARY TECHNOLOGIES
6.2.1
THERMAL SHIELDING AND INSULATION MATERIALS
6.2.2
FLEXIBLE COUPLING AND VIBRATION CONTROL SYSTEMS
6.3
ADJACENT TECHNOLOGIES
6.3.1
HYBRID EXHAUST THERMAL MANAGEMENT
6.3.2
COMPACT EXHAUST SYSTEM INTEGRATION
6.4
TECHNOLOGY/PRODUCT ROADMAP
6.7.1
POWER OUTPUT VS. ESTIMATED EXHAUST TEMPERATURE
6.7.2
HYBRIDIZATION LEVEL VS. CATALYST WARM-UP TIME
6.7.3
OEM VS. HEAT SHIELD COVERAGE
6.7.4
SUPPLIER-LEVEL EXHAUST CAPABILITY BENCHMARKING
7
REGULATORY LANDSCAPE
97
7.1
REGIONAL REGULATIONS AND COMPLIANCE
7.1.1
REGULATORY BODIES, GOVERNMENT AGENCIES, AND OTHER ORGANIZATIONS
7.2
GLOBAL ON-ROAD VEHICLE EMISSIONS STANDARDS
8
CUSTOMER LANDSCAPE AND BUYER BEHAVIOR
104
8.1
DECISION-MAKING PROCESS
8.2
KEY STAKEHOLDERS IN BUYING PROCESS AND THEIR EVALUATION CRITERIA
8.2.1
KEY STAKEHOLDERS IN BUYING PROCESS
8.3
ADOPTION BARRIERS AND INTERNAL CHALLENGES
8.4
UNMET NEEDS OF VARIOUS END-USE INDUSTRIES
8.5.3
MARGIN OPPORTUNITIES
9
EXHAUST SYSTEM OE MARKET, BY COMPONENT
109
9.2.1.1
RISING INSTALLATION OF SCR AFTERTREATMENT DEVICES TO DRIVE MARKET
9.2.2.1
REAL-TIME ENGINE CONTROL AND EMISSIONS REDUCTION TO DRIVE MARKET
9.2.3
TEMPERATURE SENSORS
9.2.3.1
NEED FOR EFFECTIVE TEMPERATURE MANAGEMENT TO DRIVE MARKET
9.2.4.1
GROWING INTEGRATION OF PARTICULATE FILTRATION SYSTEMS TO DRIVE MARKET
9.3.1
ESCALATING ADOPTION OF TURBOCHARGED AND GASOLINE DIRECT INJECTION POWERTRAINS TO DRIVE MARKET
9.4.1
INCREASING VEHICLE PLATFORM MODULARIZATION TO DRIVE MARKET
9.5.1
RISE OF INTEGRATED EXHAUST MANIFOLD DESIGNS TO DRIVE MARKET
9.6.1
WIDE ACCEPTANCE OF AFTERTREATMENT DEVICES TO DRIVE MARKET
9.7.1
FOCUS ON IMPROVED ENGINE ACOUSTICS AND PERFORMANCE TO DRIVE MARKET
9.8.1
IMPLEMENTATION OF ADVANCED EXHAUST SYSTEMS TO DRIVE DEMAND
10
EXHAUST SYSTEM OE MARKET, BY FUEL TYPE
130
10.2.1
CONSUMER PREFERENCE FOR VEHICLES WITH IMPROVED FUEL ECONOMY TO DRIVE MARKET
10.3.1
IMPROVEMENTS IN EXHAUST SYSTEM EFFICIENCY TO DRIVE MARKET
11
EXHAUST SYSTEM OE MARKET, BY VEHICLE TYPE
137
11.2.1
RISING PRODUCTION AND SALES VOLUME TO DRIVE MARKET
11.3
LIGHT COMMERCIAL VEHICLES
11.3.1
CONTINUED EXPANSION OF URBAN DELIVERY FLEETS TO DRIVE MARKET
11.4.1
RAPID ADOPTION IN COMMERCIAL TRANSPORTATION TO DRIVE MARKET
11.5.1
INCREASING DEMAND FOR PUBLIC TRANSPORT TO DRIVE MARKET
12
EXHAUST SYSTEM MARKET, BY SALES CHANNEL
148
12.2.1
INCREASED VEHICLE OWNERSHIP AND TECHNOLOGICAL IMPROVEMENTS TO DRIVE MARKET
12.3.1
RISE IN GLOBAL VEHICLE PRODUCTION TO DRIVE MARKET
13
EXHAUST SYSTEM OE MARKET, BY AFTERTREATMENT DEVICE
155
13.2
DIESEL OXIDATION CATALYST (DOC)
13.2.1
RISING PRODUCTION OF DIESEL-POWERED COMMERCIAL VEHICLES TO DRIVE MARKET
13.3
DIESEL PARTICULATE FILTER (DPF)
13.3.1
INTEGRATION OF HIGH-CAPACITY SOOT FILTRATION SYSTEMS IN HEAVY-DUTY DIESEL PLATFORMS TO DRIVE MARKET
13.4.1
EXTENSIVE USE OF COMPACT DIESEL POWERTRAINS IN LIGHT COMMERCIAL VEHICLES TO DRIVE MARKET
13.5
SELECTIVE CATALYTIC REDUCTION (SCR)
13.5.1
GROWING PRODUCTION OF INDUSTRIAL VEHICLES TO DRIVE MARKET
13.6
GASOLINE PARTICULATE FILTER (GPF)
13.6.1
REGULATORY PUSH FOR GASOLINE VEHICLES TO REDUCE EMISSIONS TO DRIVE MARKET
14
EXHAUST SYSTEM AFTERMARKET, BY AFTERTREATMENT DEVICE
168
14.2
DIESEL OXIDATION CATALYST (DOC)
14.2.1
AGING DIESEL VEHICLE PARC TO DRIVE AFTERMARKET
14.3
DIESEL PARTICULATE FILTER (DPF)
14.3.1
CLOGGING AND ASH BUILDUP TO DRIVE AFTERMARKET
14.4
SELECTIVE CATALYTIC REDUCTION (SCR)
14.4.1
HIGH DUTY CYCLE DIESEL OPERATIONS TO DRIVE AFTERMARKET
15
OFF-HIGHWAY VEHICLE EXHAUST SYSTEM OE MARKET, BY AFTERTREATMENT DEVICE
177
15.2
DIESEL PARTICULATE FILTER (DPF)
15.2.1
HIGH SOOT ACCUMULATION IN OFF-HIGHWAY OPERATIONS TO DRIVE MARKET
15.3
DIESEL OXIDATION CATALYST (DOC)
15.3.1
INCREASING USE OF DOC-INTEGRATED EXHAUST MODULES TO DRIVE MARKET
15.4
SELECTIVE CATALYTIC REDUCTION (SCR)
15.4.1
RISING ADOPTION OF HIGH-HORSEPOWER OFF-HIGHWAY EQUIPMENT TO DRIVE MARKET
16
OFF-HIGHWAY VEHICLE EXHAUST SYSTEM OE MARKET, BY EQUIPMENT TYPE
186
16.2
AGRICULTURAL TRACTORS
16.2.1
GROWING FARM MECHANIZATION AND REPLACEMENT DEMAND IN AGRICULTURAL OPERATIONS TO DRIVE MARKET
16.3
CONSTRUCTION EQUIPMENT
16.3.1
INFRASTRUCTURE DEVELOPMENT AND PUBLIC CONSTRUCTION INVESTMENT CYCLES TO DRIVE MARKET
16.4.1
RISING DEMAND FOR MINERALS AND METALS ACROSS VARIOUS INDUSTRIES TO DRIVE MARKET
17
EXHAUST SYSTEM MARKET, BY REGION
195
17.2.1.1
RISING VEHICLE PRODUCTION TO DRIVE MARKET
17.2.2.1
CONTINUOUS PASSENGER AND COMMERCIAL VEHICLE PRODUCTION EXPANSION TO DRIVE MARKET
17.2.3.1
SURGE IN HYBRID PASSENGER CAR PRODUCTION TO DRIVE MARKET
17.2.4.1
GROWING VEHICLE REPLACEMENT AND MAINTENANCE DEMAND TO DRIVE MARKET
17.2.5.1
SHIFT TOWARD INTEGRATED MANUFACTURING TO DRIVE MARKET
17.2.6
REST OF ASIA PACIFIC
17.3.1.1
INCREASED DEMAND FOR PREMIUM CARS TO DRIVE MARKET
17.3.2.1
INDUSTRIAL SUPPLIER BASE SUPPORTING EXHAUST COMPONENT MANUFACTURING TO DRIVE DEMAND
17.3.3.1
EXTENSIVE USE OF LIGHT COMMERCIAL VEHICLES AND URBAN PASSENGER CARS IN DENSE DELIVERY ROUTES TO DRIVE MARKET
17.3.4.1
HEIGHTENED PRODUCTION OF PASSENGER CARS TO DRIVE MARKET
17.3.5.1
EXPANDING DOMESTIC AUTOMOTIVE SUPPLIER INTEGRATION TO DRIVE MARKET
17.3.6.1
INCREASING RELIANCE ON COMMERCIAL TRANSPORT MAINTENANCE TO DRIVE MARKET
17.4.1.1
ADVANCEMENTS IN EXHAUST SYSTEM COMPONENTS AND HIGH DUTY CYCLE USAGE TO DRIVE MARKET
17.4.2.1
ROLE AS EXPORT PRODUCTION BASE TO DRIVE MARKET
17.4.3.1
HIGHER EXHAUST COMPONENT REPLACEMENT DEMAND AMID HARSH OPERATING ENVIRONMENT TO DRIVE MARKET
17.5.1.1
ETHANOL FUEL MIX AND HIGH-DUTY VEHICLE USAGE TO DRIVE MARKET
17.5.2.1
RISE OF EXPORT-ORIENTED OPERATIONS TO DRIVE MARKET
18
COMPETITIVE LANDSCAPE
245
18.2
KEY PLAYER STRATEGIES/RIGHT TO WIN, 2022–2026
18.3
MARKET SHARE ANALYSIS, 2025
18.4
REVENUE ANALYSIS, 2021–2025
18.5
COMPANY VALUATION AND FINANCIAL METRICS
18.6
BRAND/PRODUCT COMPARISON
18.7
COMPANY EVALUATION MATRIX: EXHAUST SYSTEM COMPONENT PROVIDERS, 2025
18.7.5.1
COMPANY FOOTPRINT
18.7.5.2
REGION FOOTPRINT
18.7.5.3
VEHICLE TYPE FOOTPRINT
18.7.5.4
FUEL TYPE FOOTPRINT
18.8
COMPANY EVALUATION MATRIX: OFF-HIGHWAY VEHICLE EXHAUST SYSTEM SUPPLIERS, 2025
18.8.1
PROGRESSIVE COMPANIES
18.8.2
RESPONSIVE COMPANIES
18.8.5.1
COMPANY FOOTPRINT
18.8.5.2
REGION FOOTPRINT
18.8.5.3
EQUIPMENT TYPE FOOTPRINT
18.8.5.4
FUEL TYPE FOOTPRINT
18.9
COMPETITIVE SCENARIO
19
COMPANY PROFILES
264
19.1.1.1
BUSINESS OVERVIEW
19.1.1.2
PRODUCTS OFFERED
19.1.1.3
RECENT DEVELOPMENTS
19.1.1.3.1
PRODUCT LAUNCHES/DEVELOPMENTS
19.1.1.4.2
STRATEGIC CHOICES
19.1.1.4.3
WEAKNESSES AND COMPETITIVE THREATS
19.1.4
FUTABA INDUSTRIAL CO., LTD.
19.1.5
FRIEDRICH BOYSEN GMBH & CO. KG
19.1.7
YUTAKA GIKEN COMPANY LIMITED
19.1.8
SEJONG INDUSTRIAL CO., LTD.
19.2.1
MARELLI HOLDINGS CO., LTD.
19.2.2
HIROTEC CORPORATION
19.2.3
BENTELER INTERNATIONAL AG
19.2.9
GRAND ROCK CO., INC.
19.2.10
EUROPEAN EXHAUST AND CATALYST LTD.
19.2.11
CREFACT CORPORATION
19.2.12
SHARDA MOTOR INDUSTRIES
19.2.13
EISENMANN EXHAUST SYSTEMS
19.2.15
HARBIN AIRUI EMISSIONS CONTROL TECHNOLOGY CO., LTD.
19.2.16
CHONGQING HITER AUTOMOBILE EXHAUST SYSTEM CO., LTD.
20
RESEARCH METHODOLOGY
306
20.1.1.1
LIST OF SECONDARY SOURCES
20.1.1.2
KEY DATA FROM SECONDARY SOURCES
20.1.2.1
LIST OF PRIMARY PARTICIPANTS
20.1.2.2
BREAKDOWN OF PRIMARY INTERVIEWS
20.1.3
SAMPLING TECHNIQUES AND DATA COLLECTION METHODS
20.2
MARKET SIZE ESTIMATION
20.2.1
BOTTOM-UP APPROACH
20.4
RESEARCH LIMITATIONS
20.5
RESEARCH ASSUMPTIONS AND RISK ASSESSMENT
21.1
INSIGHTS FROM INDUSTRY EXPERTS
21.3
KNOWLEDGESTORE: MARKETSANDMARKETS’ SUBSCRIPTION PORTAL
21.4
CUSTOMIZATION OPTIONS
21.4.1
EXHAUST SYSTEM MARKET, BY SENSOR TYPE
21.4.1.3
TEMPERATURE SENSORS
21.4.2
EXHAUST SYSTEM COMPONENT OE MARKET, BY VEHICLE TYPE
21.4.3
HYBRID VEHICLE EXHAUST SYSTEM OE MARKET, BY AFTERTREATMENT DEVICE
21.4.4
TWO & THREE-WHEELER VEHICLE EXHAUST SYSTEM OE MARKET, BY REGION
21.4.4.4
REST OF THE WORLD
TABLE 1
CURRENCY EXCHANGE RATES
TABLE 2
OVERVIEW OF SHIFT IN PASSENGER CAR TECHNOLOGY AND IMPACT ON EXHAUST COMPONENTS
TABLE 3
OVERVIEW OF VEHICULAR ACOUSTIC TECHNOLOGIES
TABLE 4
OVERVIEW OF EMISSIONS REGULATIONS AND THEIR IMPACT ON EXHAUST SYSTEMS
TABLE 5
OVERVIEW OF EMISSIONS REGULATION SPECIFICATIONS FOR PASSENGER CARS, 2019–2026
TABLE 6
EMISSION NORMS FOR PASSENGER CARS, BY COUNTRY
TABLE 7
STRATEGIC MOVES BY TIER-1/2/3 PLAYERS
TABLE 8
STRATEGIC MOVES BY OEMS ON POWERTRAIN ALIGNMENT, BY POWERTRAIN
TABLE 9
STRATEGIC MOVES BY OEMS ON POWERTRAIN ALIGNMENT, BY OEM
TABLE 10
GDP PERCENTAGE CHANGE, BY COUNTRY, 2021–2030
TABLE 11
ROLE OF COMPANIES IN ECOSYSTEM
TABLE 12
AVERAGE SELLING PRICE, BY COMPONENT, 2025 (USD)
TABLE 13
AVERAGE SELLING PRICE, BY REGION, 2025 (USD)
TABLE 14
KEY CONFERENCES AND EVENTS, 2026–2027
TABLE 15
IMPORT DATA FOR HS CODE 870310-COMPLIANT PRODUCTS, BY COUNTRY, 2022–2025 (USD THOUSAND)
TABLE 16
EXPORT DATA FOR HS CODE 870310-COMPLIANT PRODUCTS, BY COUNTRY, 2022–2025 (USD THOUSAND)
TABLE 17
BENEFITS OF ADVANCED MATERIAL TECHNOLOGY
TABLE 18
CONVENTIONAL VS. HYDROFORMED EXHAUST TUBE MANUFACTURING
TABLE 19
BENEFITS OF THERMAL SHIELDING TECHNOLOGY
TABLE 21
SUPPLIER-LEVEL EXHAUST CAPABILITY BENCHMARKING
TABLE 22
NORTH AMERICA: REGULATORY BODIES, GOVERNMENT AGENCIES, AND OTHER ORGANIZATIONS
TABLE 23
EUROPE: REGULATORY BODIES, GOVERNMENT AGENCIES, AND OTHER ORGANIZATIONS
TABLE 24
ASIA PACIFIC: REGULATORY BODIES, GOVERNMENT AGENCIES, AND OTHER ORGANIZATIONS
TABLE 25
REST OF THE WORLD: REGULATORY BODIES, GOVERNMENT AGENCIES, AND OTHER ORGANIZATIONS
TABLE 26
US: CAFE STANDARDS FOR EACH MODEL YEAR IN MILES PER GALLON, 2019–2025
TABLE 27
PASSENGER CAR: POLLUTANT LIMIT REDUCTION FROM EURO 6 TO EURO 7
TABLE 28
CHINA: CHINA 6A AND 6B STANDARDS
TABLE 29
INFLUENCE OF STAKEHOLDERS ON BUYING PROCESS, BY VEHICLE TYPE (%)
TABLE 30
KEY BUYING CRITERIA, BY VEHICLE TYPE
TABLE 31
UNMET NEEDS IN EXHAUST SYSTEM MARKET, BY END-USE INDUSTRY
TABLE 32
EXHAUST SYSTEM OE MARKET, BY COMPONENT, 2022–2025 (THOUSAND UNITS)
TABLE 33
EXHAUST SYSTEM OE MARKET, BY COMPONENT, 2026–2033 (THOUSAND UNITS)
TABLE 34
EXHAUST SYSTEM OE MARKET, BY COMPONENT, 2022–2025 (USD MILLION)
TABLE 35
EXHAUST SYSTEM OE MARKET, BY COMPONENT, 2026–2033 (USD MILLION)
TABLE 36
SENSORS: EXHAUST SYSTEM OE MARKET, BY TYPE, 2022–2025 (THOUSAND UNITS)
TABLE 37
SENSORS: EXHAUST SYSTEM OE MARKET, BY TYPE, 2026–2033 (THOUSAND UNITS)
TABLE 38
SENSORS: EXHAUST SYSTEM OE MARKET, BY TYPE, 2022–2025 (USD MILLION)
TABLE 39
SENSORS: EXHAUST SYSTEM OE MARKET, BY TYPE, 2026–2033 (USD MILLION)
TABLE 40
NOX SENSORS: EXHAUST SYSTEM OE MARKET, BY REGION, 2022–2025 (THOUSAND UNITS)
TABLE 41
NOX SENSORS: EXHAUST SYSTEM OE MARKET, BY REGION, 2026–2033 (THOUSAND UNITS)
TABLE 42
NOX SENSORS: EXHAUST SYSTEM OE MARKET, BY REGION, 2022–2025 (USD MILLION)
TABLE 43
NOX SENSORS: EXHAUST SYSTEM OE MARKET, BY REGION, 2026–2033 (USD MILLION)
TABLE 44
OXYGEN SENSORS: EXHAUST SYSTEM OE MARKET, BY REGION, 2022–2025 (THOUSAND UNITS)
TABLE 45
OXYGEN SENSORS: EXHAUST SYSTEM OE MARKET, BY REGION, 2026–2033 (THOUSAND UNITS)
TABLE 46
OXYGEN SENSORS: EXHAUST SYSTEM OE MARKET, BY REGION, 2022–2025 (USD MILLION)
TABLE 47
OXYGEN SENSORS: EXHAUST SYSTEM OE MARKET, BY REGION, 2026–2033 (USD MILLION)
TABLE 48
TEMPERATURE SENSORS: EXHAUST SYSTEM OE MARKET, BY REGION, 2022–2025 (THOUSAND UNITS)
TABLE 49
TEMPERATURE SENSORS: EXHAUST SYSTEM OE MARKET, BY REGION, 2026–2033 (THOUSAND UNITS)
TABLE 50
TEMPERATURE SENSORS: EXHAUST SYSTEM OE MARKET, BY REGION, 2022–2025 (USD MILLION)
TABLE 51
TEMPERATURE SENSORS: EXHAUST SYSTEM OE MARKET, BY REGION, 2026–2033 (USD MILLION)
TABLE 52
PM SENSORS: EXHAUST SYSTEM OE MARKET, BY REGION, 2022–2025 (THOUSAND UNITS)
TABLE 53
PM SENSORS: EXHAUST SYSTEM OE MARKET, BY REGION, 2026–2033 (THOUSAND UNITS)
TABLE 54
PM SENSORS: EXHAUST SYSTEM OE MARKET, BY REGION, 2022–2025 (USD MILLION)
TABLE 55
PM SENSORS: EXHAUST SYSTEM OE MARKET, BY REGION, 2026–2033 (USD MILLION)
TABLE 56
CATALYTIC CONVERTERS: EXHAUST SYSTEM OE MARKET, BY REGION, 2022–2025 (THOUSAND UNITS)
TABLE 57
CATALYTIC CONVERTERS: EXHAUST SYSTEM OE MARKET, BY REGION, 2026–2033 (THOUSAND UNITS)
TABLE 58
CATALYTIC CONVERTERS: EXHAUST SYSTEM OE MARKET, BY REGION, 2022–2025 (USD MILLION)
TABLE 59
CATALYTIC CONVERTERS: EXHAUST SYSTEM OE MARKET, BY REGION, 2026–2033 (USD MILLION)
TABLE 60
DOWNPIPES: EXHAUST SYSTEM OE MARKET, BY REGION, 2022–2025 (THOUSAND UNITS)
TABLE 61
DOWNPIPES: EXHAUST SYSTEM OE MARKET, BY REGION, 2026–2033 (THOUSAND UNITS)
TABLE 62
DOWNPIPES: EXHAUST SYSTEM OE MARKET, BY REGION, 2022–2025 (USD MILLION)
TABLE 63
DOWNPIPES: EXHAUST SYSTEM OE MARKET, BY REGION, 2026–2033 (USD MILLION)
TABLE 64
MANIFOLDS: EXHAUST SYSTEM OE MARKET, BY REGION, 2022–2025 (THOUSAND UNITS)
TABLE 65
MANIFOLDS: EXHAUST SYSTEM OE MARKET, BY REGION, 2026–2033 (THOUSAND UNITS)
TABLE 66
MANIFOLDS: EXHAUST SYSTEM OE MARKET, BY REGION, 2022–2025 (USD MILLION)
TABLE 67
MANIFOLDS: EXHAUST SYSTEM OE MARKET, BY REGION, 2026–2033 (USD MILLION)
TABLE 68
MUFFLERS: EXHAUST SYSTEM OE MARKET, BY REGION, 2022–2025 (THOUSAND UNITS)
TABLE 69
MUFFLERS: EXHAUST SYSTEM OE MARKET, BY REGION, 2026–2033 (THOUSAND UNITS)
TABLE 70
MUFFLERS: EXHAUST SYSTEM OE MARKET, BY REGION, 2022–2025 (USD MILLION)
TABLE 71
MUFFLERS: EXHAUST SYSTEM OE MARKET, BY REGION, 2026–2033 (USD MILLION)
TABLE 72
TAILPIPES: EXHAUST SYSTEM OE MARKET, BY REGION, 2022–2025 (THOUSAND UNITS)
TABLE 73
TAILPIPES: EXHAUST SYSTEM OE MARKET, BY REGION, 2026–2033 (THOUSAND UNITS)
TABLE 74
TAILPIPES: EXHAUST SYSTEM OE MARKET, BY REGION, 2022–2025 (USD MILLION)
TABLE 75
TAILPIPES: EXHAUST SYSTEM OE MARKET, BY REGION, 2026–2033 (USD MILLION)
TABLE 76
HANGERS: EXHAUST SYSTEM OE MARKET, BY REGION, 2022–2025 (THOUSAND UNITS)
TABLE 77
HANGERS: EXHAUST SYSTEM OE MARKET, BY REGION, 2026–2033 (THOUSAND UNITS)
TABLE 78
HANGERS: EXHAUST SYSTEM OE MARKET, BY REGION, 2022–2025 (USD MILLION)
TABLE 79
HANGERS: EXHAUST SYSTEM OE MARKET, BY REGION, 2026–2033 (USD MILLION)
TABLE 80
EXHAUST SYSTEM OE MARKET, BY FUEL TYPE, 2022–2025 (THOUSAND UNITS)
TABLE 81
EXHAUST SYSTEM OE MARKET, BY FUEL TYPE, 2026–2033 (THOUSAND UNITS)
TABLE 82
EXHAUST SYSTEM OE MARKET, BY FUEL TYPE, 2022–2025 (USD MILLION)
TABLE 83
EXHAUST SYSTEM OE MARKET, BY FUEL TYPE, 2026–2033 (USD MILLION)
TABLE 84
GASOLINE: EXHAUST SYSTEM OE MARKET, BY REGION, 2022–2025 (THOUSAND UNITS)
TABLE 85
GASOLINE: EXHAUST SYSTEM OE MARKET, BY REGION, 2026–2033 (THOUSAND UNITS)
TABLE 86
GASOLINE: EXHAUST SYSTEM OE MARKET, BY REGION, 2022–2025 (USD MILLION)
TABLE 87
GASOLINE: EXHAUST SYSTEM OE MARKET, BY REGION, 2026–2033 (USD MILLION)
TABLE 88
DIESEL: EXHAUST SYSTEM OE MARKET, BY REGION, 2022–2025 (THOUSAND UNITS)
TABLE 89
DIESEL: EXHAUST SYSTEM OE MARKET, BY REGION, 2026–2033 (UNITS)
TABLE 90
DIESEL: EXHAUST SYSTEM OE MARKET, BY REGION, 2022–2025 (USD MILLION)
TABLE 91
DIESEL: EXHAUST SYSTEM OE MARKET, BY REGION, 2026–2033 (USD MILLION)
TABLE 92
EXHAUST SYSTEM OE MARKET, BY VEHICLE TYPE, 2022–2025 (THOUSAND UNITS)
TABLE 93
EXHAUST SYSTEM OE MARKET, BY VEHICLE TYPE, 2026–2033 (THOUSAND UNITS)
TABLE 94
EXHAUST SYSTEM OE MARKET, BY VEHICLE TYPE, 2022–2025 (USD MILLION)
TABLE 95
EXHAUST SYSTEM OE MARKET, BY VEHICLE TYPE, 2026–2033 (USD MILLION)
TABLE 96
PASSENGER CARS: EXHAUST SYSTEM OE MARKET, BY REGION, 2022–2025 (THOUSAND UNITS)
TABLE 97
PASSENGER CARS: EXHAUST SYSTEM OE MARKET, BY REGION, 2026–2033 (THOUSAND UNITS)
TABLE 98
PASSENGER CARS: EXHAUST SYSTEM OE MARKET, BY REGION, 2022–2025 (USD MILLION)
TABLE 99
PASSENGER CARS: EXHAUST SYSTEM OE MARKET, BY REGION, 2026–2033 (USD MILLION)
TABLE 100
LIGHT COMMERCIAL VEHICLES: EXHAUST SYSTEM OE MARKET, BY REGION, 2022–2025 (THOUSAND UNITS)
TABLE 101
LIGHT COMMERCIAL VEHICLES: EXHAUST SYSTEM OE MARKET, BY REGION, 2026–2033 (THOUSAND UNITS)
TABLE 102
LIGHT COMMERCIAL VEHICLES: EXHAUST SYSTEM OE MARKET, BY REGION, 2022–2025 (USD MILLION)
TABLE 103
LIGHT COMMERCIAL VEHICLES: EXHAUST SYSTEM OE MARKET, BY REGION, 2026–2033 (USD MILLION)
TABLE 104
TRUCKS: EXHAUST SYSTEM OE MARKET, BY REGION, 2022–2025 (THOUSAND UNITS)
TABLE 105
TRUCKS: EXHAUST SYSTEM OE MARKET, BY REGION, 2026–2033 (THOUSAND UNITS)
TABLE 106
TRUCKS: EXHAUST SYSTEM OE MARKET, BY REGION, 2022–2025 (USD MILLION)
TABLE 107
TRUCKS: EXHAUST SYSTEM OE MARKET, BY REGION, 2026–2033 (USD MILLION)
TABLE 108
PRODUCTION OF BUSES & COACHES IN 2025
TABLE 109
BUSES: EXHAUST SYSTEM OE MARKET, BY REGION, 2022–2025 (THOUSAND UNITS)
TABLE 110
BUSES: EXHAUST SYSTEM OE MARKET, BY REGION, 2026–2033 (THOUSAND UNITS)
TABLE 111
BUSES: EXHAUST SYSTEM OE MARKET, BY REGION, 2022–2025 (USD MILLION)
TABLE 112
BUSES: EXHAUST SYSTEM OE MARKET, BY REGION, 2026–2033 (USD MILLION)
TABLE 113
EXHAUST SYSTEM MARKET, BY SALES CHANNEL, 2022–2025 (THOUSAND UNITS)
TABLE 114
EXHAUST SYSTEM MARKET, BY SALES CHANNEL, 2026–2033 (THOUSAND UNITS)
TABLE 115
EXHAUST SYSTEM MARKET, BY SALES CHANNEL, 2022–2025 (USD MILLION)
TABLE 116
EXHAUST SYSTEM MARKET, BY SALES CHANNEL, 2026–2033 (USD MILLION)
TABLE 117
EXHAUST SYSTEM AFTERMARKET, BY REGION, 2022–2025 (THOUSAND UNITS)
TABLE 118
EXHAUST SYSTEM AFTERMARKET, BY REGION, 2026–2033 (THOUSAND UNITS)
TABLE 119
EXHAUST SYSTEM AFTERMARKET, BY REGION, 2022–2025 (USD MILLION)
TABLE 120
EXHAUST SYSTEM AFTERMARKET, BY REGION, 2026–2033 (USD MILLION)
TABLE 121
EXHAUST SYSTEM OE MARKET, BY REGION, 2022–2025 (THOUSAND UNITS)
TABLE 122
EXHAUST SYSTEM OE MARKET, BY REGION, 2026–2033 (THOUSAND UNITS)
TABLE 123
EXHAUST SYSTEM OE MARKET, BY REGION, 2022–2025 (USD MILLION)
TABLE 124
EXHAUST SYSTEM OE MARKET, BY REGION, 2026–2033 (USD MILLION)
TABLE 125
EXHAUST SYSTEM OE MARKET, BY AFTERTREATMENT DEVICE, 2022–2025 (THOUSAND UNITS)
TABLE 126
EXHAUST SYSTEM OE MARKET, BY AFTERTREATMENT DEVICE, 2026–2033 (THOUSAND UNITS)
TABLE 127
EXHAUST SYSTEM OE MARKET, BY AFTERTREATMENT DEVICE, 2022–2025 (USD MILLION)
TABLE 128
EXHAUST SYSTEM OE MARKET, BY AFTERTREATMENT DEVICE, 2026–2033 (USD MILLION)
TABLE 129
DIESEL OXIDATION CATALYST: EXHAUST SYSTEM OE MARKET, BY REGION, 2022–2025 (THOUSAND UNITS)
TABLE 130
DIESEL OXIDATION CATALYST: EXHAUST SYSTEM OE MARKET, BY REGION, 2026–2033 (THOUSAND UNITS)
TABLE 131
DIESEL OXIDATION CATALYST: EXHAUST SYSTEM OE MARKET, BY REGION, 2022–2025 (USD MILLION)
TABLE 132
DIESEL OXIDATION CATALYST: EXHAUST SYSTEM OE MARKET, BY REGION, 2026–2033 (USD MILLION)
TABLE 133
DIESEL PARTICULATE FILTER: EXHAUST SYSTEM OE MARKET, BY REGION, 2022–2025 (THOUSAND UNITS)
TABLE 134
DIESEL PARTICULATE FILTER: EXHAUST SYSTEM OE MARKET, BY REGION, 2026–2033 (THOUSAND UNITS)
TABLE 135
DIESEL PARTICULATE FILTER: EXHAUST SYSTEM OE MARKET, BY REGION, 2022–2025 (USD MILLION)
TABLE 136
DIESEL PARTICULATE FILTER: EXHAUST SYSTEM OE MARKET, BY REGION, 2026–2033 (USD MILLION)
TABLE 137
LEAN NOX TRAP: EXHAUST SYSTEM OE MARKET, BY REGION, 2022–2025 (THOUSAND UNITS)
TABLE 138
LEAN NOX TRAP: EXHAUST SYSTEM OE MARKET, BY REGION, 2026–2033 (THOUSAND UNITS)
TABLE 139
LEAN NOX TRAP: EXHAUST SYSTEM OE MARKET, BY REGION, 2022–2025 (USD MILLION)
TABLE 140
LEAN NOX TRAP: EXHAUST SYSTEM OE MARKET, BY REGION, 2026–2033 (USD MILLION)
TABLE 141
SELECTIVE CATALYTIC REDUCTION: EXHAUST SYSTEM OE MARKET, BY REGION, 2022–2025 (THOUSAND UNITS)
TABLE 142
SELECTIVE CATALYTIC REDUCTION: EXHAUST SYSTEM OE MARKET, BY REGION, 2026–2033 (THOUSAND UNITS)
TABLE 143
SELECTIVE CATALYTIC REDUCTION: EXHAUST SYSTEM OE MARKET, BY REGION, 2022–2025 (USD MILLION)
TABLE 144
SELECTIVE CATALYTIC REDUCTION: EXHAUST SYSTEM OE MARKET, BY REGION, 2026–2033 (USD MILLION)
TABLE 145
GASOLINE PARTICULATE FILTER: EXHAUST SYSTEM OE MARKET, BY REGION, 2022–2025 (THOUSAND UNITS)
TABLE 146
GASOLINE PARTICULATE FILTER: EXHAUST SYSTEM OE MARKET, BY REGION, 2026–2033 (THOUSAND UNITS)
TABLE 147
GASOLINE PARTICULATE FILTER: EXHAUST SYSTEM OE MARKET, BY REGION, 2022–2025 (USD MILLION)
TABLE 148
GASOLINE PARTICULATE FILTER: EXHAUST SYSTEM OE MARKET, BY REGION, 2026–2033 (USD MILLION)
TABLE 149
EXHAUST SYSTEM AFTERMARKET, BY AFTERTREATMENT DEVICE, 2022–2025 (THOUSAND UNITS)
TABLE 150
EXHAUST SYSTEM AFTERMARKET, BY AFTERTREATMENT DEVICE, 2026–2033 (THOUSAND UNITS)
TABLE 151
EXHAUST SYSTEM AFTERMARKET, BY AFTERTREATMENT DEVICE, 2022–2025 (USD MILLION)
TABLE 152
EXHAUST SYSTEM AFTERMARKET, BY AFTERTREATMENT DEVICE, 2026–2033 (USD MILLION)
TABLE 153
DIESEL OXIDATION CATALYST: EXHAUST SYSTEM AFTERMARKET, BY REGION, 2022–2025 (THOUSAND UNITS)
TABLE 154
DIESEL OXIDATION CATALYST: EXHAUST SYSTEM AFTERMARKET, BY REGION, 2026–2033 (THOUSAND UNITS)
TABLE 155
DIESEL OXIDATION CATALYST: EXHAUST SYSTEM AFTERMARKET, BY REGION, 2022–2025 (USD MILLION)
TABLE 156
DIESEL OXIDATION CATALYST: EXHAUST SYSTEM AFTERMARKET, BY REGION, 2026–2033 (USD MILLION)
TABLE 157
DIESEL PARTICULATE FILTER: EXHAUST SYSTEM AFTERMARKET, BY REGION, 2022–2025 (THOUSAND UNITS)
TABLE 158
DIESEL PARTICULATE FILTER: EXHAUST SYSTEM AFTERMARKET, BY REGION, 2026–2033 (THOUSAND UNITS)
TABLE 159
DIESEL PARTICULATE FILTER: EXHAUST SYSTEM AFTERMARKET, BY REGION, 2022–2025 (USD MILLION)
TABLE 160
DIESEL PARTICULATE FILTER: EXHAUST SYSTEM AFTERMARKET, BY REGION, 2026–2033 (USD MILLION)
TABLE 161
SELECTIVE CATALYTIC REDUCTION: EXHAUST SYSTEM AFTERMARKET, BY REGION, 2022–2025 (THOUSAND UNITS)
TABLE 162
SELECTIVE CATALYTIC REDUCTION: EXHAUST SYSTEM AFTERMARKET, BY REGION, 2026–2033 (THOUSAND UNITS)
TABLE 163
SELECTIVE CATALYTIC REDUCTION: EXHAUST SYSTEM AFTERMARKET, BY REGION, 2022–2025 (USD MILLION)
TABLE 164
SELECTIVE CATALYTIC REDUCTION: EXHAUST SYSTEM AFTERMARKET, BY REGION, 2026–2033 (USD MILLION)
TABLE 165
OFF-HIGHWAY VEHICLE EXHAUST SYSTEM OE MARKET, BY AFTERTREATMENT DEVICE, 2022–2025 (THOUSAND UNITS)
TABLE 166
OFF-HIGHWAY VEHICLE EXHAUST SYSTEM OE MARKET, BY AFTERTREATMENT DEVICE, 2026–2033 (THOUSAND UNITS)
TABLE 167
OFF-HIGHWAY VEHICLE EXHAUST SYSTEM OE MARKET, BY AFTERTREATMENT DEVICE, 2022–2025 (USD MILLION)
TABLE 168
OFF-HIGHWAY VEHICLE EXHAUST SYSTEM OE MARKET, BY AFTERTREATMENT DEVICE, 2026–2033 (USD MILLION)
TABLE 169
DIESEL PARTICULATE FILTER: OFF-HIGHWAY VEHICLE EXHAUST SYSTEM OE MARKET, BY REGION, 2022–2025 (THOUSAND UNITS)
TABLE 170
DIESEL PARTICULATE FILTER: OFF-HIGHWAY VEHICLE EXHAUST SYSTEM OE MARKET, BY REGION, 2026–2033 (THOUSAND UNITS)
TABLE 171
DIESEL PARTICULATE FILTER: OFF-HIGHWAY VEHICLE EXHAUST SYSTEM OE MARKET, BY REGION, 2022–2025 (USD MILLION)
TABLE 172
DIESEL PARTICULATE FILTER: OFF-HIGHWAY VEHICLE EXHAUST SYSTEM OE MARKET, BY REGION, 2026–2033 (USD MILLION)
TABLE 173
DIESEL OXIDATION CATALYST: OFF-HIGHWAY VEHICLE EXHAUST SYSTEM OE MARKET, BY REGION, 2022–2025 (THOUSAND UNITS)
TABLE 174
DIESEL OXIDATION CATALYST: OFF-HIGHWAY VEHICLE EXHAUST SYSTEM OE MARKET, BY REGION, 2026–2033 (THOUSAND UNITS)
TABLE 175
DIESEL OXIDATION CATALYST: OFF-HIGHWAY VEHICLE EXHAUST SYSTEM OE MARKET, BY REGION, 2022–2025 (USD MILLION)
TABLE 176
DIESEL OXIDATION CATALYST: OFF-HIGHWAY VEHICLE EXHAUST SYSTEM OE MARKET, BY REGION, 2026–2033 (USD MILLION)
TABLE 177
SELECTIVE CATALYTIC REDUCTION: OFF-HIGHWAY VEHICLE EXHAUST SYSTEM OE MARKET, BY REGION, 2022–2025 (THOUSAND UNITS)
TABLE 178
SELECTIVE CATALYTIC REDUCTION: OFF-HIGHWAY VEHICLE EXHAUST SYSTEM OE MARKET, BY REGION, 2026–2033 (THOUSAND UNITS)
TABLE 179
SELECTIVE CATALYTIC REDUCTION: OFF-HIGHWAY VEHICLE EXHAUST SYSTEM OE MARKET, BY REGION, 2022–2025 (USD MILLION)
TABLE 180
SELECTIVE CATALYTIC REDUCTION: OFF-HIGHWAY VEHICLE EXHAUST SYSTEM OE MARKET, BY REGION, 2026–2033 (USD MILLION)
TABLE 181
OFF-HIGHWAY VEHICLE EXHAUST SYSTEM OE MARKET, BY EQUIPMENT TYPE, 2022–2025 (THOUSAND UNITS)
TABLE 182
OFF-HIGHWAY VEHICLE EXHAUST SYSTEM OE MARKET, BY EQUIPMENT TYPE, 2026–2033 (THOUSAND UNITS)
TABLE 183
OFF-HIGHWAY VEHICLE EXHAUST SYSTEM OE MARKET, BY EQUIPMENT TYPE, 2022–2025 (USD MILLION)
TABLE 184
OFF-HIGHWAY VEHICLE EXHAUST SYSTEM OE MARKET, BY EQUIPMENT TYPE, 2026–2033 (USD MILLION)
TABLE 185
AGRICULTURAL TRACTORS: OFF-HIGHWAY VEHICLE EXHAUST SYSTEM OE MARKET, BY REGION, 2022–2025 (THOUSAND UNITS)
TABLE 186
AGRICULTURAL TRACTORS: OFF-HIGHWAY VEHICLE EXHAUST SYSTEM OE MARKET, BY REGION, 2026–2033 (THOUSAND UNITS)
TABLE 187
AGRICULTURAL TRACTORS: OFF-HIGHWAY VEHICLE EXHAUST SYSTEM OE MARKET, BY REGION, 2022–2025 (USD MILLION)
TABLE 188
AGRICULTURAL TRACTORS: OFF-HIGHWAY VEHICLE EXHAUST SYSTEM OE MARKET, BY REGION, 2026–2033 (USD MILLION)
TABLE 189
CONSTRUCTION EQUIPMENT: OFF-HIGHWAY VEHICLE EXHAUST SYSTEM OE MARKET, BY REGION, 2022–2025 (THOUSAND UNITS)
TABLE 190
CONSTRUCTION EQUIPMENT: OFF-HIGHWAY VEHICLE EXHAUST SYSTEM OE MARKET, BY REGION, 2026–2033 (THOUSAND UNITS)
TABLE 191
CONSTRUCTION EQUIPMENT: OFF-HIGHWAY VEHICLE EXHAUST SYSTEM OE MARKET, BY REGION, 2022–2025 (USD MILLION)
TABLE 192
CONSTRUCTION EQUIPMENT: OFF-HIGHWAY VEHICLE EXHAUST SYSTEM OE MARKET, BY REGION, 2026–2033 (USD MILLION)
TABLE 193
MINING EQUIPMENT: OFF-HIGHWAY VEHICLE EXHAUST SYSTEM OE MARKET, BY REGION, 2022–2025 (THOUSAND UNITS)
TABLE 194
MINING EQUIPMENT: OFF-HIGHWAY VEHICLE EXHAUST SYSTEM OE MARKET, BY REGION, 2026–2033 (THOUSAND UNITS)
TABLE 195
MINING EQUIPMENT: OFF-HIGHWAY VEHICLE EXHAUST SYSTEM OE MARKET, BY REGION, 2022–2025 (USD MILLION)
TABLE 196
MINING EQUIPMENT: OFF-HIGHWAY VEHICLE EXHAUST SYSTEM OE MARKET, BY REGION, 2026–2033 (USD MILLION)
TABLE 197
EXHAUST SYSTEM MARKET, BY REGION, 2022–2025 (THOUSAND UNITS)
TABLE 198
EXHAUST SYSTEM MARKET, BY REGION, 2026–2033 (THOUSAND UNITS)
TABLE 199
EXHAUST SYSTEM MARKET, BY REGION, 2022–2025 (USD MILLION)
TABLE 200
EXHAUST SYSTEM MARKET, BY REGION, 2026–2033 (USD MILLION)
TABLE 201
ASIA PACIFIC: EXHAUST SYSTEM MARKET, BY COUNTRY, 2022–2025 (THOUSAND UNITS)
TABLE 202
ASIA PACIFIC: EXHAUST SYSTEM MARKET, BY COUNTRY, 2026–2033 (THOUSAND UNITS)
TABLE 203
ASIA PACIFIC: EXHAUST SYSTEM MARKET, BY COUNTRY, 2022–2025 (USD MILLION)
TABLE 204
ASIA PACIFIC: EXHAUST SYSTEM MARKET, BY COUNTRY, 2026–2033 (USD MILLION)
TABLE 205
CHINA: EXHAUST SYSTEM MARKET, BY COMPONENT, 2022–2025 (THOUSAND UNITS)
TABLE 206
CHINA: EXHAUST SYSTEM MARKET, BY COMPONENT, 2026–2033 (THOUSAND UNITS)
TABLE 207
CHINA: EXHAUST SYSTEM MARKET, BY COMPONENT, 2022–2025 (USD MILLION)
TABLE 208
CHINA: EXHAUST SYSTEM MARKET, BY COMPONENT, 2026–2033 (USD MILLION)
TABLE 209
INDIA: EXHAUST SYSTEM MARKET, BY COMPONENT, 2022–2025 (THOUSAND UNITS)
TABLE 210
INDIA: EXHAUST SYSTEM MARKET, BY COMPONENT, 2026–2033 (THOUSAND UNITS)
TABLE 211
INDIA: EXHAUST SYSTEM MARKET, BY COMPONENT, 2022–2025 (USD MILLION)
TABLE 212
INDIA: EXHAUST SYSTEM MARKET, BY COMPONENT, 2026–2033 (USD MILLION)
TABLE 213
JAPAN: EXHAUST SYSTEM MARKET, BY COMPONENT, 2022–2025 (THOUSAND UNITS)
TABLE 214
JAPAN: EXHAUST SYSTEM MARKET, BY COMPONENT, 2026–2033 (THOUSAND UNITS)
TABLE 215
JAPAN: EXHAUST SYSTEM MARKET, BY COMPONENT, 2022–2025 (USD MILLION)
TABLE 216
JAPAN: EXHAUST SYSTEM MARKET, BY COMPONENT, 2026–2033 (USD MILLION)
TABLE 217
SOUTH KOREA: EXHAUST SYSTEM MARKET, BY COMPONENT, 2022–2025 (THOUSAND UNITS)
TABLE 218
SOUTH KOREA: EXHAUST SYSTEM MARKET, BY COMPONENT, 2026–2033 (THOUSAND UNITS)
TABLE 219
SOUTH KOREA: EXHAUST SYSTEM MARKET, BY COMPONENT, 2022–2025 (USD MILLION)
TABLE 220
SOUTH KOREA: EXHAUST SYSTEM MARKET, BY COMPONENT, 2026–2033 (USD MILLION)
TABLE 221
THAILAND: EXHAUST SYSTEM MARKET, BY COMPONENT, 2022–2025 (THOUSAND UNITS)
TABLE 222
THAILAND: EXHAUST SYSTEM MARKET, BY COMPONENT, 2026–2033 (THOUSAND UNITS)
TABLE 223
THAILAND: EXHAUST SYSTEM MARKET, BY COMPONENT, 2022–2025 (USD MILLION)
TABLE 224
THAILAND: EXHAUST SYSTEM MARKET, BY COMPONENT, 2026–2033 (USD MILLION)
TABLE 225
REST OF ASIA PACIFIC: EXHAUST SYSTEM MARKET, BY COMPONENT, 2022–2025 (THOUSAND UNITS)
TABLE 226
REST OF ASIA PACIFIC: EXHAUST SYSTEM MARKET, BY COMPONENT, 2026–2033 (THOUSAND UNITS)
TABLE 227
REST OF ASIA PACIFIC: EXHAUST SYSTEM MARKET, BY COMPONENT, 2022–2025 (USD MILLION)
TABLE 228
REST OF ASIA PACIFIC: EXHAUST SYSTEM MARKET, BY COMPONENT, 2026–2033 (USD MILLION)
TABLE 229
EUROPE: EXHAUST SYSTEM MARKET, BY COUNTRY, 2022–2025 (THOUSAND UNITS)
TABLE 230
EUROPE: EXHAUST SYSTEM MARKET, BY COUNTRY, 2026–2033 (THOUSAND UNITS)
TABLE 231
EUROPE: EXHAUST SYSTEM MARKET, BY COUNTRY, 2022–2025 (USD MILLION)
TABLE 232
EUROPE: EXHAUST SYSTEM MARKET, BY COUNTRY, 2026–2033 (USD MILLION)
TABLE 233
GERMANY: EXHAUST SYSTEM MARKET, BY COMPONENT, 2022–2025 (THOUSAND UNITS)
TABLE 234
GERMANY: EXHAUST SYSTEM MARKET, BY COMPONENT, 2026–2033 (THOUSAND UNITS)
TABLE 235
GERMANY: EXHAUST SYSTEM MARKET, BY COMPONENT, 2022–2025 (USD MILLION)
TABLE 236
GERMANY: EXHAUST SYSTEM MARKET, BY COMPONENT, 2026–2033 (USD MILLION)
TABLE 237
FRANCE: EXHAUST SYSTEM MARKET, BY COMPONENT, 2022–2025 (THOUSAND UNITS)
TABLE 238
FRANCE: EXHAUST SYSTEM MARKET, BY COMPONENT, 2026–2033 (THOUSAND UNITS)
TABLE 239
FRANCE: EXHAUST SYSTEM MARKET, BY COMPONENT, 2022–2025 (USD MILLION)
TABLE 240
FRANCE: EXHAUST SYSTEM MARKET, BY COMPONENT, 2026–2033 (USD MILLION)
TABLE 241
UK: EXHAUST SYSTEM MARKET, BY COMPONENT, 2022–2025 (THOUSAND UNITS)
TABLE 242
UK: EXHAUST SYSTEM MARKET, BY COMPONENT, 2026–2033 (THOUSAND UNITS)
TABLE 243
UK: EXHAUST SYSTEM MARKET, BY COMPONENT, 2022–2025 (USD MILLION)
TABLE 244
UK: EXHAUST SYSTEM MARKET, BY COMPONENT, 2026–2033 (USD MILLION)
TABLE 245
SPAIN: EXHAUST SYSTEM MARKET, BY COMPONENT, 2022–2025 (THOUSAND UNITS)
TABLE 246
SPAIN: EXHAUST SYSTEM MARKET, BY COMPONENT, 2026–2033 (THOUSAND UNITS)
TABLE 247
SPAIN: EXHAUST SYSTEM MARKET, BY COMPONENT, 2022–2025 (USD MILLION)
TABLE 248
SPAIN: EXHAUST SYSTEM MARKET, BY COMPONENT, 2026–2033 (USD MILLION)
TABLE 249
TURKEY: EXHAUST SYSTEM MARKET, BY COMPONENT, 2022–2025 (THOUSAND UNITS)
TABLE 250
TURKEY: EXHAUST SYSTEM MARKET, BY COMPONENT, 2026–2033 (THOUSAND UNITS)
TABLE 251
TURKEY: EXHAUST SYSTEM MARKET, BY COMPONENT, 2022–2025 (USD MILLION)
TABLE 252
TURKEY: EXHAUST SYSTEM MARKET, BY COMPONENT, 2026–2033 (USD MILLION)
TABLE 253
RUSSIA: EXHAUST SYSTEM MARKET, BY COMPONENT, 2022–2025 (THOUSAND UNITS)
TABLE 254
RUSSIA: EXHAUST SYSTEM MARKET, BY COMPONENT, 2026–2033 (THOUSAND UNITS)
TABLE 255
RUSSIA: EXHAUST SYSTEM MARKET, BY COMPONENT, 2022–2025 (USD MILLION)
TABLE 256
RUSSIA: EXHAUST SYSTEM MARKET, BY COMPONENT, 2026–2033 (USD MILLION)
TABLE 257
REST OF EUROPE: EXHAUST SYSTEM MARKET, BY COMPONENT, 2022–2025 (THOUSAND UNITS)
TABLE 258
REST OF EUROPE: EXHAUST SYSTEM MARKET, BY COMPONENT, 2026–2033 (THOUSAND UNITS)
TABLE 259
REST OF EUROPE: EXHAUST SYSTEM MARKET, BY COMPONENT, 2022–2025 (USD MILLION)
TABLE 260
REST OF EUROPE: EXHAUST SYSTEM MARKET, BY COMPONENT, 2026–2033 (USD MILLION)
TABLE 261
NORTH AMERICA: EXHAUST SYSTEM MARKET, BY COUNTRY, 2022–2025 (THOUSAND UNITS)
TABLE 262
NORTH AMERICA: EXHAUST SYSTEM MARKET, BY COUNTRY, 2026–2033 (THOUSAND UNITS)
TABLE 263
NORTH AMERICA: EXHAUST SYSTEM MARKET, BY COUNTRY, 2022–2025 (USD MILLION)
TABLE 264
NORTH AMERICA: EXHAUST SYSTEM MARKET, BY COUNTRY, 2026–2033 (USD MILLION)
TABLE 265
US: EXHAUST SYSTEM MARKET, BY COMPONENT, 2022–2025 (THOUSAND UNITS)
TABLE 266
US: EXHAUST SYSTEM MARKET, BY COMPONENT, 2026–2033 (THOUSAND UNITS)
TABLE 267
US: EXHAUST SYSTEM MARKET, BY COMPONENT, 2022–2025 (USD MILLION)
TABLE 268
US: EXHAUST SYSTEM MARKET, BY COMPONENT, 2026–2033 (USD MILLION)
TABLE 269
MEXICO: EXHAUST SYSTEM MARKET, BY COMPONENT, 2022–2025 (THOUSAND UNITS)
TABLE 270
MEXICO: EXHAUST SYSTEM MARKET, BY COMPONENT, 2026–2033 (THOUSAND UNITS)
TABLE 271
MEXICO: EXHAUST SYSTEM MARKET, BY COMPONENT, 2022–2025 (USD MILLION)
TABLE 272
MEXICO: EXHAUST SYSTEM MARKET, BY COMPONENT, 2026–2033 (USD MILLION)
TABLE 273
CANADA: EXHAUST SYSTEM MARKET, BY COMPONENT, 2022–2025 (THOUSAND UNITS)
TABLE 274
CANADA: EXHAUST SYSTEM MARKET, BY COMPONENT, 2026–2033 (THOUSAND UNITS)
TABLE 275
CANADA: EXHAUST SYSTEM MARKET, BY COMPONENT, 2022–2025 (USD MILLION)
TABLE 276
CANADA: EXHAUST SYSTEM MARKET, BY COMPONENT, 2026–2033 (USD MILLION)
TABLE 277
REST OF THE WORLD: EXHAUST SYSTEM MARKET, BY COUNTRY, 2022–2025 (THOUSAND UNITS)
TABLE 278
REST OF THE WORLD: EXHAUST SYSTEM MARKET, BY COUNTRY, 2026–2033 (THOUSAND UNITS)
TABLE 279
REST OF THE WORLD: EXHAUST SYSTEM MARKET, BY COUNTRY, 2022–2025 (USD MILLION)
TABLE 280
REST OF THE WORLD: EXHAUST SYSTEM MARKET, BY COUNTRY, 2026–2033 (USD MILLION)
TABLE 281
BRAZIL: EXHAUST SYSTEM MARKET, BY COMPONENT, 2022–2025 (THOUSAND UNITS)
TABLE 282
BRAZIL: EXHAUST SYSTEM MARKET, BY COMPONENT, 2026–2033 (THOUSAND UNITS)
TABLE 283
BARZIL: EXHAUST SYSTEM MARKET, BY COMPONENT, 2022–2025 (USD MILLION)
TABLE 284
BRAZIL: EXHAUST SYSTEM MARKET, BY COMPONENT, 2026–2033 (USD MILLION)
TABLE 285
ARGENTINA: EXHAUST SYSTEM MARKET, BY COMPONENT, 2022–2025 (THOUSAND UNITS)
TABLE 286
ARGENTINA: EXHAUST SYSTEM MARKET, BY COMPONENT, 2026–2033 (THOUSAND UNITS)
TABLE 287
ARGENTINA: EXHAUST SYSTEM MARKET, BY COMPONENT, 2022–2025 (USD MILLION)
TABLE 288
ARGENTINA: EXHAUST SYSTEM MARKET, BY COMPONENT, 2026–2033 (USD MILLION)
TABLE 289
OTHERS: EXHAUST SYSTEM MARKET, BY COMPONENT, 2022–2025 (THOUSAND UNITS)
TABLE 290
OTHERS: EXHAUST SYSTEM MARKET, BY COMPONENT, 2026–2033 (THOUSAND UNITS)
TABLE 291
OTHERS: EXHAUST SYSTEM MARKET, BY COMPONENT, 2022–2025 (USD MILLION)
TABLE 292
OTHERS: EXHAUST SYSTEM MARKET, BY COMPONENT, 2026–2033 (USD MILLION)
TABLE 293
KEY PLAYER STRATEGIES/RIGHT TO WIN, 2022–2026
TABLE 294
EXHAUST SYSTEM COMPONENT MARKET: DEGREE OF COMPETITION
TABLE 295
EXHAUST SYSTEM SENSOR MARKET: DEGREE OF COMPETITION
TABLE 296
EXHAUST SYSTEM COMPONENT PROVIDERS: REGION FOOTPRINT
TABLE 297
EXHAUST SYSTEM COMPONENT PROVIDERS: VEHICLE TYPE FOOTPRINT
TABLE 298
EXHAUST SYSTEM COMPONENT PROVIDERS: FUEL TYPE FOOTPRINT
TABLE 299
OFF-HIGHWAY VEHICLE EXHAUST SYSTEM SUPPLIERS: REGION FOOTPRINT
TABLE 300
OFF-HIGHWAY VEHICLE EXHAUST SYSTEM SUPPLIERS: EQUIPMENT TYPE FOOTPRINT
TABLE 301
OFF-HIGHWAY VEHICLE EXHAUST SYSTEM SUPPLIERS: FUEL TYPE FOOTPRINT
TABLE 302
EXHAUST SYSTEM MARKET: PRODUCT LAUNCHES, 2022–2026
TABLE 303
EXHAUST SYSTEM MARKET: DEALS, 2022–2026
TABLE 304
EXHAUST SYSTEM MARKET: EXPANSIONS, 2022–2026
TABLE 305
FORVIA: COMPANY OVERVIEW
TABLE 306
FORVIA: PRODUCTS OFFERED
TABLE 307
FORVIA: PRODUCT LAUNCHES/DEVELOPMENTS
TABLE 309
TENNECO INC.: COMPANY OVERVIEW
TABLE 310
TENNECO INC.: PRODUCTS OFFERED
TABLE 311
TENNECO INC.: PRODUCT LAUNCHES/DEVELOPMENTS
TABLE 312
EBERSPÄCHER: COMPANY OVERVIEW
TABLE 313
EBERSPÄCHER: PRODUCTS OFFERED
TABLE 314
EBERSPÄCHER: PRODUCT LAUNCHES/DEVELOPMENTS
TABLE 315
EBERSPÄCHER: DEALS
TABLE 316
EBERSPÄCHER: EXPANSIONS
TABLE 317
FUTABA INDUSTRIAL CO., LTD.: COMPANY OVERVIEW
TABLE 318
FUTABA INDUSTRIAL CO., LTD.: PRODUCTS OFFERED
TABLE 319
FRIEDRICH BOYSEN GMBH & CO. KG: COMPANY OVERVIEW
TABLE 320
FRIEDRICH BOYSEN GMBH & CO. KG: PRODUCTS OFFERED
TABLE 321
SANGO CO., LTD.: COMPANY OVERVIEW
TABLE 322
SANGO CO., LTD.: PRODUCTS OFFERED
TABLE 323
YUTAKA GIKEN COMPANY LIMITED: COMPANY OVERVIEW
TABLE 324
YUTAKA GIKEN COMPANY LIMITED: PRODUCTS OFFERED
TABLE 325
SEJONG INDUSTRIAL CO., LTD.: COMPANY OVERVIEW
TABLE 326
SEJONG INDUSTRIAL CO., LTD.: PRODUCTS OFFERED
TABLE 327
BOSAL: COMPANY OVERVIEW
TABLE 328
BOSAL: PRODUCTS OFFERED
TABLE 329
MARELLI HOLDINGS CO., LTD.: COMPANY OVERVIEW
TABLE 330
HIROTEC CORPORATION: COMPANY OVERVIEW
TABLE 331
BENTELER INTERNATIONAL AG: COMPANY OVERVIEW
TABLE 332
KATCON GLOBAL: COMPANY OVERVIEW
TABLE 333
VIBRACOUSTIC SE: COMPANY OVERVIEW
TABLE 334
ASMET: COMPANY OVERVIEW
TABLE 335
DINEX A/S: COMPANY OVERVIEW
TABLE 336
MAGNAFLOW: COMPANY OVERVIEW
TABLE 337
GRAND ROCK CO., INC.: COMPANY OVERVIEW
TABLE 338
EUROPEAN EXHAUST AND CATALYST LTD.: COMPANY OVERVIEW
TABLE 339
CREFACT CORPORATION: COMPANY OVERVIEW
TABLE 340
SHARDA MOTOR INDUSTRIES: COMPANY OVERVIEW
TABLE 341
EISENMANN EXHAUST SYSTEMS: COMPANY OVERVIEW
TABLE 342
DENSO: COMPANY OVERVIEW
TABLE 343
HARBIN AIRUI EMISSIONS CONTROL TECHNOLOGY CO., LTD.: COMPANY OVERVIEW
TABLE 344
CHONGQING HITER AUTOMOBILE EXHAUST SYSTEM CO., LTD.: COMPANY OVERVIEW
TABLE 345
BOSCH MOBILITY: COMPANY OVERVIEW
TABLE 346
JOHNSON MATTHEY: COMPANY OVERVIEW
TABLE 347
NGK: COMPANY OVERVIEW
TABLE 348
AUMOVIO: COMPANY OVERVIEW
TABLE 349
HITACHI ASTEMO: COMPANY OVERVIEW
FIGURE 2
GLOBAL EXHAUST SYSTEM MARKET, 2022–2033
FIGURE 3
MAJOR STRATEGIES ADOPTED BY KEY PLAYERS IN EXHAUST SYSTEM MARKET
FIGURE 4
DISRUPTIONS INFLUENCING GROWTH OF EXHAUST SYSTEM MARKET
FIGURE 5
HIGH-GROWTH SEGMENTS IN EXHAUST SYSTEM MARKET
FIGURE 6
ASIA PACIFIC TO BE LEADING REGIONAL MARKET DURING FORECAST PERIOD
FIGURE 7
RISING PRODUCTION OF PASSENGER AND COMMERCIAL VEHICLES TO DRIVE MARKET
FIGURE 8
SENSORS TO SURPASS OTHER SEGMENTS DURING FORECAST PERIOD
FIGURE 9
PASSENGER CARS TO SECURE LEADING POSITION DURING FORECAST PERIOD
FIGURE 10
GASOLINE SEGMENT TO BE LARGER THAN DIESEL SEGMENT DURING FORECAST PERIOD
FIGURE 11
SCR TO DOMINATE OE MARKET DURING FORECAST PERIOD
FIGURE 12
SCR TO DOMINATE AFTERMARKET DURING FORECAST PERIOD
FIGURE 13
AFTERMARKET TO BE PREVALENT DURING FORECAST PERIOD
FIGURE 14
AGRICULTURAL TRACTORS TO EXHIBIT FASTEST GROWTH DURING FORECAST PERIOD
FIGURE 15
SCR TO DOMINATE OFF-HIGHWAY EQUIPMENT MARKET DURING FORECAST PERIOD
FIGURE 16
ASIA PACIFIC TO BE LARGEST MARKET FOR EXHAUST SYSTEMS DURING FORECAST PERIOD
FIGURE 17
EXHAUST SYSTEM MARKET DYNAMICS
FIGURE 18
BATTERY ELECTRIC VEHICLE SALES, 2021–2026
FIGURE 19
LIFECYCLE GHG FOR GAS CAR VS. EV
FIGURE 20
PENETRATION OF PREMIUM VEHICLES IN OVERALL PRODUCTION, 2022–2030
FIGURE 21
CHANGE IN EMISSIONS LIMITS IN EUROPE
FIGURE 22
CHANGE IN EMISSIONS LIMITS IN INDIA
FIGURE 23
ECOSYSTEM ANALYSIS
FIGURE 24
SUPPLY CHAIN ANALYSIS
FIGURE 25
TRENDS/DISRUPTIONS IMPACTING CUSTOMER BUSINESS
FIGURE 26
IMPORT SCENARIO FOR HS CODE 870310-COMPLIANT PRODUCTS, BY COUNTRY, 2022–2025 (USD THOUSAND)
FIGURE 27
EXPORT SCENARIO FOR HS CODE 870310-COMPLIANT PRODUCTS, BY COUNTRY, 2022–2025 (USD THOUSAND)
FIGURE 28
SECTORS IMPACTED BY EU–INDIA FTA TRADE DEAL
FIGURE 29
IMPACT ON AUTOMOTIVE COMPONENT TRADE DUE TO EU–INDIA FTA
FIGURE 30
CRUDE OIL PRICE SURGE FOLLOWING ISRAEL–IRAN CONFLICT
FIGURE 31
INCREASE IN PETROL PRICES ACROSS KEY COUNTRIES
FIGURE 32
PATENT ANALYSIS
FIGURE 33
FUTURE APPLICATIONS
FIGURE 34
POWER OUTPUT VS. ESTIMATED EXHAUST TEMPERATURE
FIGURE 35
HYBRIDIZATION LEVEL VS. CATALYST WARM-UP TIME
FIGURE 36
OEM VS. HEAT SHIELD COVERAGE
FIGURE 37
GLOBAL ON-ROAD VEHICLE EMISSIONS STANDARDS, BY COUNTRY, 2020–2030
FIGURE 38
INFLUENCE OF STAKEHOLDERS ON BUYING PROCESS, BY VEHICLE TYPE
FIGURE 39
KEY BUYING CRITERIA, BY VEHICLE TYPE
FIGURE 40
EXHAUST SYSTEM OE MARKET, BY COMPONENT, 2026 VS. 2033 (USD MILLION)
FIGURE 41
EXHAUST SYSTEM OE MARKET, BY FUEL TYPE, 2026 VS. 2033 (USD MILLION)
FIGURE 42
EXHAUST SYSTEM OE MARKET, BY VEHICLE TYPE, 2026 VS. 2033 (USD MILLION)
FIGURE 43
EXHAUST SYSTEM MARKET, BY SALES CHANNEL, 2026 VS. 2033 (USD MILLION)
FIGURE 44
EXHAUST SYSTEM OE MARKET, BY AFTERTREATMENT DEVICE, 2026 VS. 2033 (USD MILLION)
FIGURE 45
EXHAUST SYSTEM AFTERMARKET, BY AFTERTREATMENT DEVICE, 2026 VS. 2033 (USD MILLION)
FIGURE 46
OFF-HIGHWAY VEHICLE EXHAUST SYSTEM OE MARKET, BY AFTERTREATMENT DEVICE, 2026 VS. 2033 (USD MILLION)
FIGURE 47
OFF-HIGHWAY VEHICLE EXHAUST SYSTEM OE MARKET, BY EQUIPMENT TYPE, 2026 VS. 2033 (USD MILLION)
FIGURE 48
EXHAUST SYSTEM MARKET, BY REGION, 2026 VS. 2033 (USD MILLION)
FIGURE 49
ASIA PACIFIC: EXHAUST SYSTEM MARKET SNAPSHOT
FIGURE 50
EUROPE: EXHAUST SYSTEM MARKET SNAPSHOT
FIGURE 51
NORTH AMERICA: EXHAUST SYSTEM MARKET SNAPSHOT
FIGURE 52
REST OF THE WORLD: EXHAUST SYSTEM MARKET SNAPSHOT
FIGURE 53
EXHAUST SYSTEM COMPONENT MARKET SHARE ANALYSIS, 2025
FIGURE 54
EXHAUST SYSTEM SENSOR MARKET SHARE ANALYSIS, 2025
FIGURE 55
REVENUE ANALYSIS OF TOP-LISTED/PUBLIC PLAYERS, 2021–2025
FIGURE 56
COMPANY VALUATION (USD BILLION)
FIGURE 57
FINANCIAL METRICS (EV/EBITDA)
FIGURE 58
COMPANY EVALUATION MATRIX: EXHAUST SYSTEM COMPONENT PROVIDERS, 2025
FIGURE 59
EXHAUST SYSTEM COMPONENT PROVIDERS: COMPANY FOOTPRINT
FIGURE 60
COMPANY EVALUATION MATRIX: OFF-HIGHWAY VEHICLE EXHAUST SYSTEM SUPPLIERS, 2025
FIGURE 61
OFF-HIGHWAY VEHICLE EXHAUST SYSTEM SUPPLIERS: COMPANY FOOTPRINT
FIGURE 62
FORVIA: COMPANY SNAPSHOT
FIGURE 63
TENNECO INC.: COMPANY SNAPSHOT
FIGURE 64
EBERSPÄCHER: COMPANY SNAPSHOT
FIGURE 65
FUTABA INDUSTRIAL CO., LTD.: COMPANY SNAPSHOT
FIGURE 66
FRIEDRICH BOYSEN GMBH & CO. KG: COMPANY SNAPSHOT
FIGURE 67
SANGO CO., LTD.: COMPANY SNAPSHOT
FIGURE 68
YUTAKA GIKEN COMPANY LIMITED: COMPANY SNAPSHOT
FIGURE 69
SEJONG INDUSTRIAL CO., LTD.: COMPANY SNAPSHOT
FIGURE 70
RESEARCH DESIGN
FIGURE 71
RESEARCH DESIGN MODEL
FIGURE 72
RESEARCH METHODOLOGY: HYPOTHESIS BUILDING
FIGURE 73
BOTTOM-UP APPROACH
FIGURE 74
TOP-DOWN APPROACH
FIGURE 75
FACTOR ANALYSIS FOR MARKET SIZING: DEMAND AND SUPPLY SIDES
FIGURE 76
DATA TRIANGULATION
Methodology
The study relies extensively on secondary sources, including company annual reports and presentations, industry association publications, industry magazine articles, directories, technical handbooks, the World Economic Outlook, technical articles, and databases, to identify and collect information on the exhaust system market. In-depth interviews were conducted with primary respondents, including key industry participants, subject-matter experts, C-level executives of key market players (exhaust system providers, automotive OEMs, and technology suppliers), and industry consultants, among other experts, to obtain and verify critical qualitative and quantitative information and to assess market prospects.
Secondary Research
The secondary study involves three major activities, namely, background study, market understanding, and trends. Secondary sources referred to in this research study included the International Council on Clean Transportation (ICCT), Organisation Internationale des Constructeurs d'Automobiles (OICA); corporate filings (such as annual reports, investor presentations, and financial statements); and trade, business, and automotive associations. The secondary data was collected and analyzed to arrive at the overall market size, which was further validated by primary research.
Primary Research
Extensive primary research was conducted after gaining an understanding of the exhaust system market through secondary research. Several primary interviews were conducted with market experts from exhaust system providers, after-treatment device providers, and OEMs (vehicle manufacturers) across three major regions, namely, North America, Europe, and the Asia Pacific. Approximately 80% of the primary interviews were conducted with exhaust system component providers, and 20% with OEM participants. Primary data was collected through questionnaires, emails, and telephonic interviews. Various departments within organizations, including sales, operations, and administration, were contacted to provide a holistic viewpoint in the reports while canvassing primary interviews. After interacting with industry participants, brief sessions were conducted with experienced independent consultants to reinforce the findings from the primary interviews. This, along with the opinions of in-house subject matter experts, led to the findings delineated in the rest of this report.
Primary interviews have been conducted to gather insights, including exhaust system market sizing and forecast, future trends, and upcoming technologies in the exhaust system market. Data triangulation of these points was performed using information from secondary research and model mapping. Stakeholders from the demand and supply sides have been interviewed to understand their views on these points.
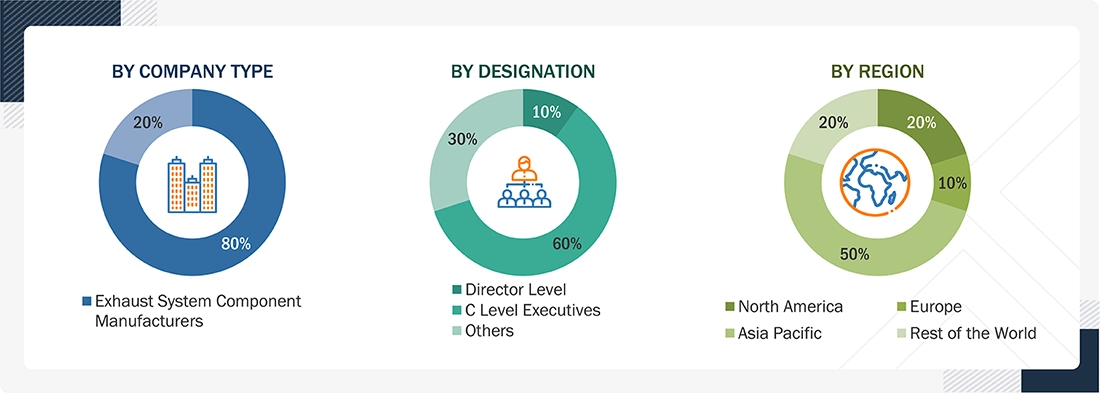
Note: Other designations include sales, marketing, and product managers.
Company tiers are based on the value chain; the revenue of the company is not considered.
To know about the assumptions considered for the study, download the pdf brochure
Market Size Estimation
A detailed market estimation approach was followed to estimate and validate the value and volume of the exhaust system market and other dependent submarkets, as mentioned below:
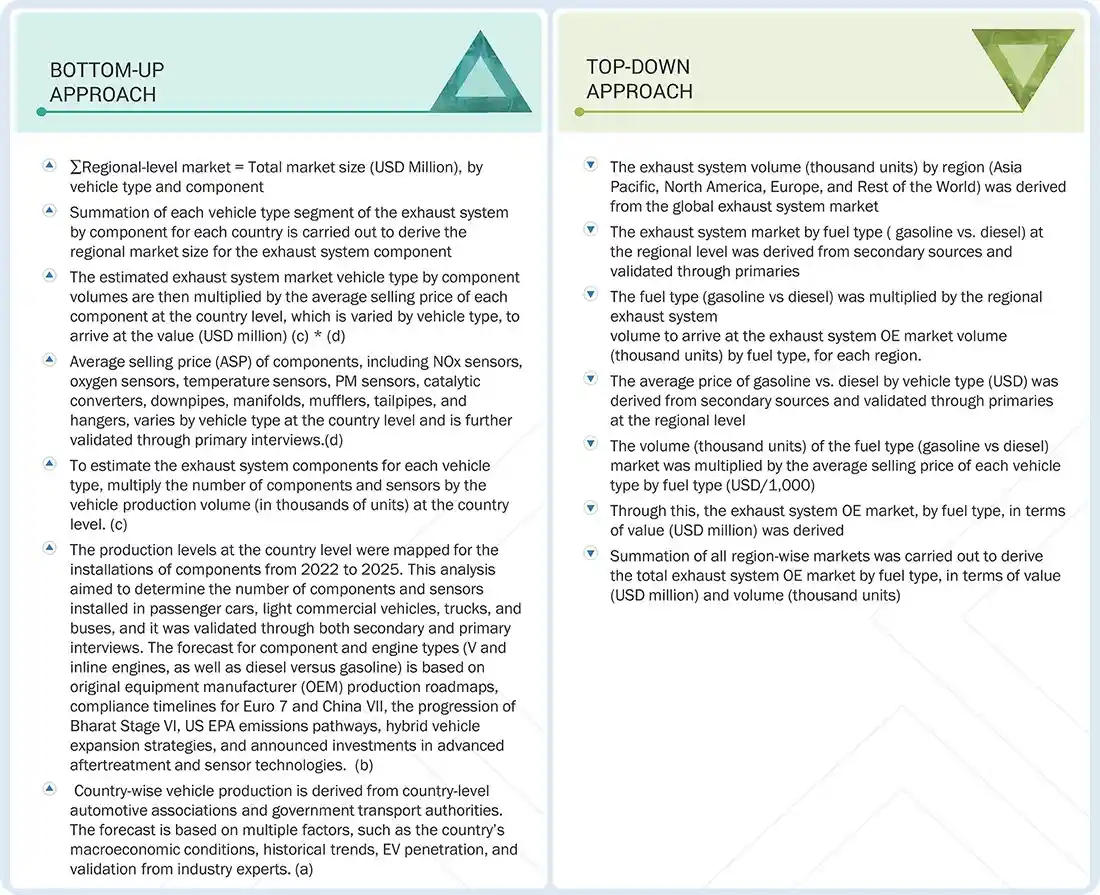
- The bottom-up approach was used to estimate and validate the size of the exhaust system market. The exhaust system market size by component, in terms of volume, was derived by multiplying the country-level fuel breakup of each vehicle type by the country-level production of each vehicle type (passenger cars, LCVs, trucks, and buses) (which was estimated using secondary research and then validated by primary interviews) for each vehicle type.
- The country-level exhaust system component market size, by volume, was multiplied by the country-level average OE component price (AOP) for each component and vehicle type to obtain the country-level component market by value.
- The summation of the country-level markets provides the regional level, and further addition yields the global exhaust system market by component (sensors, catalytic converters, downpipes, manifolds, mufflers, tailpipes, and hangers). The values for each country were summed to derive the total value of the exhaust systems market for after-treatment device components.
- The OE market size for exhaust system aftertreatment devices, including DOC, DPF, and SCR, was estimated using a bottom-up approach based on country and vehicle-type-level production data sourced from vehicle associations and secondary research. Fuel type share across vehicle segments was derived through model-level mapping, secondary research, and industry expert validation. Based on fuel type and country-specific emission regulations, aftertreatment device fitment and penetration were mapped across vehicle categories. Future estimates were developed using expected fuel-share trends, upcoming emission regulations, and aftertreatment adoption rates, while market value was calculated using OE fitment rates and average selling prices (ASPs) for aftertreatment devices.
- The aftermarket size of exhaust systems, by after-treatment devices—DOC, DPF, and SCR —by volume was derived by multiplying the regional-level parc of each vehicle type by the regional-level average miles driven for that type.
- The derived total miles driven at the regional level for each vehicle type were then multiplied by the regional-wise fuel share and the regional-level after-treatment devices penetration for each vehicle type. The estimated regional number of after-treatment devices was further divided by the regional-level average life of each after-treatment device for each vehicle type to analyze the aftermarket exhaust system by after-treatment device volume.
- The regional aftermarket size, by volume, was multiplied by the regional-level average selling price of each after-treatment device for each vehicle type, yielding the exhaust system aftermarket value by after-treatment device for each vehicle type.
- All key macro indicators affecting the revenue growth of the market segments and subsegments were accounted for, examined in detail, verified through primary research, and analyzed to obtain validated quantitative and qualitative data.
- The market data gathered was consolidated and added with detailed input, analyzed, and presented in this report.
Data Triangulation
After determining the global market's overall size using the above-mentioned methodology, the market was segmented into several segments and subsegments. Data triangulation and market breakdown procedures were employed to complete the overall market engineering process and arrive at the exact data for the market by volume and value for the key segments and subsegments, wherever applicable. The extrapolated market data was triangulated by studying various macro indicators and regional trends from both the OEM and exhaust system participants.
Market Definition
Exhaust Systems: The key components of an exhaust system are the exhaust manifold, downpipe, and tailpipe. Exhaust gases from the engine cylinders are collected and cooled by the exhaust manifold and then passed to the catalytic converter through the downpipe. The catalytic converter acts as an exhaust gas purifier, removing harmful constituents from the gases. The gases then travel through the muffler, which reduces noise, and finally exit through the tailpipe as cleansed exhaust gases.
After-treatment Devices: These devices remove harmful constituents such as carbon monoxide (CO), carbon dioxide (CO2), nitrogen oxides (NOX), and particulate matter (PM) from the exhaust gas. After-treatment devices considered in this study for diesel engines include a diesel particulate filter, a diesel oxidation catalyst, a lean NOx trap, and a selective catalytic converter. For gasoline engines, the device is a gasoline particulate filter (GPF).
Key Stakeholders
- Exhaust System Manufacturers
- Exhaust System Component Providers
- Automotive OEMs
- Emission Control Technology Providers
- Aftermarket Service Providers
- Industrial and End Use Organizations/Associations
- Regulatory Authorities
Report Objectives
- To define, describe, and forecast the size of the exhaust system market in terms of value (USD million/billion) and volume (thousand units) between 2026 and 2033 based on the following segments:
- OE market, by component (sensors, catalytic converters, downpipes, manifolds, mufflers, tailpipes, hangers)
- OE market, by vehicle type (passenger cars, LCVs, trucks, buses)
- OE market, by fuel type (gasoline, diesel)
- OE market, by aftertreatment device (DOC, DPF, LNT, SCR, GPF)
- Aftermarket, by aftertreatment device (DOC, DPF, SCR)
- By sales channel (OEM, aftermarket)
- OE market for off-highway vehicles, by equipment type (construction equipment, mining equipment, agricultural tractors)
- OE market for off-highway vehicles, by aftertreatment device (DOC, DPF, SCR)
- By region (Asia Pacific, Europe, North America, Rest of the World)
- To identify and analyze key drivers, restraints, opportunities, and challenges influencing the market
- To strategically profile key players and analyze their market share and core competencies
- To analyze recent developments, including product launches, deals, and expansions, by key market players
- To study the following with respect to the market
- Trends/Disruptions Impacting Customer Business
- Ecosystem Analysis
- Technology Analysis
- Supply Chain Analysis
- Patent Analysis
- Regulatory Landscape
- Case Study Analysis
- Key Stakeholders and Buying Criteria
- Key Conferences and Events
- Trade Analysis
- Pricing Analysis
- Impact of EU-FTA Trade Deal
- Impact of the Israel-Iran War
Available customizations:
MarketsandMarkets offers the following customizations for this market report:
-
exhaust system Market, By sensor type & vehicle type
- NOx Sensors
- Oxygen Sensors
- Temperature Sensors
- PM Sensors
Note: The after-treatment devices OE market can be offered for IC vehicle types - Passenger Cars, LCVs, Trucks, and Buses.
-
exhaust system Components OE market, By vehicle type
- Passenger Cars
- LCVs
- Trucks
- Buses
Note: The component (exhaust manifolds, downpipes, catalytic converters, mufflers, tailpipes, and sensors) OE market can be offered for IC vehicle types - Passenger Cars, LCVs, Trucks, and Buses at the regional level- North America, Europe, Asia Pacific, and Rest of the World.
-
Hybrid Vehicle Exhaust system OE market, By After-treatment device
- LNT
- GPF
Note: The hybrid vehicle (HEV & PHEV) exhaust system OE market can be offered by after-treatment devices - LNT and GPF. The off-highway vehicle (construction equipment and agricultural tractors) market can be offered by after-treatment devices - DOC, DPF, and SCR at the regional level - North America, Europe, Asia Pacific, and the Rest of the World.
-
Two & THREE-WHEELER vehicle exhaust system OE market, By region
- Asia Pacific
- Europe
- North America
- Rest of the World
Note: The exhaust system OE market can be offered at the regional level - North America, Europe, Asia Pacific, and the Rest of the World.
Frequently Asked Questions (FAQ):
What is the current size of the global exhaust system market?
The global exhaust system market is projected to grow from USD 32.9 billion in 2024 to USD 40.6 billion by 2030, at a CAGR of 3.6%.
Which after-treatment device is currently in the exhaust system market?
SCR is the leading after-treatment device in the exhaust system market.
Many companies operate in the exhaust system market across the globe. Do you know who the front leaders are and what strategies they have adopted?
Tenneco Inc.(US), Faurecia (France), Eberspächer (Germany), Friedrich Boysen GMBH & CO. KG (Germany), and BENTELER International (Austria). These companies adopted new product launches and expansion strategies to gain traction in the exhaust system market.
How does the demand for an exhaust system vary by region?
Asia Pacific is estimated to be the largest OE market for exhaust systems and after-treatment devices during the forecast period, followed by Europe. The growth of the exhaust system market in Asia Pacific is mainly attributed to the increasing vehicle production and constant upgrades in emission norms, especially in countries such as China, Japan, and India.
What are the growth opportunities for the exhaust system supplier?
Lightweight emission systems, growing demand for gasoline particulate filters (GPF) in GDI engines, and advanced exhaust heat recovery systems are expected to offer promising future growth in the market for exhaust systems. .
To speak to our analyst for a discussion on the above findings, click Speak to Analyst
Personalize This Research
- Triangulate with your Own Data
- Get Data as per your Format and Definition
- Gain a Deeper Dive on a Specific Application, Geography, Customer or Competitor
- Any level of Personalization
Let Us Help You
- What are the Known and Unknown Adjacencies Impacting the Exhaust System Market
- What will your New Revenue Sources be?
- Who will be your Top Customer; what will make them switch?
- Defend your Market Share or Win Competitors
- Get a Scorecard for Target Partners


JIM NAAS
PRODUCT DIRECTOR, WEASLER
Weasler Engineering, a CentroMotion organization
Global Provider of Industrial Actuation & Control Solutions
Our organization was interested in learning more about the attractiveness of a particular market space. We contacted MarketsandMarkets to help us based on previous positive experiences we had with them. The results did not disappoint! We discussed our objectives with them, and the team at MarketsandMarkets developed and executed a proposal that met our needs precisely. We were very impressed by their level of expertise, the quality of the analysis and their insightful recommendations. We would not hesitate in working with them again in the future.

Matt Kardel,
Vice President
Aptiv,
A global technology company that develops safer, greener and more connected solutions.
We contracted with MarketsandMarkets to evaluate the value chain and potential go-to-market partners related to our interest in the Fleet Management space. The team successfully completed the work on time and at the pricing agreed. MarketsandMarkets listened and understood our objectives and collaborated well with us to help us get the visibility we needed to make an investment.
We have subsequently used MarketsandMarkets again related to Smart Cities to good results.
Previous Next
