








- DESCRIPTION
- TABLE OF CONTENTS
- METHODOLOGY
- DOWNLOAD PDF
Floating Offshore Wind Market by Turbine Rating (Up to 5 MW, 5-10 MW, 11-15 MW, Above 15 MW), Floating Platform (Semi-submersible, Spar-buoy, Tension-leg, Barge & Hybrid), Component, Depth, & Region - Global Forecast to 2031

USD 25.40 BN
MARKET SIZE, 2031

CAGR 51.7%
(2026-2031)

375
REPORT PAGES

150
MARKET TABLES
OVERVIEW
Source: Secondary Research, Interviews with Experts, MarketsandMarkets Analysis
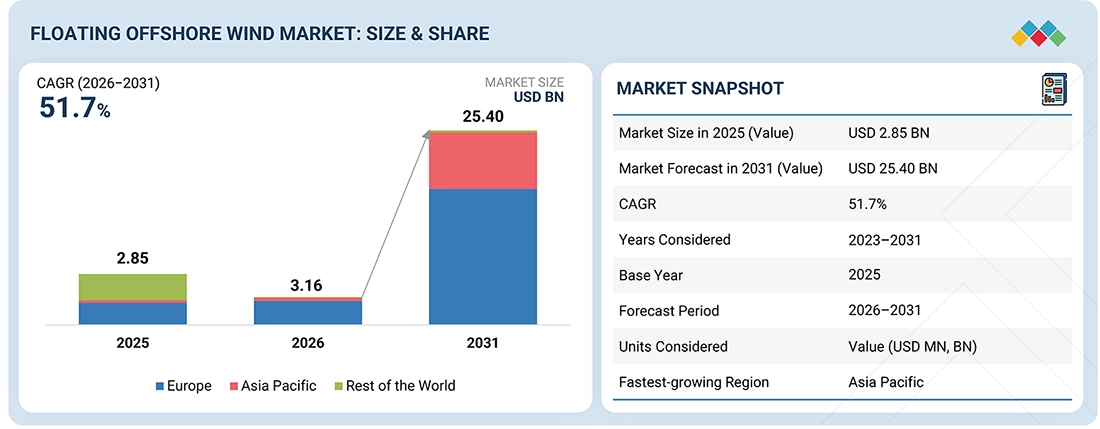
The global floating offshore wind market size is projected to reach USD 25.40 billion by 2031, growing from USD 3.16 billion in 2026 at a CAGR of 51.7% during the forecast period. This rapid growth trajectory is primarily driven by the increasing need to harness wind resources in deep-water locations where fixed-bottom installations are not feasible, particularly across Europe and the Asia Pacific.
KEY TAKEAWAYS
-
BY REGION
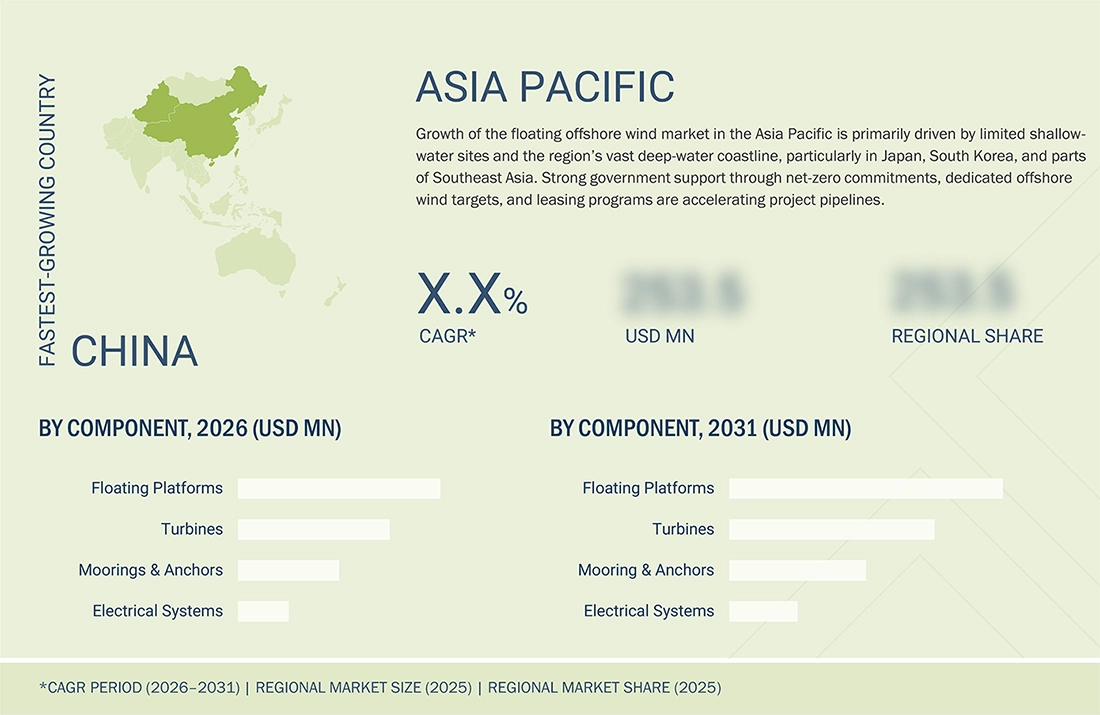
The Asia Pacific is the fastest-growing region, registering a CAGR of 76.7% during the forecast period.
-
BY TURBINE RATING
The 5–10 MW segment held the largest market share of 49.29% in 2025.
-
BY FLOATING PLATFORM
The semi-submersible segment dominated the market, accounting for a share of 90.0% in 2025.
-
BY COMPONENT
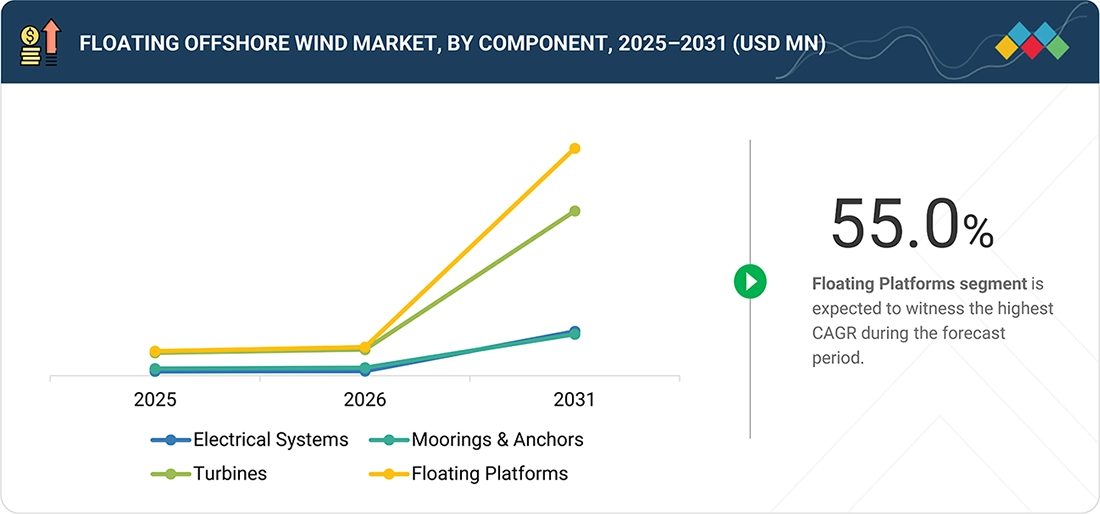
The Floating Platform segment is expected to register the fastest growth during the forecast period.
-
BY DEPTH
The above 60 M segment is expected to dominate the market during the forecast period
-
COMPETITIVE LANDSCAPE
Key players in the global floating offshore wind market, such as GE Vernova (US), Siemens Gamesa Renewable Energy (Spain), Vestas Wind System A/S (Denmark), and Mingyang Smart Energy Group Co., Ltd (China), have employed various strategies to increase their market presence in the global floating offshore wind market.
-
COMPETITIVE LANDSCAPE
The strong product ecosystem and global market penetration of SeaTwirl (Sweden) and Floatin Power Plant A/S (Denmark) have made them influential SMEs/emerging leaders in the market.
Strong policy support, including government-backed leasing rounds, decarbonization targets, and financial incentives, is accelerating project pipelines and investor confidence. Additionally, ongoing technological advancements in floating platform designs and turbine scaling are reducing levelized costs, making projects more commercially viable. The market is also benefiting from strategic collaborations between energy majors, utilities, and technology providers, which are facilitating large-scale deployments and strengthening the overall supply chain ecosystem.
TRENDS & DISRUPTIONS IMPACTING CUSTOMERS' CUSTOMERS
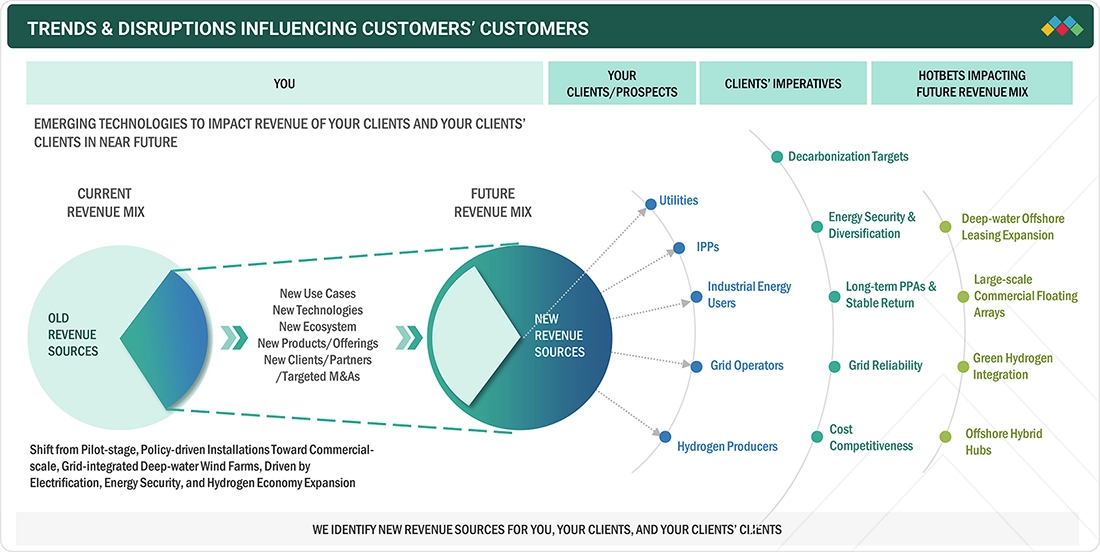
The influence of customer businesses in the floating offshore wind market is driven by trends in the structural energy transition, changes in regulatory frameworks, the growth of electrification, and the expansion of offshore infrastructure. These interferences affect the distribution of revenue among utilities, independent power producers (IPPs), industrial energy users, and grid operators. Their modification of investment priorities directly impacts project pipelines, capital allocation, and revenue visibility for both floating offshore wind developers and technology providers. The end-user strategies are being modified due to increased deep-water offshore leasing, decarbonization requirements, rising electricity demand, increased hydrogen production, and energy security issues. Floating offshore wind will be an effective asset class rather than a niche technology as utilities and industrial buyers increase their procurement of long-term renewable energy under PPAs and CFDs. The revenue effect on ultimate users, utilities and corporate offtakers, in turn, results in new revenue streams and investment flows to floating wind project developers, platform manufacturers, turbine suppliers, and offshore EPC contractors. The shift to the offshore wind projects of deep water in floating projects and to shallow water offshore in fixed bottom wind is also changing the revenue base of marine engineering companies, port operators, and transmission system operators (TSOs). Dialectrically more grid modernization, coordination of offshore transmission, and hybrid offshore hubs bring more value opportunities down the line. Consequently, floating offshore wind producers and developers need to be responsive to changing customer requirements, such as lower costs, project scalability, local-content demand, and long-term asset performance optimization.
Source: Secondary Research, Interviews with Experts, MarketsandMarkets Analysis
MARKET DYNAMICS

Drivers
Impact
Level
-
Access to deep-water, high-quality wind resources

-
National energy security and decarbonization targets


RESTRAINTS
Impact
Level
-
High capital expenditure compared to fixed-bottom offshore wind

-
High costs resulting from technical complexities


OPPORTUNITIES
Impact
Level
-
Large untapped markets in the Asia Pacific

-
First-mover advantage for developers and suppliers


CHALLENGES
Impact
Level
-
Port readiness and logistical execution at scale

-
Grid integration and offshore transmission coordination

Source: Secondary Research, Interviews with Experts, MarketsandMarkets Analysis
Floating offshore wind energy is primarily developed because many of the world's strongest offshore wind resources are located in waters that are too deep for traditional fixed-bottom foundations. Technologies like monopiles, jackets, and gravity bases have become increasingly complex and costly in water depths exceeding approximately 60 meters. In regions with high wind potential, such as the North Sea, the East China Sea, and parts of the Pacific, seafloor depth can increase rapidly over short distances offshore. Floating foundations, which use buoyant platforms and mooring systems rather than anchoring to the seabed, overcome this challenge and enable turbines to be installed in deeper waters, where wind speeds are higher than near the shore.
High capital expenditure remains one of the most significant restraints limiting the near-term scale-up of floating offshore wind compared to fixed-bottom offshore wind. Floating projects require additional and more complex infrastructure, including floating foundations (such as spar, semi-submersible, or tension-leg platforms), mooring and anchoring systems, and dynamic inter-array and export cables designed to withstand continuous motion. These components add substantial material, engineering, and installation costs that are not incurred in conventional fixed-bottom projects, where foundations and cables are static, and installation processes are more standardized.
The Asia Pacific region represents one of the most significant long-term growth opportunities for floating offshore wind due to its unique seabed and coastal characteristics. Countries such as Japan and South Korea have steep continental shelves, where water depths exceed 50–60 meters within a few kilometers from shore. These conditions severely limit the scalability of fixed-bottom offshore wind, which typically becomes uneconomical beyond depths of 50 meters. Floating offshore wind eliminates this constraint, enabling access to vast wind resources farther offshore and opening the potential for multi-gigawatt development that is otherwise inaccessible with conventional technologies.
Port readiness remains one of the most critical structural challenges for the global market because floating projects depend on onshore integration and wet towing of fully assembled units, unlike fixed-bottom offshore wind. Floating platforms are typically assembled with turbines, towers, and major electrical components already installed at port, requiring deep-draft access, long uninterrupted quays, high bearing capacity, and large contiguous laydown areas. However, most existing commercial and offshore wind ports were designed for smaller vessels, container handling, or fixed-bottom wind components, making them technically unsuitable for floating wind assembly at scale.
FLOATING OFFSHORE WIND MARKET: COMMERCIAL USE CASES ACROSS INDUSTRIES
| COMPANY | USE CASE DESCRIPTION | BENEFITS |
|---|---|---|
|
|
Equinor developed the Hywind Scotland project, the world’s first commercial-scale floating offshore wind farm, located off the coast of Scotland. The project utilizes spar-type floating foundations to support multi-megawatt wind turbines in deep-water conditions exceeding 100 meters, with electricity transmitted to the UK grid via subsea cables. The project was implemented to overcome the limitations of fixed-bottom offshore wind technologies in deep-water environments, where seabed conditions, water depth, and installation complexity pose significant challenges. Advanced mooring systems and real-time monitoring technologies were integrated to ensure structural stability and optimize operational performance. | The project demonstrated the technical and commercial viability of floating offshore wind technology, achieving high capacity factors and stable energy generation in deep-water conditions. It validated spar-buoy floating foundations as a scalable solution, strengthened investor confidence, and supported policy development for future leasing rounds. Additionally, it enabled cost reduction pathways and de-risked floating wind deployment, accelerating the transition toward large-scale commercial projects globally. |
|
|
Principle Power deployed the WindFloat Atlantic project off the coast of Portugal, utilizing its proprietary semi-submersible floating platform technology. The project features large offshore wind turbines mounted on triangular semi-submersible structures designed to provide stability in deep-water conditions. These platforms are assembled onshore and towed to the installation site, eliminating the need for heavy-lift vessels and enabling more efficient deployment. The design incorporates three-column structures connected by bracing systems to withstand harsh marine environments, including strong wave action, wind loads, and dynamic cable stresses, while maintaining optimal turbine performance. | The project significantly improved the technical and economic feasibility of floating offshore wind by enhancing platform stability and scalability. It reduced offshore construction risks through port-based assembly and simplified installation logistics, while increasing flexibility in deployment. Additionally, it demonstrated compatibility with existing port infrastructure and supported cost reduction through industrialized manufacturing approaches, thereby accelerating the pathway toward commercial-scale floating wind development. |


Logos and trademarks shown above are the property of their respective owners. Their use here is for informational and illustrative purposes only.
MARKET ECOSYSTEM
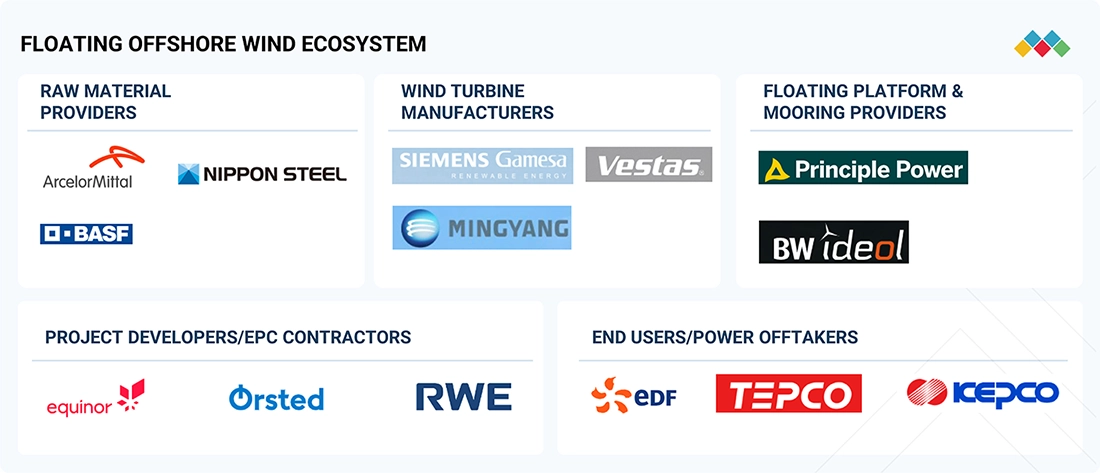
The key stakeholders involved in the global floating offshore wind market include raw material providers, wind turbine manufacturers, floating platform and mooring providers, project developers/EPC contractors, and end users/power offtakers.
Logos and trademarks shown above are the property of their respective owners. Their use here is for informational and illustrative purposes only.
MARKET SEGMENTS
Source: Secondary Research, Interviews with Experts, MarketsandMarkets Analysis
The 5–10 MW turbine rating segment held the largest market share in 2025, primarily because it represents the most commercially mature and widely deployed capacity range in existing floating offshore wind projects. Developers favor this range due to its proven reliability, established supply chain, and compatibility with current floating platform designs, which reduces technical and financial risks. Many early-stage and pilot projects, particularly in Europe, have standardized around this turbine size, enabling faster deployment and easier financing. Additionally, port infrastructure, installation vessels, and grid connection systems are currently better suited to handle turbines within this range, making it the most practical and scalable option during the early commercialization phase of the floating offshore wind market.
Semi-submersible platforms held the largest market share in 2025 primarily due to their superior stability, design flexibility, and commercial readiness compared to other floating concepts. These platforms can support large turbines while maintaining stability in varying sea conditions, making them suitable across a wide range of water depths and geographies. Additionally, semi-submersible platforms can be fully assembled at port and towed to the site, reducing reliance on specialized installation vessels and lowering deployment costs. Their compatibility with existing shipbuilding infrastructure and established supply chains further accelerates project timelines. Moreover, most early-stage floating wind projects have adopted semi-submersible designs, creating a first-mover advantage and reinforcing their dominance in the current market landscape.
Floating platforms held the largest market share by component in 2025, primarily because they represent the core structural and cost-intensive element of a floating offshore wind system. These platforms—such as semi-submersible, spar, and TLP designs—are essential for deploying turbines in deep-water environments, making them indispensable to every project. Their fabrication involves significant material inputs (steel or concrete), complex engineering, and specialized manufacturing processes, which account for a substantial share of overall project CAPEX. Additionally, the early-stage nature of the market means a strong focus on platform design optimization, pilot deployments, and scaling manufacturing capabilities, further concentrating investment in this component. As developers prioritize stability, durability, and cost-efficiency in harsh offshore conditions, continuous innovation and customization in floating platforms reinforce their dominant share in the value chain.
The above 60 M depth segment held the largest market share in 2025 because floating offshore wind is specifically designed to unlock wind resources in deep-water areas where fixed-bottom turbines are not technically or economically viable. A significant portion of global offshore wind potential—particularly in regions such as Japan, Norway and the West Coast—lies in waters deeper than 60 meters, making this segment the primary focus for deployment. Additionally, shallow-water sites in mature markets are becoming saturated, pushing developers toward deeper sites with stronger, more consistent wind speeds, which improve energy yield and project economics. Supported by government leasing of deep-water zones and advancements in floating foundation technologies, this segment naturally dominates as the core application area of floating offshore wind projects.
REGION
Asia Pacific is expected to register the highest CAGR during the forecast period
Asia Pacific is projected to be the fastest-growing region in the floating offshore wind market, primarily due to its vast untapped deep-water wind potential and increasing policy-driven momentum toward clean energy transition. Countries such as Japan and China are actively promoting floating offshore wind through dedicated targets, favorable regulatory frameworks, and large-scale leasing programs, recognizing its strategic role in achieving net-zero emissions. The region also faces rising electricity demand and energy security concerns, prompting governments to reduce their dependence on imported fossil fuels by investing in domestic renewable energy capacity. Additionally, strong participation from global developers, coupled with partnerships with local utilities and shipbuilding industries, is accelerating project execution and supply chain development. Continuous technological transfer from Europe and increasing capital inflows from both public and private sectors further position the Asia Pacific as a high-growth hub for floating offshore wind deployment.
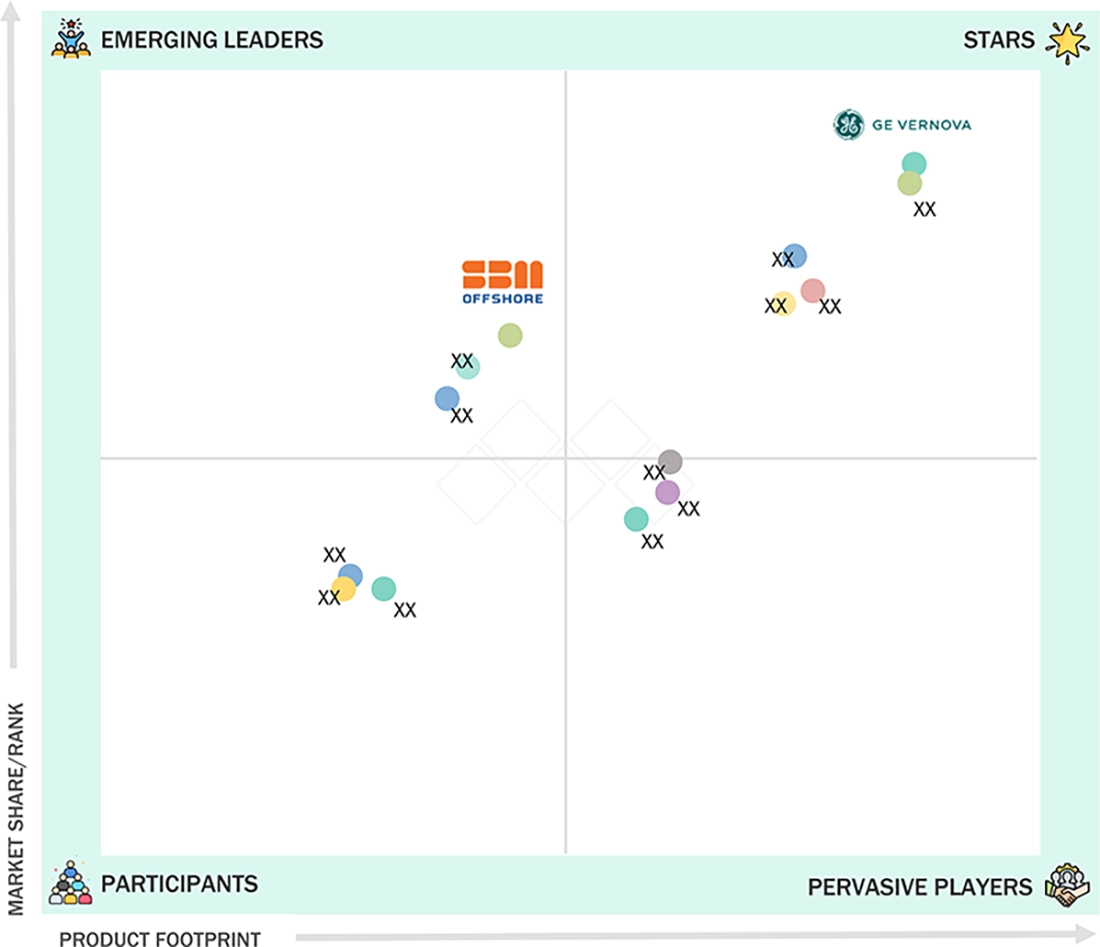
FLOATING OFFSHORE WIND MARKET: COMPANY EVALUATION MATRIX
GE Vernova is leading the floating offshore market and is classified under the “Stars” category due to its strong product portfolio. Vendors in the “stars” category generally receive high scores for most evaluation criteria. These players have established product portfolios and a broad market presence. They also devise effective business strategies.
Source: Secondary Research, Interviews with Experts, MarketsandMarkets Analysis
KEY MARKET PLAYERS
- GE Vernova (US)
- Siemens Gamesa Renewable Energy (Spain)
- Vestas Wind Systems A/S (Denmark)
- Mingyang Smart Energy Group Co., Ltd. (China)
- Goldwind (China)
- BW Ideol (France)
- Principle Power (US)
- SBM Offshore (Netherlands)
- Saipem SpA (Italy)
- Aker Solutions (Norway)
- X1 Wind (Spain)
- Hexicon AB (Sweden)
- Shanghai Electric (China)
- HD Hyundai Heavy Industries (South Korea)
- Japan Marine United Corporation (Japan)
- Saitec Offshore (Spain)
- Doosan Enerbility (South Korea)
- Stiesdal (Denmark)
- Dongfang Electric (China)
- Envision Group (China)
- CS Wind (South Korea)
- Seatrium (Singapore)
- Technip Energies (France)
- NOV (US)
- Gazelle Wind Power (Portugal)
- GICON-GROßMANN INGENIEUR CONSULT GMBH (Germany)
MARKET SCOPE
| REPORT METRIC | DETAILS |
|---|---|
| Market Size in 2025 (Value) | USD 2.85 Billion |
| Market Forecast in 2031 (Value) | USD 25.40 Billion |
| Growth Rate | 51.7% |
| Years Considered | 2023–2031 |
| Base Year | 2025 |
| Forecast Period | 2026–2031 |
| Units Considered | Value (USD Million) |
| Report Coverage | Revenue Forecast, Company Ranking, Competitive Landscape, Growth Factors, and Trends |
| Segments Covered |
|
| Regions Covered | Europe, Asia Pacific, Rest of the World |
WHAT IS IN IT FOR YOU: FLOATING OFFSHORE WIND MARKET REPORT CONTENT GUIDE
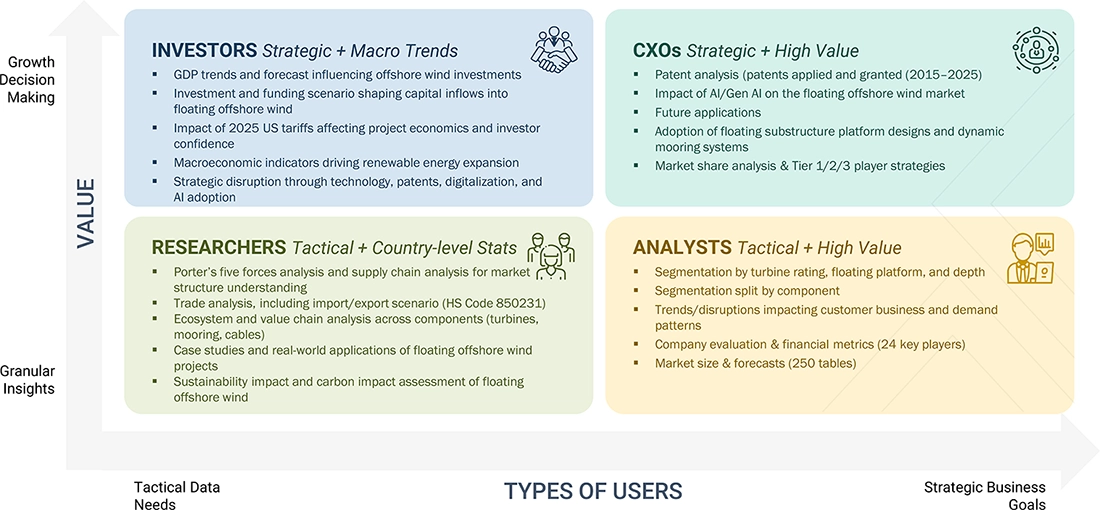
DELIVERED CUSTOMIZATIONS
We have successfully delivered the following deep-dive customizations:
| CLIENT REQUEST | CUSTOMIZATION DELIVERED | VALUE ADDS |
|---|---|---|
| Global Floating Offshore Wind Market | Competitive landscape analysis with focus on strategic moves by key players |
|
RECENT DEVELOPMENTS
- February 2026 : Vestas signed a contract with RWE in which the company received a firm 1.38 GW order from RWE for the Vanguard West offshore wind project in the UK, covering supply, delivery, commissioning of 92 V236-15.0 MW turbines, along with a five-year service agreement and long-term operational support.
- January 2026 : Envision Group signed a contract with REE Group to supply 16 EN-226/8.X MW offshore wind turbines for a 128 MW nearshore wind cluster in Vinh Long Province, marking Southeast Asia's largest single-turbine-capacity nearshore wind project under Vietnam’s PDP VIII.
- January 2026 : BW Ideol and Holcim entered into a partnership to scale up the construction of offshore wind infrastructure. The two companies form a strategic partnership for the supply of innovative materials to two fabrication lines for floating foundations, developed by BW Ideol in Southern France and Northeast Scotland.
Table of Contents
 Exclusive indicates content/data unique to MarketsandMarkets and not available with any competitors.
TITLE
PAGE NO
1
INTRODUCTION
27
2
EXECUTIVE SUMMARY
32
3
PREMIUM INSIGHTS
38
4
MARKET OVERVIEW
42
4.1
INTRODUCTION
4.2
MARKET DYNAMICS
4.2.1
DRIVERS
4.2.1.1
ACCESS TO DEEP-WATER, HIGH-QUALITY WIND RESOURCES
4.2.1.2
NATIONAL ENERGY SECURITY AND DECARBONIZATION TARGETS
4.2.1.3
RAPID TECHNOLOGICAL MATURATION OF FLOATING PLATFORMS
4.2.2
RESTRAINTS
4.2.2.1
HIGH CAPITAL EXPENDITURE COMPARED TO FIXED-BOTTOM OFFSHORE WIND
4.2.3
OPPORTUNITIES
4.2.3.1
LARGE UNTAPPED MARKETS IN ASIA PACIFIC
4.2.3.2
FIRST-MOVER ADVANTAGE FOR DEVELOPERS AND SUPPLIERS
4.2.4
CHALLENGES
4.2.4.1
PORT READINESS AND LOGISTICAL EXECUTION AT SCALE
4.2.4.2
GRID INTEGRATION AND OFFSHORE TRANSMISSION COORDINATION
4.3
UNMET NEEDS AND WHITE SPACES
4.4
INTERCONNECTED MARKETS AND CROSS-SECTOR OPPORTUNITIES
4.5
EMERGING BUSINESS MODELS AND ECOSYSTEM SHIFTS
4.6
STRATEGIC MOVES BY TIER-1/2/3 PLAYERS
5
INDUSTRY TRENDS
56
5.1
PORTER’S FIVE FORCES ANALYSIS
5.1.1
INTENSITY OF COMPETITIVE RIVALRY
5.1.2
THREAT OF NEW ENTRANTS
5.1.3
BARGAINING POWER OF SUPPLIERS
5.1.4
BARGAINING POWER OF BUYERS
5.1.5
THREAT OF SUBSTITUTES
5.2
MACROECONOMIC OUTLOOK
5.2.1
INTRODUCTION
5.2.2
GDP TRENDS AND FORECAST
5.2.3
TRENDS IN OVERALL FLOATING OFFSHORE WIND MARKET
5.3
SUPPLY CHAIN ANALYSIS
5.4
ECOSYSTEM ANALYSIS
5.5
PRICING ANALYSIS
5.6
TRADE ANALYSIS
5.6.1
IMPORT SCENARIO (HS CODE 850231)
5.6.2
EXPORT SCENARIO (HS CODE 850231)
5.7
KEY CONFERENCES AND EVENTS, 2025–2026
5.8
TRENDS/DISRUPTIONS IMPACTING CUSTOMER BUSINESS
5.9
CASE STUDY ANALYSIS
5.9.1
EQUINOR’S HYWIND SCOTLAND DEMONSTRATES COMMERCIAL VIABILITY OF FLOATING OFFSHORE WIND
5.9.2
WINDFLOAT ATLANTIC ENABLES SEMI-SUBMERSIBLE FLOATING WIND DEPLOYMENT
5.9.3
HYWIND TAMPEN POWERS OFFSHORE OIL & GAS PLATFORMS WITH FLOATING WIND
5.10
IMPACT OF 2025 US TARIFF - FLOATING OFFSHORE WIND MARKET
5.10.1
INTRODUCTION
5.10.2
KEY TARIFF RATES
5.10.3
PRICE IMPACT ANALYSIS
5.10.4
IMPACT ON COUNTRIES/REGIONS
5.10.4.1
US
5.10.4.2
EUROPE
5.10.4.3
ASIA PACIFIC
6
TECHNOLOGICAL ADVANCEMENTS, AI-DRIVEN IMPACT, PATENTS, INNOVATIONS, AND FUTURE APPLICATIONS
77
6.1
KEY EMERGING TECHNOLOGIES
6.1.1
FLOATING SUBSTRUCTURE PLATFORM DESIGNS
6.1.2
DYNAMIC MOORING AND ANCHORING SYSTEMS
6.2
COMPLEMENTARY TECHNOLOGIES
6.2.1
DYNAMIC SUBSEA CABLE SYSTEMS
6.2.2
FLOATING SUBSTATIONS AND HVDC TRANSMISSION
6.3
ADJACENT TECHNOLOGIES
6.3.1
GREEN HYDROGEN INTEGRATION
6.3.2
OFFSHORE ENERGY STORAGE AND HYBRID RENEWABLE SYSTEMS
6.4
TECHNOLOGY/PRODUCT ROADMAP
6.4.1
SHORT-TERM (2025-2027) | COST OPTIMIZATION & PRE-COMMERCIAL SCALING
6.4.2
MID-TERM (2027-2030) | GRID MODERNIZATION & SYSTEM INTEGRATION
6.4.3
LONG-TERM (2030-2035+) | AUTONOMOUS, GRID-INTERACTIVE PROTECTION
6.5
PATENT ANALYSIS
6.6
FUTURE APPLICATIONS
6.7
IMPACT OF AI/GEN AI ON FLOATING OFFSHORE WIND MARKET
6.7.1
TOP USE CASES AND MARKET POTENTIAL
6.7.2
BEST PRACTICES FOLLOWED BY OEMS IN FLOATING OFFSHORE WIND MARKET
6.7.3
CASE STUDIES RELATED TO AI IMPLEMENTATION IN FLOATING OFFSHORE WIND MARKET
6.7.4
INTERCONNECTED ECOSYSTEM AND IMPACT ON MARKET PLAYERS
6.7.5
CLIENTS’ READINESS TO ADOPT GEN AI/AI-INTEGRATED FLOATING OFFSHORE WIND TURBINES
7
REGULATORY LANDSCAPE AND SUSTAINABILITY INITIATIVES
88
7.1
REGIONAL REGULATIONS AND COMPLIANCE
7.1.1
REGULATORY BODIES, GOVERNMENT AGENCIES, AND OTHER ORGANIZATIONS
7.1.2
INDUSTRY STANDARDS
7.2
SUSTAINABILITY INITIATIVES
7.2.1
CARBON IMPACT AND ECO-APPLICATIONS OF FLOATING OFFSHORE WIND
7.3
IMPACT OF REGULATORY POLICY ON SUSTAINABILITY INITIATIVES
7.4
CERTIFICATIONS, LABELING, AND ECO-STANDARDS
8
CUSTOMER LANDSCAPE AND BUYER BEHAVIOR
93
8.1
DECISION-MAKING PROCESS
8.2
KEY STAKEHOLDERS INVOLVED IN BUYING PROCESS AND THEIR EVALUATION CRITERIA
8.2.1
KEY STAKEHOLDERS IN BUYING PROCESS
8.2.2
BUYING CRITERIA
8.3
ADOPTION BARRIERS AND INTERNAL CHALLENGES
8.4
MARKET PROFITABILITY
9
FLOATING OFFSHORE WIND MARKET, BY TURBINE RATING
97
9.1
INTRODUCTION
9.2
UP TO 5 MW
9.2.1
USED IN PILOT PROJECTS AND DEMONSTRATION FARMS TO TEST FLOATING WIND TECHNOLOGIES
9.3
5–10 MW
9.3.1
WELL-SUITED FOR COMMERCIAL FLOATING WIND FARMS
9.4
11–15 MW
9.4.1
USAGE IN MID- TO LARGE-SCALE FLOATING WIND PROJECTS TO DRIVE ADOPTION
9.5
ABOVE 15 MW
9.5.1
PLATFORM INNOVATION AND SUPPLY CHAIN MATURITY TO DRIVE MARKET
10
FLOATING OFFSHORE WIND MARKET, BY FLOATING PLATFORM
104
10.1
INTRODUCTION
10.2
SEMI-SUBMERSIBLE
10.2.1
PROVIDE SUPPORT FOR TURBINES IN DEEP-WATER OFFSHORE WIND PROJECTS
10.3
SPAR-BUOY
10.3.1
PROVIDES UNMATCHED STABILITY IN ULTRA-DEEP OFFSHORE WATERS
10.4
TENSION–LEG
10.4.1
TENSION-LEG PLATFORMS PROVIDE EXCEPTIONAL VERTICAL STABILITY FOR DEEP-WATER TURBINES
10.5
BARGE & HYBRID
10.5.1
ADVANCES IN MATERIALS AND HYDRODYNAMIC DESIGN IMPROVE STABILITY, EFFICIENCY, AND COST-EFFECTIVENESS
11
FLOATING OFFSHORE WIND MARKET, BY COMPONENT
111
11.1
INTRODUCTION
11.2
TURBINES
11.2.1
UP TO 5 MW TURBINES USED IN PILOT PROJECTS AND DEMONSTRATION FARMS TO TEST FLOATING WIND TECHNOLOGIES
11.3
FLOATING PLATFORMS
11.3.1
BACKBONE OF DEEP-WATER WIND ENERGY DEPLOYMENT
11.4
MOORINGS & ANCHORS
11.4.1
KEEP FLOATING PLATFORMS STABLE IN DEEP WATERS
11.5
ELECTRICAL SYSTEMS
11.5.1
ENABLE RELIABLE POWER TRANSMISSION FROM TURBINES TO SHORE
12
FLOATING OFFSHORE WIND MARKET, BY DEPTH
119
12.1
INTRODUCTION
12.2
UP TO 30 M
12.2.1
LOWER COST AND WELL-ESTABLISHED SUPPLY CHAIN TO DRIVE MARKET
12.3
30–60 M
12.3.1
MODERATE WATER DEPTHS ENABLE EARLY COMMERCIAL ADOPTION OF FLOATING WIND PROJECTS
12.4
ABOVE 60 M
12.4.1
HIGH ENERGY POTENTIAL AND LIMITED COMPETITION FOR NEARSHORE SITES TO PROPEL MARKET
13
FLOATING OFFSHORE WIND MARKET, BY REGION
125
13.1
INTRODUCTION
13.2
ASIA PACIFIC
13.2.1
BY TURBINE RATING
13.2.2
BY FLOATING PLATFORM
13.2.3
BY COMPONENT
13.2.4
BY DEPTH
13.2.5
BY COUNTRY
13.2.5.1
CHINA
13.2.5.1.1
DEEP-WATER EXPANSION AND LARGE-SCALE TARGETS TO DRIVE MARKET
13.2.5.2
SOUTH KOREA
13.2.5.2.1
TECHNOLOGICAL ADVANCEMENTS TO PROPEL MARKET
13.2.5.3
TAIWAN
13.2.5.3.1
SHALLOW-WATER SATURATION AND DEEP-WATER TRANSITION TO DRIVE MARKET
13.2.5.4
PHILIPPINES
13.2.5.4.1
DEEP-WATER RESOURCE POTENTIAL AND EMERGING PROJECT PIPELINE TO DRIVE MARKET
13.2.5.5
REST OF ASIA PACIFIC
13.3
EUROPE
13.3.1
BY TURBINE RATING
13.3.2
BY FLOATING PLATFORM
13.3.3
BY COMPONENT
13.3.4
BY DEPTH
13.3.5
BY COUNTRY
13.3.5.1
NORWAY
13.3.5.1.1
STRONG OFFSHORE ENGINEERING EXPERTISE AND MARITIME CAPABILITIES TO SUPPORT MARKET GROWTH
13.3.5.2
UK
13.3.5.2.1
FAVORABLE GOVERNMENT POLICIES TO PROPEL MARKET
13.3.5.3
FRANCE
13.3.5.3.1
WELL-ESTABLISHED OFFSHORE ENGINEERING AND SHIPBUILDING SECTOR TO SUPPORT MARKET GROWTH
13.3.5.4
SWEDEN
13.3.5.4.1
STRONG MARITIME ENGINEERING SECTOR AND OFFSHORE ENERGY EXPERTISE TO PROPEL MARKET
13.3.5.5
ITALY
13.3.5.5.1
GOVERNMENT POLICIES ALIGNED WITH EU RENEWABLE ENERGY TARGETS TO DRIVE MARKET
13.3.5.6
REST OF EUROPE
13.4
REST OF THE WORLD
13.4.1
BY TURBINE RATING
13.4.2
BY FLOATING PLATFORM
13.4.3
BY COMPONENT
13.4.4
BY DEPTH
13.4.5
BY REGION
13.4.5.1
NORTH AMERICA
13.4.5.1.1
GOVERNMENT-BACKED LEASING PROGRAMS TO DRIVE MARKET
13.4.5.2
SOUTH AMERICA
13.4.5.2.1
EXCELLENT OFFSHORE WIND RESOURCES AND ESTABLISHED OFFSHORE OIL & GAS EXPERTISE TO PROPEL MARKET
13.4.5.3
MIDDLE EAST & AFRICA
13.4.5.3.1
UNDERDEVELOPED MARKET WITH STRATEGIC POTENTIAL IN ENERGY DIVERSIFICATION—KEY FACTOR DRIVING MARKET GROWTH
14
COMPETITIVE LANDSCAPE
156
14.1
OVERVIEW
14.2
KEY PLAYER STRATEGIES/RIGHT TO WIN, 2021-2026
14.3
MARKET RANKING
14.4
REVENUE ANALYSIS, 2021-2025
14.5
COMPANY EVALUATION MATRIX: KEY PLAYERS, 2025
14.5.1
STARS
14.5.2
EMERGING LEADERS
14.5.3
PERVASIVE PLAYERS
14.5.4
PARTICIPANTS
14.5.5
COMPANY FOOTPRINT: KEY PLAYERS, 2025
14.5.5.1
COMPANY FOOTPRINT
14.5.5.2
TURBINE RATING FOOTPRINT
14.5.5.3
COMPONENT FOOTPRINT
14.5.5.4
REGION FOOTPRINT
14.6
COMPANY EVALUATION MATRIX: STARTUPS/SMES, 2025
14.6.1
PROGRESSIVE COMPANIES
14.6.2
RESPONSIVE COMPANIES
14.6.3
DYNAMIC COMPANIES
14.6.4
STARTING BLOCKS
14.6.5
COMPETITIVE BENCHMARKING: STARTUPS/SMES, 2025
14.6.5.1
DETAILED LIST OF STARTUPS/SMES
14.6.5.2
COMPETITIVE BENCHMARKING OF KEY STARTUPS/SMES
14.7
COMPANY VALUATION AND FINANCIAL METRICS
14.8
BRAND/PRODUCT COMPARISON
14.9
COMPETITIVE SCENARIO
14.9.1
PRODUCT LAUNCHES
14.9.2
DEALS
14.9.3
EXPANSIONS
14.9.4
OTHER DEVELOPMENTS
15
COMPANY PROFILES
181
15.1
KEY PLAYERS
15.1.1
GE VERNOVA
15.1.1.1
BUSINESS OVERVIEW
15.1.1.2
PRODUCTS/SOLUTIONS/SERVICES OFFERED
15.1.1.3
RECENT DEVELOPMENTS
15.1.1.3.1
PRODUCT LAUNCHES
15.1.1.3.2
DEALS
15.1.1.3.3
EXPANSIONS
15.1.1.4
MNM VIEW
15.1.1.4.1
KEY STRENGTHS
15.1.1.4.2
STRATEGIC CHOICES
15.1.1.4.3
WEAKNESSES & COMPETITIVE THREATS
15.1.2
SIEMENS GAMESA RENEWABLE ENERGY
15.1.3
VESTAS WIND SYSTEMS A/S
15.1.4
MINGYANG SMART ENERGY GROUP CO., LTD
15.1.5
GOLDWIND
15.1.6
SBM OFFSHORE
15.1.7
SAIPEM SPA
15.1.8
AKER SOLUTIONS
15.1.9
HEXICON AB
15.1.10
SHANGHAI ELECTRIC
15.1.11
HD HYUNDAI HEAVY INDUSTRIES
15.1.12
DOOSAN ENERBILITY
15.1.13
DOONGFANG ELECTRIC CORPORATION
15.1.14
ENVISION GROUP
15.1.15
BW IDEOL
15.1.16
PRINCIPLE POWER
15.1.17
X1 WIND
15.1.18
JAPAN MARINE UNITED CORPORATION
15.1.19
SAITEC OFFSHORE
15.1.20
STEISDAL
15.1.21
NOV
15.1.22
CS WIND CORPORATION
15.1.23
SEATRIUM
15.1.24
TECHNIP ENERGIES
15.2
OTHER PLAYERS
15.2.1
GICON-GROSSMANN INGENIEUR CONSULT GMBH
15.2.2
GAZELLE WIND POWER LTD
16
RESEARCH METHODOLOGY
272
16.1
RESEARCH DATA
16.1.1
SECONDARY DATA
16.1.1.1
LIST OF KEY SECONDARY SOURCES
16.1.1.2
KEY DATA FROM SECONDARY SOURCES
16.1.2
PRIMARY DATA
16.1.2.1
KEY DATA FROM PRIMARY SOURCES
16.1.2.2
LIST OF PRIMARY INTERVIEW PARTICIPANTS
16.1.2.3
KEY INDUSTRY INSIGHTS
16.1.2.4
BREAKDOWN OF PRIMARY INTERVIEWS
16.2
MARKET SIZE ESTIMATION
16.2.1
BOTTOM-UP APPROACH
16.2.2
TOP-DOWN APPROACH
16.3
MARKET SIZE CALCULATION FOR BASE YEAR
16.3.1
DEMAND-SIDE ANALYSIS
16.3.1.1
DEMAND-SIDE ASSUMPTIONS
16.3.1.2
DEMAND-SIDE CALCULATIONS
16.3.2
SUPPLY-SIDE ANALYSIS
16.3.2.1
SUPPLY-SIDE ASSUMPTIONS
16.3.2.2
SUPPLY-SIDE CALCULATIONS
16.4
MARKET FORECAST APPROACH
16.4.1
SUPPLY SIDE
16.4.2
DEMAND SIDE
16.5
DATA TRIANGULATION
16.6
FACTOR ANALYSIS
16.7
RESEARCH ASSUMPTIONS AND LIMITATIONS
16.8
RISK ANALYSIS
17
APPENDIX
287
17.1
INSIGHTS FROM INDUSTRY EXPERTS
17.2
DISCUSSION GUIDE
17.3
KNOWLEDGESTORE: MARKETSANDMARKETS’ SUBSCRIPTION PORTAL
17.4
CUSTOMIZATION OPTIONS
17.5
RELATED REPORTS
17.6
AUTHOR DETAILS
LIST OF TABLES
TABLE 1
FLOATING OFFSHORE WIND MARKET: INCLUSIONS AND EXCLUSIONS
TABLE 2
FLOATING OFFSHORE WIND MARKET: INTERCONNECTED MARKETS
TABLE 3
KEY MOVES AND STRATEGIC FOCUS OF TIER-1/2/3 PLAYERS
TABLE 4
IMPACT OF PORTER’S FIVE FORCES ANALYSIS
TABLE 5
GDP PERCENTAGE CHANGE, BY KEY COUNTRY, 2021–2029
TABLE 6
ROLE OF COMPANIES IN FLOATING OFFSHORE WIND ECOSYSTEM
TABLE 7
FLOATING OFFSHORE WIND MARKET: INDICATIVE CAPEX RANGE, 2025 (USD MILLION/MW)
TABLE 8
IMPORT DATA FOR HS CODE 850231-COMPLIANT PRODUCTS, BY COUNTRY, 2021–2024 (USD THOUSAND)
TABLE 9
EXPORT DATA FOR HS CODE 850231-COMPLIANT PRODUCTS, BY COUNTRY, 2021–2024 (USD THOUSAND)
TABLE 10
FLOATING OFFSHORE WIND MARKET: LIST OF KEY CONFERENCES AND EVENTS, 2025–2026
TABLE 11
FLOATING OFFSHORE WIND FARM ENABLES STABLE RENEWABLE GENERATION IN DEEP WATERS
TABLE 12
FLOATING PLATFORM DESIGN IMPROVES STABILITY AND SCALABILITY
TABLE 13
FLOATING WIND INTEGRATED WITH OFFSHORE ENERGY INFRASTRUCTURE
TABLE 14
US-ADJUSTED RECIPROCAL TARIFF RATES
TABLE 15
LIST OF PATENTS (2020–2025)
TABLE 16
FLOATING WIND-POWERED OFFSHORE ENERGY HUBS
TABLE 17
OFFSHORE ELECTRIFICATION OF OIL & GAS PLATFORMS
TABLE 18
GREEN HYDROGEN PRODUCTION USING OFFSHORE FLOATING WIND
TABLE 19
DEEP-WATER OFFSHORE WIND POWER GENERATION (60M+ WATER DEPTH)
TABLE 20
TOP USE CASES AND FLOATING OFFSHORE WIND MARKET POTENTIAL
TABLE 21
BEST PRACTICES: COMPANIES IMPLEMENTING USE CASES
TABLE 22
FLOATING OFFSHORE WIND MARKET: CASE STUDIES RELATED TO GEN AI/ AI IMPLEMENTATION
TABLE 23
INTERCONNECTED ADJACENT ECOSYSTEM AND IMPACT ON MARKET PLAYERS
TABLE 24
NORTH AMERICA: REGULATORY BODIES, GOVERNMENT AGENCIES, AND OTHER ORGANIZATIONS
TABLE 25
EUROPE: REGULATORY BODIES, GOVERNMENT AGENCIES, AND OTHER ORGANIZATIONS
TABLE 26
ASIA PACIFIC: REGULATORY BODIES, GOVERNMENT AGENCIES, AND OTHER ORGANIZATIONS
TABLE 27
GLOBAL STANDARDS
TABLE 28
FLOATING OFFSHORE WIND CERTIFICATIONS, LABELING, AND ECO-STANDARDS
TABLE 29
INFLUENCE OF STAKEHOLDERS ON BUYING PROCESS FOR COMPONENTS (%)
TABLE 30
KEY BUYING CRITERIA FOR COMPONENTS
TABLE 31
FLOATING OFFSHORE WIND MARKET, BY TURBINE RATING, 2023–2025 (USD MILLION)
TABLE 32
FLOATING OFFSHORE WIND MARKET, BY TURBINE RATING, 2026–2031 (USD MILLION)
TABLE 33
UP TO 5 MW: FLOATING OFFSHORE WIND MARKET, BY REGION, 2023–2025 (USD MILLION)
TABLE 34
UP TO 5 MW: FLOATING OFFSHORE WIND MARKET, BY REGION, 2026–2031 (USD MILLION)
TABLE 35
5–10 MW: FLOATING OFFSHORE WIND MARKET, BY REGION, 2023–2025 (USD MILLION)
TABLE 36
5–10 MW: FLOATING OFFSHORE WIND MARKET, BY REGION, 2026–2031 (USD MILLION)
TABLE 37
11–15 MW: FLOATING OFFSHORE WIND MARKET, BY REGION, 2023–2025 (USD MILLION)
TABLE 38
11–15 MW: FLOATING OFFSHORE WIND MARKET, BY REGION, 2026–2031 (USD MILLION)
TABLE 39
ABOVE 15 MW: FLOATING OFFSHORE WIND MARKET, BY REGION, 2023–2025 (USD MILLION)
TABLE 40
ABOVE 15 MW: FLOATING OFFSHORE WIND MARKET, BY REGION, 2026–2031 (USD MILLION)
TABLE 41
FLOATING OFFSHORE WIND MARKET, BY FLOATING PLATFORM, 2023–2025 (USD MILLION)
TABLE 42
FLOATING OFFSHORE WIND MARKET, BY FLOATING PLATFORM, 2026–2031 (USD MILLION)
TABLE 43
SEMI-SUBMERSIBLE: FLOATING OFFSHORE WIND MARKET, BY REGION, 2023–2025 (USD MILLION)
TABLE 44
SEMI-SUBMERSIBLE: FLOATING OFFSHORE WIND MARKET, BY REGION, 2026–2031 (USD MILLION)
TABLE 45
SPAR-BUOY: FLOATING OFFSHORE WIND MARKET, BY REGION, 2023–2025 (USD MILLION)
TABLE 46
SPAR-BUOY: FLOATING OFFSHORE WIND MARKET, BY REGION, 2026–2031 (USD MILLION)
TABLE 47
TENSION–LEG: FLOATING OFFSHORE WIND MARKET, BY REGION, 2023–2025 (USD MILLION)
TABLE 48
TENSION–LEG: FLOATING OFFSHORE WIND MARKET, BY REGION, 2026–2031 (USD MILLION)
TABLE 49
BARGE & HYBRID: FLOATING OFFSHORE WIND MARKET, BY REGION, 2023–2025 (USD MILLION)
TABLE 50
BARGE & HYBRID: FLOATING OFFSHORE WIND MARKET, BY REGION, 2026–2031 (USD MILLION)
TABLE 51
FLOATING OFFSHORE WIND MARKET, BY COMPONENT, 2023–2025 (USD MILLION)
TABLE 52
FLOATING OFFSHORE WIND MARKET, BY COMPONENT, 2026–2031 (USD MILLION)
TABLE 53
TURBINES: FLOATING OFFSHORE WIND MARKET, BY REGION, 2023–2025 (USD MILLION)
TABLE 54
TURBINES: FLOATING OFFSHORE WIND MARKET, BY REGION, 2026–2031 (USD MILLION)
TABLE 55
FLOATING PLATFORMS: FLOATING OFFSHORE WIND MARKET, BY REGION, 2023–2025 (USD MILLION)
TABLE 56
FLOATING PLATFORMS: FLOATING OFFSHORE WIND MARKET, BY REGION, 2026–2031 (USD MILLION)
TABLE 57
MOORINGS & ANCHORS: FLOATING OFFSHORE WIND MARKET, BY REGION, 2023–2025 (USD MILLION)
TABLE 58
MOORINGS & ANCHORS: FLOATING OFFSHORE WIND MARKET, BY REGION, 2026–2031 (USD MILLION)
TABLE 59
ELECTRICAL SYSTEMS: FLOATING OFFSHORE WIND MARKET, BY REGION, 2023–2025 (USD MILLION)
TABLE 60
ELECTRICAL SYSTEMS: FLOATING OFFSHORE WIND MARKET, BY REGION, 2026–2031 (USD MILLION)
TABLE 61
FLOATING OFFSHORE WIND MARKET, BY DEPTH, 2023–2025 (USD MILLION)
TABLE 62
FLOATING OFFSHORE WIND MARKET, BY DEPTH, 2026–2031 (USD MILLION)
TABLE 63
UP TO 30 M: FLOATING OFFSHORE WIND MARKET, BY REGION, 2023–2025 (USD MILLION)
TABLE 64
UP TO 30 M: FLOATING OFFSHORE WIND MARKET, BY REGION, 2026–2031 (USD MILLION)
TABLE 65
30–60 M: FLOATING OFFSHORE WIND MARKET, BY REGION, 2023–2025 (USD MILLION)
TABLE 66
30–60 M: FLOATING OFFSHORE WIND MARKET, BY REGION, 2026–2031 (USD MILLION)
TABLE 67
ABOVE 60 M: FLOATING OFFSHORE WIND MARKET, BY REGION, 2023–2025 (USD MILLION)
TABLE 68
ABOVE 60 M: FLOATING OFFSHORE WIND MARKET, BY REGION, 2026–2031 (USD MILLION)
TABLE 69
FLOATING OFFSHORE WIND MARKET, BY REGION, 2023–2025 (USD MILLION)
TABLE 70
FLOATING OFFSHORE WIND MARKET, BY REGION, 2026–2031 (USD MILLION)
TABLE 71
FLOATING OFFSHORE WIND MARKET, BY REGION, 2023–2025 (MW)
TABLE 72
FLOATING OFFSHORE WIND MARKET, BY REGION, 2026–2031 (MW)
TABLE 73
ASIA PACIFIC: FLOATING OFFSHORE WIND MARKET, BY TURBINE RATING, 2023–2025 (USD MILLION)
TABLE 74
ASIA PACIFIC: FLOATING OFFSHORE WIND MARKET, BY TURBINE RATING, 2026–2031 (USD MILLION)
TABLE 75
ASIA PACIFIC: FLOATING OFFSHORE WIND MARKET, BY FLOATING PLATFORM, 2023–2025 (USD MILLION)
TABLE 76
ASIA PACIFIC: FLOATING OFFSHORE WIND MARKET, BY FLOATING PLATFORM, 2026–2031 (USD MILLION)
TABLE 77
ASIA PACIFIC: FLOATING OFFSHORE WIND MARKET, BY COMPONENT, 2023–2025 (USD MILLION)
TABLE 78
ASIA PACIFIC: FLOATING OFFSHORE WIND MARKET, BY COMPONENT, 2026–2031 (USD MILLION)
TABLE 79
ASIA PACIFIC: FLOATING OFFSHORE WIND MARKET, BY DEPTH, 2023–2025 (USD MILLION)
TABLE 80
ASIA PACIFIC: FLOATING OFFSHORE WIND MARKET, BY DEPTH, 2026–2031 (USD MILLION)
TABLE 81
ASIA PACIFIC: FLOATING OFFSHORE WIND MARKET, BY COUNTRY, 2023–2025 (USD MILLION)
TABLE 82
ASIA PACIFIC: FLOATING OFFSHORE WIND MARKET, BY COUNTRY, 2026–2031 (USD MILLION)
TABLE 83
CHINA: FLOATING OFFSHORE WIND MARKET, BY FLOATING PLATFORM, 2023–2025 (USD MILLION)
TABLE 84
CHINA: FLOATING OFFSHORE WIND MARKET, BY FLOATING PLATFORM, 2026–2031 (USD MILLION)
TABLE 85
SOUTH KOREA: FLOATING OFFSHORE WIND MARKET, BY FLOATING PLATFORM, 2023–2025 (USD MILLION)
TABLE 86
SOUTH KOREA: FLOATING OFFSHORE WIND MARKET, BY FLOATING PLATFORM, 2026–2031 (USD MILLION)
TABLE 87
TAIWAN: FLOATING OFFSHORE WIND MARKET, BY FLOATING PLATFORM, 2023–2025 (USD MILLION)
TABLE 88
TAIWAN: FLOATING OFFSHORE WIND MARKET, BY FLOATING PLATFORM, 2026–2031 (USD MILLION)
TABLE 89
PHILIPPINES: FLOATING OFFSHORE WIND MARKET, BY FLOATING PLATFORM, 2023–2025 (USD MILLION)
TABLE 90
PHILIPPINES: FLOATING OFFSHORE WIND MARKET, BY FLOATING PLATFORM, 2026–2031 (USD MILLION)
TABLE 91
REST OF ASIA PACIFIC: FLOATING OFFSHORE WIND MARKET, BY FLOATING PLATFORM, 2023–2025 (USD MILLION)
TABLE 92
REST OF ASIA PACIFIC: FLOATING OFFSHORE WIND MARKET, BY FLOATING PLATFORM, 2026–2031 (USD MILLION)
TABLE 93
EUROPE: FLOATING OFFSHORE WIND MARKET, BY TURBINE RATING, 2023–2025 (USD MILLION)
TABLE 94
EUROPE: FLOATING OFFSHORE WIND MARKET, BY TURBINE RATING, 2026–2031 (USD MILLION)
TABLE 95
EUROPE: FLOATING OFFSHORE WIND MARKET, BY FLOATING PLATFORM, 2023–2025 (USD MILLION)
TABLE 96
EUROPE: FLOATING OFFSHORE WIND MARKET, BY FLOATING PLATFORM, 2026–2031 (USD MILLION)
TABLE 97
EUROPE: FLOATING OFFSHORE WIND MARKET, BY COMPONENT, 2023–2025 (USD MILLION)
TABLE 98
EUROPE: FLOATING OFFSHORE WIND MARKET, BY COMPONENT, 2026–2031 (USD MILLION)
TABLE 99
EUROPE: FLOATING OFFSHORE WIND MARKET, BY DEPTH, 2023–2025 (USD MILLION)
TABLE 100
EUROPE: FLOATING OFFSHORE WIND MARKET, BY DEPTH, 2026–2031 (USD MILLION)
TABLE 101
EUROPE: FLOATING OFFSHORE WIND MARKET, BY COUNTRY, 2023–2025 (USD MILLION)
TABLE 102
EUROPE: FLOATING OFFSHORE WIND MARKET, BY COUNTRY, 2026–2031 (USD MILLION)
TABLE 103
NORWAY: FLOATING OFFSHORE WIND MARKET, BY FLOATING PLATFORM, 2023–2025 (USD MILLION)
TABLE 104
NORWAY: FLOATING OFFSHORE WIND MARKET, BY FLOATING PLATFORM, 2026–2031 (USD MILLION)
TABLE 105
UK: FLOATING OFFSHORE WIND MARKET, BY FLOATING PLATFORM, 2023–2025 (USD MILLION)
TABLE 106
UK: FLOATING OFFSHORE WIND MARKET, BY FLOATING PLATFORM, 2026–2031 (USD MILLION)
TABLE 107
FRANCE: FLOATING OFFSHORE WIND MARKET, BY FLOATING PLATFORM, 2023–2025 (USD MILLION)
TABLE 108
FRANCE: FLOATING OFFSHORE WIND MARKET, BY FLOATING PLATFORM, 2026–2031 (USD MILLION)
TABLE 109
SWEDEN: FLOATING OFFSHORE WIND MARKET, BY FLOATING PLATFORM, 2023–2025 (USD MILLION)
TABLE 110
SWEDEN: FLOATING OFFSHORE WIND MARKET, BY FLOATING PLATFORM, 2026–2031 (USD MILLION)
TABLE 111
ITALY: FLOATING OFFSHORE WIND MARKET, BY FLOATING PLATFORM, 2023–2025 (USD MILLION)
TABLE 112
ITALY: FLOATING OFFSHORE WIND MARKET, BY FLOATING PLATFORM, 2026–2031 (USD MILLION)
TABLE 113
REST OF EUROPE: FLOATING OFFSHORE WIND MARKET, BY FLOATING PLATFORM, 2023–2025 (USD MILLION)
TABLE 114
REST OF EUROPE: FLOATING OFFSHORE WIND MARKET, BY FLOATING PLATFORM, 2026–2031 (USD MILLION)
TABLE 115
REST OF THE WORLD: FLOATING OFFSHORE WIND MARKET, BY TURBINE RATING, 2023–2025 (USD MILLION)
TABLE 116
REST OF THE WORLD: FLOATING OFFSHORE WIND MARKET, BY TURBINE RATING, 2026–2031 (USD MILLION)
TABLE 117
REST OF THE WORLD: FLOATING OFFSHORE WIND MARKET, BY FLOATING PLATFORM, 2023–2025 (USD MILLION)
TABLE 118
REST OF THE WORLD: FLOATING OFFSHORE WIND MARKET, BY FLOATING PLATFORM, 2026–2031 (USD MILLION)
TABLE 119
REST OF THE WORLD: FLOATING OFFSHORE WIND MARKET, BY COMPONENT, 2023–2025 (USD MILLION)
TABLE 120
REST OF THE WORLD: FLOATING OFFSHORE WIND MARKET, BY COMPONENT, 2026–2031 (USD MILLION)
TABLE 121
REST OF THE WORLD: FLOATING OFFSHORE WIND MARKET, BY DEPTH, 2023–2025 (USD MILLION)
TABLE 122
REST OF THE WORLD: FLOATING OFFSHORE WIND MARKET, BY DEPTH, 2026–2031 (USD MILLION)
TABLE 123
REST OF THE WORLD: FLOATING OFFSHORE WIND MARKET, BY REGION, 2023–2025 (USD MILLION)
TABLE 124
REST OF THE WORLD: FLOATING OFFSHORE WIND MARKET, BY REGION, 2026–2031 (USD MILLION)
TABLE 125
NORTH AMERICA: FLOATING OFFSHORE WIND MARKET, BY FLOATING PLATFORM, 2023–2025 (USD MILLION)
TABLE 126
NORTH AMERICA: FLOATING OFFSHORE WIND MARKET, BY FLOATING PLATFORM, 2026–2031 (USD MILLION)
TABLE 127
SOUTH AMERICA: FLOATING OFFSHORE WIND MARKET, BY FLOATING PLATFORM, 2023–2025 (USD MILLION)
TABLE 128
SOUTH AMERICA: FLOATING OFFSHORE WIND MARKET, BY FLOATING PLATFORM, 2026–2031 (USD MILLION)
TABLE 129
MIDDLE EAST & AFRICA: FLOATING OFFSHORE WIND MARKET, BY FLOATING PLATFORM, 2023–2025 (USD MILLION)
TABLE 130
MIDDLE EAST & AFRICA: FLOATING OFFSHORE WIND MARKET, BY FLOATING PLATFORM, 2026–2031 (USD MILLION)
TABLE 131
FLOATING OFFSHORE WIND MARKET: OVERVIEW OF STRATEGIES ADOPTED BY KEY PLAYERS, APRIL 2021–FEBRUARY 2026
TABLE 132
FLOATING OFFSHORE WIND MARKET: TURBINE RATING FOOTPRINT
TABLE 133
FLOATING OFFSHORE WIND MARKET: COMPONENT FOOTPRINT
TABLE 134
FLOATING OFFSHORE WIND MARKET: REGION FOOTPRINT
TABLE 135
FLOATING OFFSHORE WIND MARKET: DETAILED LIST OF KEY STARTUPS/SMES
TABLE 136
FLOATING OFFSHORE WIND MARKET: COMPETITIVE BENCHMARKING OF KEY STARTUPS/SMES
TABLE 137
FLOATING OFFSHORE WIND MARKET: PRODUCT LAUNCHES, APRIL 2021–FEBRUARY 2026
TABLE 138
FLOATING OFFSHORE WIND MARKET: DEALS, APRIL 2021–FEBRUARY 2026
TABLE 139
FLOATING OFFSHORE WIND MARKET: EXPANSIONS, APRIL 2021–FEBRUARY 2026
TABLE 140
FLOATING OFFSHORE WIND MARKET: OTHER DEVELOPMENTS, APRIL 2021–FEBRUARY 2026
TABLE 141
GE VERNOVA: COMPANY OVERVIEW
TABLE 142
GE VERNOVA: PRODUCTS/SOLUTIONS/SERVICES OFFERED
TABLE 143
GE VERNOVA: PRODUCT LAUNCHES
TABLE 144
GE VERNOVA: DEALS
TABLE 145
GE VERNOVA: EXPANSIONS
TABLE 146
SIEMENS GAMESA RENEWABLE ENERGY: COMPANY OVERVIEW
TABLE 147
SIEMENS GAMESA RENEWABLE ENERGY: PRODUCTS/SOLUTIONS/ SERVICES OFFERED
TABLE 148
SIEMENS GAMESA RENEWABLE ENERGY: DEALS
TABLE 149
SIEMENS GAMESA RENEWABLE ENERGY: EXPANSIONS
TABLE 150
SIEMENS GAMESA RENEWABLE ENERGY: OTHER DEVELOPMENTS
TABLE 151
VESTAS WIND SYSTEMS A/S: COMPANY OVERVIEW
TABLE 152
VESTAS WIND SYSTEMS A/S: PRODUCTS/SOLUTIONS/SERVICES OFFERED
TABLE 153
VESTAS WIND SYSTEMS A/S: DEALS
TABLE 154
VESTAS WIND SYSTEMS A/S: OTHER DEVELOPMENTS
TABLE 155
MINGYANG SMART ENERGY GROUP CO., LTD: COMPANY OVERVIEW
TABLE 156
MINGYANG SMART ENERGY GROUP CO., LTD: PRODUCTS/SOLUTIONS/ SERVICES OFFERED
TABLE 157
MINGYANG SMART ENERGY GROUP CO., LTD.: PRODUCT LAUNCHES
TABLE 158
MINGYANG SMART ENERGY GROUP CO., LTD.: DEALS
TABLE 159
MINGYANG SMART ENERGY GROUP CO., LTD.: EXPANSIONS
TABLE 160
MINGYANG SMART ENERGY GROUP CO., LTD: OTHER DEVELOPMENTS
TABLE 161
GOLDWIND: COMPANY OVERVIEW
TABLE 162
GOLDWIND: PRODUCTS/SOLUTIONS/SERVICES OFFERED
TABLE 163
GOLDWIND: PRODUCT LAUNCHES
TABLE 164
GOLDWIND: DEALS
TABLE 165
GOLDWIND: EXPANSIONS
TABLE 166
SBM OFFSHORE: COMPANY OVERVIEW
TABLE 167
SBM OFFSHORE: PRODUCTS/SOLUTIONS/SERVICES OFFERED
TABLE 168
SBM OFFSHORE: PRODUCT LAUNCHES
TABLE 169
SBM OFFSHORE: DEALS
TABLE 170
SBM OFFSHORE: EXPANSIONS
TABLE 171
SBM OFFSHORE: OTHER DEVELOPMENTS
TABLE 172
SAIPEM SPA: COMPANY OVERVIEW
TABLE 173
SAIPEM SPA: PRODUCTS/SOLUTIONS/SERVICES OFFERED
TABLE 174
SAIPEM SPA: PRODUCT LAUNCHES
TABLE 175
SAIPEM SPA: DEALS
TABLE 176
SAIPEM SPA: OTHER DEVELOPMENTS
TABLE 177
AKER SOLUTIONS: COMPANY OVERVIEW
TABLE 178
AKER SOLUTIONS: PRODUCTS/SOLUTIONS/SERVICES OFFERED
TABLE 179
AKER SOLUTIONS: PRODUCT LAUNCHES
TABLE 180
AKER SOLUTIONS: DEALS
TABLE 181
AKER SOLUTIONS: OTHER DEVELOPMENTS
TABLE 182
HEXICON AB: COMPANY OVERVIEW
TABLE 183
HEXICON AB: PRODUCTS/SOLUTIONS/SERVICES OFFERED
TABLE 184
HEXICON AB: DEALS
TABLE 185
HEXICON AB: OTHER DEVELOPMENTS
TABLE 186
SHANGHAI ELECTRIC: COMPANY OVERVIEW
TABLE 187
SHANGHAI ELECTRIC: PRODUCTS/SOLUTIONS/SERVICES OFFERED
TABLE 188
SHANGHAI ELECTRIC: DEALS
TABLE 189
SHANGHAI ELECTRIC: OTHER DEVELOPMENTS
TABLE 190
HD HYUNDAI HEAVY INDUSTRIES: COMPANY OVERVIEW
TABLE 191
HD HYUNDAI HEAVY INDUSTRIES: PRODUCTS/SOLUTIONS/SERVICES OFFERED
TABLE 192
HD HYUNDAI HEAVY INDUSTRIES: DEALS
TABLE 193
HD HYUNDAI HEAVY INDUSTRIES: OTHER DEVELOPMENTS
TABLE 194
DOOSAN ENERBILITY: COMPANY OVERVIEW
TABLE 195
DOOSAN ENERBILITY: PRODUCTS/SOLUTIONS/SERVICES OFFERED
TABLE 196
DOOSAN ENERBILITY: DEALS
TABLE 197
DOONGFANG ELECTRIC CORPORATION: COMPANY OVERVIEW
TABLE 198
DOONGFANG ELECTRIC CORPORATION: PRODUCTS/SOLUTIONS/SERVICES OFFERED
TABLE 199
DOONGFANG ELECTRIC CORPORATION: PRODUCT LAUNCHES
TABLE 200
DOONGFANG ELECTRIC CORPORATION: EXPANSIONS
TABLE 201
ENVISION GROUP: COMPANY OVERVIEW
TABLE 202
ENVISION GROUP: PRODUCTS/SOLUTIONS/SERVICES OFFERED
TABLE 203
ENVISION GROUP: PRODUCT LAUNCHES
TABLE 204
ENVISION GROUP: DEALS
TABLE 205
ENVISION GROUP: EXPANSIONS
TABLE 206
ENVISION GROUP: OTHER DEVELOPMENTS
TABLE 207
BW IDEOL: COMPANY OVERVIEW
TABLE 208
BW IDEOL: PRODUCTS/SOLUTIONS/SERVICES OFFERED
TABLE 209
BW IDEOL: PRODUCT LAUNCHES
TABLE 210
BW IDEOL: DEALS
TABLE 211
BW IDEOL: OTHER DEVELOPMENTS
TABLE 212
PRINCIPLE POWER: COMPANY OVERVIEW
TABLE 213
PRINCIPLE POWER: PRODUCTS/SOLUTIONS/SERVICES OFFERED
TABLE 214
PRINCIPLE POWER: PRODUCT LAUNCHES
TABLE 215
PRINCIPLE POWER: DEALS
TABLE 216
PRINCIPLE POWER: OTHER DEVELOPMENTS
TABLE 217
X1 WIND: COMPANY OVERVIEW
TABLE 218
X1 WIND: PRODUCTS/SOLUTIONS/SERVICES OFFERED
TABLE 219
X1 WIND: DEALS
TABLE 220
X1 WIND: EXPANSIONS
TABLE 221
JAPAN MARINE UNITED CORPORATION: COMPANY OVERVIEW
TABLE 222
JAPAN MARINE UNITED CORPORATION: PRODUCTS/SOLUTIONS/ SERVICES OFFERED
TABLE 223
JAPAN MARINE UNITED CORPORATION: DEALS
TABLE 224
SAITEC OFFSHORE: COMPANY OVERVIEW
TABLE 225
SAITEC OFFSHORE: PRODUCTS/SOLUTIONS/SERVICES OFFERED
TABLE 226
SAITEC OFFSHORE: DEALS
TABLE 227
SAITEC OFFSHORE: OTHER DEVELOPMENTS
TABLE 228
STEISDAL: COMPANY OVERVIEW
TABLE 229
STEISDAL: PRODUCTS/SOLUTIONS/SERVICES OFFERED
TABLE 230
STEISDAL: DEALS
TABLE 231
NOV: COMPANY OVERVIEW
TABLE 232
NOV: PRODUCTS/SOLUTIONS/SERVICES OFFERED
TABLE 233
NOV: PRODUCT LAUNCHES
TABLE 234
NOV: OTHER DEVELOPMENTS
TABLE 235
CS WIND CORPORATION: COMPANY OVERVIEW
TABLE 236
CS WIND CORPORATION: PRODUCTS/SOLUTIONS/SERVICES OFFERED
TABLE 237
CS WIND CORPORATION: DEALS
TABLE 238
CS WIND CORPORATION: OTHER DEVELOPMENTS
TABLE 239
SEATRIUM: COMPANY OVERVIEW
TABLE 240
SEATRIUM: PRODUCTS/SOLUTIONS/SERVICES OFFERED
TABLE 241
SEATRIUM: DEALS
TABLE 242
SEATRIUM: OTHER DEVELOPMENTS
TABLE 243
TECHNIP ENERGIES: COMPANY OVERVIEW
TABLE 244
TECHNIP ENERGIES: PRODUCTS/SOLUTIONS/SERVICES OFFERED
TABLE 245
TECHNIP ENERGIES: DEALS
TABLE 246
GICON-GROSSMANN INGENIEUR CONSULT GMBH: COMPANY OVERVIEW
TABLE 247
GAZELLE WIND POWER LTD: COMPANY OVERVIEW
TABLE 248
MAJOR SECONDARY SOURCES
TABLE 249
PRIMARY INTERVIEW PARTICIPANTS, BY COMPANY
TABLE 250
FLOATING OFFSHORE WIND MARKET: RISK ANALYSIS
LIST OF FIGURES
FIGURE 1
FLOATING OFFSHORE WIND MARKET SEGMENTATION AND REGIONAL SCOPE
FIGURE 2
FLOATING OFFSHORE WIND MARKET: YEARS CONSIDERED
FIGURE 3
FLOATING OFFSHORE WIND MARKET SCENARIO
FIGURE 4
GLOBAL FLOATING OFFSHORE WIND MARKET, 2023–2031
FIGURE 5
MAJOR STRATEGIES ADOPTED BY KEY PLAYERS IN FLOATING OFFSHORE WIND MARKET, 2021–2026
FIGURE 6
DISRUPTIONS IMPACTING GROWTH OF FLOATING OFFSHORE WIND MARKET
FIGURE 7
HIGH-GROWTH SEGMENTS IN FLOATING OFFSHORE WIND MARKET, 2026–2031
FIGURE 8
ASIA PACIFIC TO REGISTER HIGHEST GROWTH RATE DURING FORECAST PERIOD
FIGURE 9
DEEPWATER EXPANSION AND POLICY SUPPORT TO DRIVE MARKET BETWEEN 2026 AND 2031
FIGURE 10
ASIA PACIFIC TO EXHIBIT HIGHEST CAGR BETWEEN 2026 AND 2031
FIGURE 11
5–10 MW SEGMENT ACCOUNTED FOR LARGEST SHARE OF ASIA PACIFIC MARKET IN 2025
FIGURE 12
5–10 MW SEGMENT TO ACCOUNT FOR LARGEST MARKET SHARE IN 2031
FIGURE 13
SEMI-SUBMERSIBLE SEGMENT TO HOLD LARGEST SHARE OF FLOATING OFFSHORE WIND MARKET IN 2031
FIGURE 14
FLOATING PLATFORMS SEGMENT TO HOLD LARGEST SHARE OF FLOATING OFFSHORE WIND MARKET IN 2031
FIGURE 15
ABOVE 60 M SEGMENT TO HOLD LARGEST SHARE OF FLOATING OFFSHORE WIND MARKET IN 2031
FIGURE 16
EUROPE TO HOLD LARGEST SHARE OF FLOATING OFFSHORE WIND MARKET IN 2031
FIGURE 17
FLOATING OFFSHORE WIND MARKET: DRIVERS, RESTRAINTS, OPPORTUNITIES, AND CHALLENGES
FIGURE 18
OFFSHORE WIND POWER MANUFACTURING CAPACITY ACCORDING TO ANNOUNCED PROJECTS AND IN NET ZERO SCENARIO, 2019–2030
FIGURE 19
OFFSHORE WIND ELECTRICITY CAPACITY GROWTH, BY TECHNOLOGY SEGMENT, 2010–2030
FIGURE 20
FLOATING OFFSHORE WIND MARKET: PORTER’S FIVE FORCES ANALYSIS
FIGURE 21
FLOATING OFFSHORE WIND MARKET: SUPPLY CHAIN ANALYSIS
FIGURE 22
FLOATING OFFSHORE WIND MARKET: ECOSYSTEM
FIGURE 23
IMPORT DATA FOR HS CODE 850231-COMPLIANT PRODUCTS FOR TOP FIVE COUNTRIES, 2021–2024
FIGURE 24
EXPORT DATA FOR HS CODE 850231-COMPLIANT PRODUCTS FOR TOP FIVE COUNTRIES, 2021–2024
FIGURE 25
TRENDS/DISRUPTIONS INFLUENCING CUSTOMER BUSINESS
FIGURE 26
PATENTS APPLIED AND GRANTED, 2015–2025
FIGURE 27
FUTURE APPLICATIONS OF FLOATING OFFSHORE WIND MARKET
FIGURE 28
SUCCESS STORIES AND REAL-WORLD APPLICATIONS
FIGURE 29
FLOATING OFFSHORE WIND MARKET: DECISION-MAKING FACTORS
FIGURE 30
INFLUENCE OF STAKEHOLDERS ON BUYING PROCESS FOR TOP THREE COMPONENTS
FIGURE 31
KEY BUYING CRITERIA FOR TOP THREE COMPONENTS
FIGURE 32
FLOATING OFFSHORE WIND MARKET SHARE, BY TURBINE RATING, 2025
FIGURE 33
FLOATING OFFSHORE WIND MARKET SHARE, BY FLOATING PLATFORM, 2025
FIGURE 34
FLOATING OFFSHORE WIND MARKET SHARE, BY COMPONENT, 2025
FIGURE 35
FLOATING OFFSHORE WIND MARKET SHARE, BY DEPTH, 2025
FIGURE 36
ASIA PACIFIC TO REGISTER HIGHEST CAGR DURING FORECAST PERIOD
FIGURE 37
FLOATING OFFSHORE WIND MARKET SHARE, BY REGION, 2025
FIGURE 38
ASIA PACIFIC: FLOATING OFFSHORE WIND MARKET SNAPSHOT
FIGURE 39
EUROPE: FLOATING OFFSHORE WIND MARKET SNAPSHOT
FIGURE 40
ACTIVE PLAYERS IN FLOATING OFFSHORE WIND MARKET, 2025
FIGURE 41
FLOATING OFFSHORE WIND MARKET: REVENUE ANALYSIS OF TOP FIVE PLAYERS, 2021–2025
FIGURE 42
FLOATING OFFSHORE WIND MARKET: COMPANY EVALUATION MATRIX (KEY PLAYERS), 2025
FIGURE 43
FLOATING OFFSHORE WIND MARKET: COMPANY FOOTPRINT
FIGURE 44
FLOATING OFFSHORE WIND MARKET: COMPANY EVALUATION MATRIX (STARTUPS/SMES), 2025
FIGURE 45
COMPANY VALUATION
FIGURE 46
FINANCIAL METRICS
FIGURE 47
BRAND/PRODUCT COMPARISON
FIGURE 48
GE VERNOVA: COMPANY SNAPSHOT
FIGURE 49
SIEMENS GAMESA RENEWABLE ENERGY: COMPANY SNAPSHOT
FIGURE 50
VESTAS WIND SYSTEMS A/S: COMPANY SNAPSHOT
FIGURE 51
MINGYANG SMART ENERGY GROUP CO., LTD: COMPANY SNAPSHOT
FIGURE 52
GOLDWIND: COMPANY SNAPSHOT
FIGURE 53
SBM OFFSHORE: COMPANY SNAPSHOT
FIGURE 54
SAIPEM SPA: COMPANY SNAPSHOT
FIGURE 55
AKER SOLUTIONS: COMPANY SNAPSHOT
FIGURE 56
HEXICON AB: COMPANY SNAPSHOT
FIGURE 57
SHANGHAI ELECTRIC: COMPANY SNAPSHOT
FIGURE 58
HD HYUNDAI HEAVY INDUSTRIES: COMPANY SNAPSHOT
FIGURE 59
DOOSAN ENERBILITY: COMPANY SNAPSHOT
FIGURE 60
BW IDEOL: COMPANY SNAPSHOT
FIGURE 61
NOV: COMPANY SNAPSHOT
FIGURE 62
CS WIND CORPORATION: COMPANY SNAPSHOT
FIGURE 63
SEATRIUM: COMPANY SNAPSHOT
FIGURE 64
TECHNIP ENERGIES : COMPANY SNAPSHOT
FIGURE 65
FLOATING OFFSHORE WIND MARKET: RESEARCH DESIGN
FIGURE 66
CORE FINDINGS FROM INDUSTRY EXPERTS
FIGURE 67
BREAKDOWN OF PRIMARY INTERVIEWS, BY COMPANY TYPE, DESIGNATION, AND REGION
FIGURE 68
FLOATING OFFSHORE WIND MARKET SIZE CALCULATION: BOTTOM-UP APPROACH
FIGURE 69
FLOATING OFFSHORE WIND MARKET: BOTTOM-UP APPROACH
FIGURE 70
FLOATING OFFSHORE WIND MARKET SIZE CALCULATION: TOP-DOWN APPROACH
FIGURE 71
FLOATING OFFSHORE WIND MARKET: TOP-DOWN APPROACH
FIGURE 72
FLOATING OFFSHORE WIND MARKET: DEMAND-SIDE ANALYSIS
FIGURE 73
FLOATING OFFSHORE WIND MARKET: DEMAND-SIDE CALCULATIONS
FIGURE 74
KEY METRICS CONSIDERED TO ASSESS SUPPLY OF FLOATING OFFSHORE WIND MARKET
FIGURE 75
FLOATING OFFSHORE WIND MARKET: SUPPLY-SIDE ANALYSIS
FIGURE 76
FLOATING OFFSHORE WIND MARKET: DATA TRIANGULATION
FIGURE 77
FLOATING OFFSHORE WIND MARKET: FACTOR ANALYSIS
FIGURE 78
FLOATING OFFSHORE WIND MARKET: RESEARCH ASSUMPTIONS AND LIMITATIONS
Methodology
This study encompassed significant efforts in determining the present size of the floating offshore wind market. It commenced with a thorough secondary research process to gather data on the market, comparable markets, and the broader industry. Subsequently, these findings, assumptions, and market size calculations were rigorously validated through primary research by consulting industry experts across the entire supply chain. The total market size was assessed by conducting an analysis specific to each country. Following that, the market was further dissected, and the data was cross-referenced to estimate the size of various segments and subsegments within the market.
Secondary Research
In this research study, a wide range of secondary sources was utilized, including directories, databases, and reputable references such as the Global Wind Energy Council, WindEurope, Factiva, World Bank, International Monetary Fund (IMF), the US Department of Energy (DOE), and the International Energy Agency (IEA). These sources played a crucial role in gathering valuable data for a comprehensive analysis of the global market, covering technical, market-oriented, and commercial aspects. Additional secondary sources included annual reports, press releases, investor presentations, whitepapers, authoritative publications, articles authored by well-respected experts, information from industry associations, trade directories, and various database resources.
Primary Research
The floating offshore wind market involves a range of stakeholders, including raw material providers, wind turbine manufacturers, floating platform & mooring providers, project developers/contractors, and end users/power offtakers. To gather qualitative and quantitative insights, various primary sources from both the supply and demand sides of the market were interviewed. The following breakdown presents the primary respondents involved in the research study.
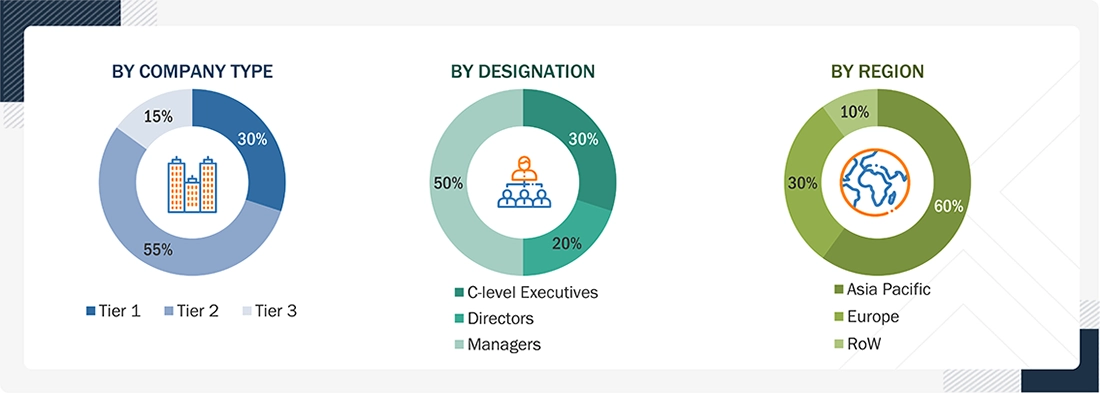
Note: “Others” include sales managers, engineers, and regional managers.
The tiers of the companies are defined based on their total revenue as of 2024: Tier 1: >USD 1 billion, Tier 2: USD 500 million–1 billion, and Tier 3: <USD 500 million.
To know about the assumptions considered for the study, download the pdf brochure
Market Size Estimation
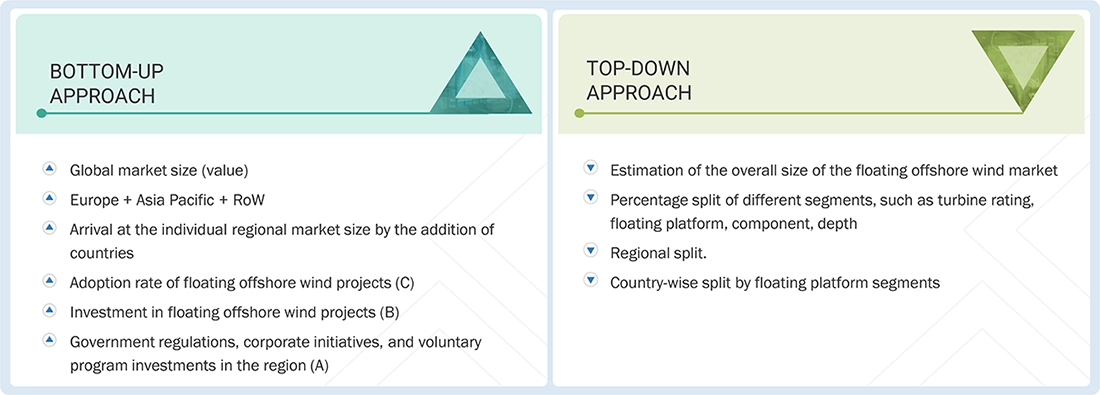
The estimation and validation of the floating offshore wind market size have been conducted using both bottom-up and top-down approaches. This approach was rigorously employed to ascertain the dimensions of multiple subsegments within the market. The research process comprises the following key stages.
- Thorough secondary and primary research has been conducted to gain a comprehensive understanding of the global market landscape for various segments of the market.
- When calculating and forecasting the market size, qualitative factors such as market drivers, restraints, opportunities, and challenges have been taken into account.
Data Triangulation
The process of determining the overall market size involved the methodologies described earlier, followed by segmenting the market into multiple segments and subsegments. To finalize the comprehensive market analysis and obtain precise statistics for each market segment and subsegment, data triangulation and market segmentation techniques were applied, as appropriate. Data triangulation was accomplished by examining various factors and trends from both the demand and supply perspectives within the ecosystem of the floating offshore wind market.
Market Definition
The global floating offshore wind market comprises the development, deployment, and commercialization of wind energy systems installed on buoyant substructures in deep-water environments where conventional fixed-bottom foundations are technically or economically unviable. This market encompasses a range of turbine ratings, from small-scale units to next-generation high-capacity turbines exceeding 15 MW, integrated with advanced floating platform designs such as semi-submersible, spar-buoy, and tension-leg platforms. It further includes critical components such as wind turbines, floating substructures, mooring and anchoring systems, and subsea electrical infrastructure required for power transmission and grid integration. The market operates across varying water depths, particularly beyond 60 meters, unlocking access to superior wind resources located in deeper offshore zones. Floating offshore wind plays a pivotal role in expanding the geographical scope of offshore wind deployment, enabling countries with limited shallow-water sites to harness renewable energy potential, while contributing significantly to global decarbonization objectives and the transition toward low-carbon energy systems.
Key Stakeholders
- Project Developers & Owners
- Turbine Manufacturers
- Floating Platform Developers & Technology Providers
- EPC Contractors & Marine Engineering Firms
- Mooring, Anchoring & Subsea System Providers
- Electrical Infrastructure & Grid Connection Providers
- Ports, Shipyards & Installation Vessel Operators
- Governments & Regulatory Authorities
- Investors & Financial Institutions
- Research Institutions & Certification Bodies
- Energy Associations
- Environmental Associations
- Energy Efficiency Consultants
Report Objectives
- To describe, analyze, and forecast the floating offshore wind market, by turbine rating, floating platform, component, and depth, in terms of value
- To describe and forecast the market for five key regions: Europe, Asia Pacific, and the Rest of World (RoW), along with their country-level market sizes, in terms of value
- To give comprehensive details regarding drivers, restraints, opportunities, and challenges impacting the expansion of the market
- To systematically examine the market for floating offshore wind in terms of each segment’s contributions to the market, growth trends, and prospects
- To provide the supply chain analysis, trends/disruptions impacting customer business, market maps, ecosystem analysis, sustainability and regulatory landscape, pricing analysis, patent analysis, case study analysis, technology analysis, key conferences and events, Porter’s five forces analysis, macroeconomic outlook, customer landscape & buyer behavior, regulatory analysis, and AI/Gen AI impact on the market
- To conduct a strategic analysis of micromarkets concerning their respective growth trends, planned expansions, and market share contributions
- To sketch into a competitive environment for market participants and assess the potential for stakeholders in the floating offshore wind business
- To benchmark players within the market using the company evaluation matrix, which analyzes market players on various parameters within the broad categories of business and product strategies
- To compare key market players for the product specifications and rankings
- To strategically profile key players and comprehensively analyze their market ranking and core competencies
- To analyze competitive developments in the floating offshore wind industry, such as agreements, investments, joint ventures, expansions, product launches, contracts, partnerships, collaborations, and acquisitions.
Available customizations:
With the given market data, MarketsandMarkets offers customizations based on the company’s specific needs. The following customization options are available for the report:
PRODUCT ANALYSIS
- Product Matrix, which provides a detailed comparison of the product portfolio of each company
COMPANY INFORMATION
Detailed analyses and profiling of additional market players (up to 5)
⚡ Growth Signals
Personalize This Research
- Triangulate with your Own Data
- Get Data as per your Format and Definition
- Gain a Deeper Dive on a Specific Application, Geography, Customer or Competitor
- Any level of Personalization
Let Us Help You
- What are the Known and Unknown Adjacencies Impacting the Floating Offshore Wind Market
- What will your New Revenue Sources be?
- Who will be your Top Customer; what will make them switch?
- Defend your Market Share or Win Competitors
- Get a Scorecard for Target Partners


Kimberly Murphy
GLOBAL MARKETING DIRECTOR
Bently Nevada,
Leading Condition Monitoring & Asset Protection

MarketsandMarkets™ showed consistent rigor for success and relentlessly worked with Bently Nevada stakeholders to positively impact go-to-market strategy. Their proactiveness and flexibility has been instrumental in achieving the objectives to grow our sales pipeline in key industrial markets.

DARRICK HUEBER
Business Development Leader
Nexus Controls LLC,
Leading Manufacturer of Automation System & Electrical Panels

We partnered with MarketsandMarkets to expand our business further by tapping into new industrial segments. It was critical for us to gather crucial business insights about specific markets to achieve this goal. MarketsandMarkets engagement model and client services helped us provide those insights, it was really impressive and valuable for my business. The team was extremely flexible and helpful.

Mike Schoff
Global Industrial Commercial Strategy Leader
Nexus Controls LLC
Leading Manufacturer of Automation System & Electrical Panels
We consulted MarketsandMarkets for potential Partner Identification. Overall, it was a good experience. The insights provided through interviews conducted by the team helped us put together the questionnaire required for discussion with the selected partners. Their ability to provide insights through interviews with customers in a timely manner was quite impressive.
What the Floating Offshore Wind Report Didn't Show You?
Explore the strategic intelligence behind the Floating Offshore Wind Market
- 🏆 Competitors
- 🎯 Opportunities
- 📈 Growth Signals
Generate 15+ consulting-grade insights instantly
Powered by 17 years of MarketsandMarkets intelligence
