







- DESCRIPTION
- TABLE OF CONTENTS
- METHODOLOGY
- DOWNLOAD PDF
ebike Market by Class (Class I, II, & III), Battery (Li-ion, Li-ion Polymer, Lead Acid), Motor (Mid, Hub), Mode (Throttle, Pedal Assist), Usage (Mountain/Trekking, City/Urban, Cargo), Speed, Battery Capacity, Component, Region - Global Forecast to 2035

USD 74.98 BN
MARKET SIZE, 2035

CAGR 5.5%
(2026-2035)

560
REPORT PAGES

550
MARKET TABLES
OVERVIEW
Source: Secondary Research, Interviews with Experts, MarketsandMarkets Analysis
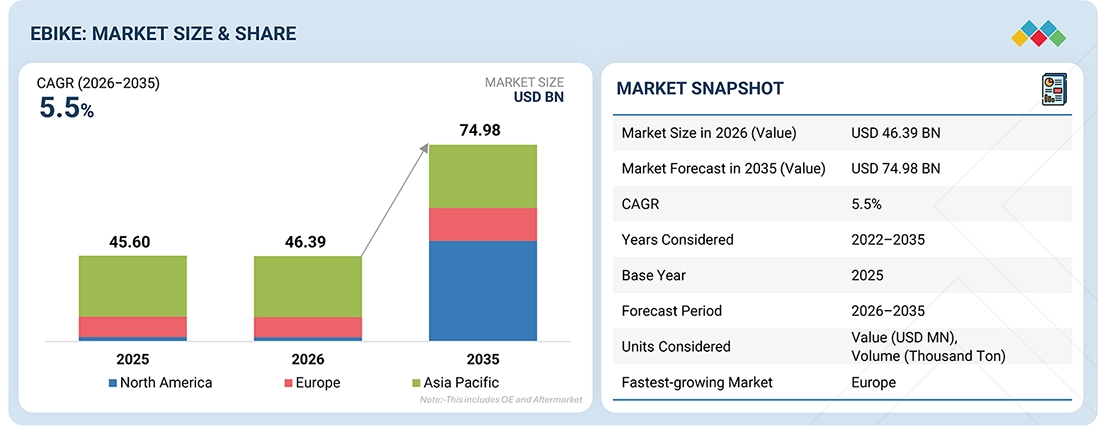
The global ebike market is expected to grow from USD 46.39 billion in 2026 to USD 74.98 billion by 2035, with a CAGR of 5.5%. The global ebike market is gradually growing; however, there is a slight decline in Europe and North America. In Europe, the ebike market has remained down since 2024 due to excessive inventories, heavy discounting, and weak consumer demand, a trend that has continued into 2026. The North American ebike market is also still contracting, owing to tariff pressures, high retail prices, and demand normalization post-COVID. Companies such as Rad Power Bikes are facing financial and operational challenges, indicating the market has not yet stabilized. In contrast, Asia Oceania continues to lead the global market by volume, led by China, where daily commuting demand and domestic manufacturers are maintaining steady sales momentum. Overall, the market is not trending upward in the short term, as it is sluggish in Europe and North America and is expected to see a market correction starting in mid-2027. Alternatively, the Asia Pacific market is stable, making the current global trend imbalanced and demand-constrained rather than growth-driven.
KEY TAKEAWAYS
-
BY REGION
Asia Pacific holds the largest market for ebikes, with a share >70% in terms of value.
-
BY SPEED
The 25-45 km/h speed segment is will be the fastest-growing, at a CAGR of more than 11%, in terms of value.
-
BY USAGE
City/urban ebikes hold the largest market share of >55%, in terms of value.
-
BY CLASS
Class III ebikes is the fastest-growing ebike segment in terms of value.
-
By COMPONENT
The battery segment holds the major market share of all components in terms of value.
-
BY BATTERY TYPE
Lithium-ion-phosphate is projected to be the fastest-growing ebike battery segment.
-
BY MODE
Pedal assist ebikes hold the largest market share in terms of value.
-
BY BATTERY CAPACITY
ebikes with >650W battery capacity will be the fastest-growing segment in terms of value.
-
BY OWNERSHIP
Personal mobility is the largest application of ebikes, in terms of value.
-
BY MOTOR WEIGHT
ebikes with >2.4 Kg is projected to be the fastest-growing segment, in terms of value.
-
BY MOTOR TYPE
Mid-motor ebikes hold the largest market share in terms of value.
-
BY MOTOR POWER (Nm)
>70 Nm motor ebikes is projected to be the fastest-growing segment in terms of value.
-
BY MOTOR POWER (Watt)
>500-600W is the projected to be the fastest-growing segment in terms of value.
-
BY BATTERY INTEGRATION
The integrated battery segment holds the largest market share in terms of value.
-
COMPETITIVE LANDSCAPE - KEY PLAYERS
Accell Group, Giant Manufacturing Co., Ltd., Yadea Group Holdings, Ltd., Yamaha Motor Company, and Pon Bicycles B.V. are the star players in the ebike market, as they are focused on innovation; investments in R&D as well as new and existing manufacturing plants; and offer discounts on ebikes.
-
COMPETITIVE LANDSCAPE - STARTUPS
Lectric eBikes, Voltbikes, Aventon, and Super 73 are startups driving the market with new technological innovations, new subscription and leasing models, attracting investment, and accelerating market growth.
The global ebike market is in a post-boom normalization phase, with near-term weakness in Europe and North America driven by excess inventory, discounting, and demand correction rather than structural decline. Growth is shifting from discretionary purchases to utility-led use cases such as commuting and last-mile delivery, with cargo ebikes gaining traction.
TRENDS & DISRUPTIONS IMPACTING CUSTOMERS' CUSTOMERS
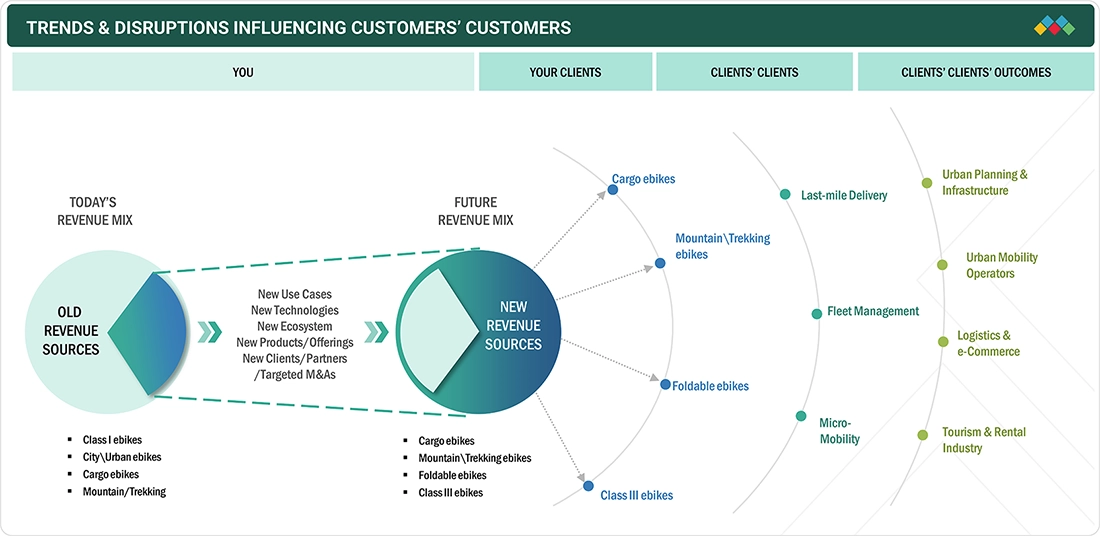
The most disruptive trends in the ebike market (2025–2026) are shifting the industry from pure growth to technology, safety, and system-level transformation. A key disruption is the shift toward high-performance yet compact systems, with new motors delivering over 100 Nm of torque and lighter, integrated battery designs that make ebikes resemble traditional bicycles. Another major shift is smart and connected ebikes, with AI-based features, automatic gear shifting, and app-enabled diagnostics becoming standard, reflecting convergence with consumer electronics.
Source: Secondary Research, Interviews with Experts, MarketsandMarkets Analysis
MARKET DYNAMICS

Drivers
Impact
Level
-
Government support to increase ebike sales for CO2 emission reduction

-
Growing popularity of electric mountain and cargo bikes


RESTRAINTS
Impact
Level
-
Limited charging infrastructure for ebikes

-
Varied government regulations and lack of proper infrastructure


OPPORTUNITIES
Impact
Level
-
Trend of connected ebikes

-
Development of lightweight electrical energy storage systems


CHALLENGES
Impact
Level
-
High price of ebikes

-
Importing to European Union and US from China

Source: Secondary Research, Interviews with Experts, MarketsandMarkets Analysis
Governments around the world are supporting ebikes because they help reduce CO2 emissions and transportation pollution. To encourage people to switch from cars to ebikes, European governments are offering subsidies and discounts on purchases, along with building better cycling infrastructure, such as dedicated bike lanes. In the US, proposals and state-level programs promote ebike adoption as part of clean transportation strategies, and in Asia (especially China and India), policies focus on electrifying two-wheelers to cut urban air pollution.
Most personal ebikes are charged at home, and limited public and workplace charging still constrains expansion beyond short, predictable commutes, particularly for delivery, shared mobility, and long-distance urban riders, reducing overall utilization rates and fleet scalability. At the same time, structural cost pressures persist: OEMs are equipping ebikes with higher-spec battery packs (larger capacity, integrated designs, advanced BMS), increasing the bill of materials, while post-pandemic consumers remain price-sensitive and anchored to lower historical price points. This creates a price-value mismatch, compressing OEM margins, limiting pricing power, and slowing the transition toward premium, high-performance models, thereby moderating overall market growth.
A major opportunity in the ebike market is the rapid adoption of connected features, which are transforming ebikes into smart mobility devices. Modern ebikes increasingly include GPS tracking, mobile app integration, anti-theft systems, real-time diagnostics, and route optimization, enhancing both, user convenience and safety. These features are especially valuable for urban commuters and fleet operators (such as delivery services), enabling better vehicle monitoring, predictive maintenance, and efficient operations.
Importing ebikes from China into the EU and the US is increasingly challenged by regulatory fragmentation across power limits, speed thresholds, classification systems, and safety/battery standards, which compels manufacturers to develop multiple SKU variants (e.g., 25 km/h, 250W-compliant models for the EU versus Class 1/2/3 configurations in the US with different throttle and speed allowances). This multi-SKU requirement limits scale efficiencies in production and sourcing, increases inventory complexity, and extends time-to-market due to repeated testing, certification (such as CE marking, UL standards), and homologation processes. At the same time, tightening battery safety regulations and import scrutiny increase compliance costs, documentation burdens, and risk of shipment delays, collectively squeezing margins and making cross-border expansion less economically attractive for OEMs.
E-BIKE MARKET SIZE, SHARE & ANALYSIS: COMMERCIAL USE CASES ACROSS INDUSTRIES
| COMPANY | USE CASE DESCRIPTION | BENEFITS |
|---|---|---|
|
|
Focuses on a wide range of premium ebikes including urban commuting, mountain (e-MTB), and performance cycling, supported by a strong global retail and manufacturing network | Offers high-quality engineering, global availability, and advanced motor integration (often with Yamaha systems), making it suitable for everyday commuters as well as professional riders |
|
|
Specializes in urban mobility, cargo ebikes, and niche applications (like logistics and adventure cycling), with strong presence across Europe and partnerships with public/private sectors | Provides diverse product portfolio and strong European distribution, enabling efficient last-mile delivery solutions and sustainable urban transport adoption |
|
|
Targets mass-market urban commuting and affordable e-mobility, with strong focus on high-volume production and expansion into global markets | Delivers cost-effective ebikes with smart features (GPS, digital display, battery tech) and large-scale production, making them accessible for emerging markets |
|
|
Primarily provides ebike drive systems (motors, batteries, displays) and collaborates with OEMs to power high-performance and premium ebikes | Enables high-performance, reliable powertrain solutions (e.g., 85 Nm motors), supporting innovation and performance across multiple ebike brands globally |




Logos and trademarks shown above are the property of their respective owners. Their use here is for informational and illustrative purposes only.
MARKET ECOSYSTEM
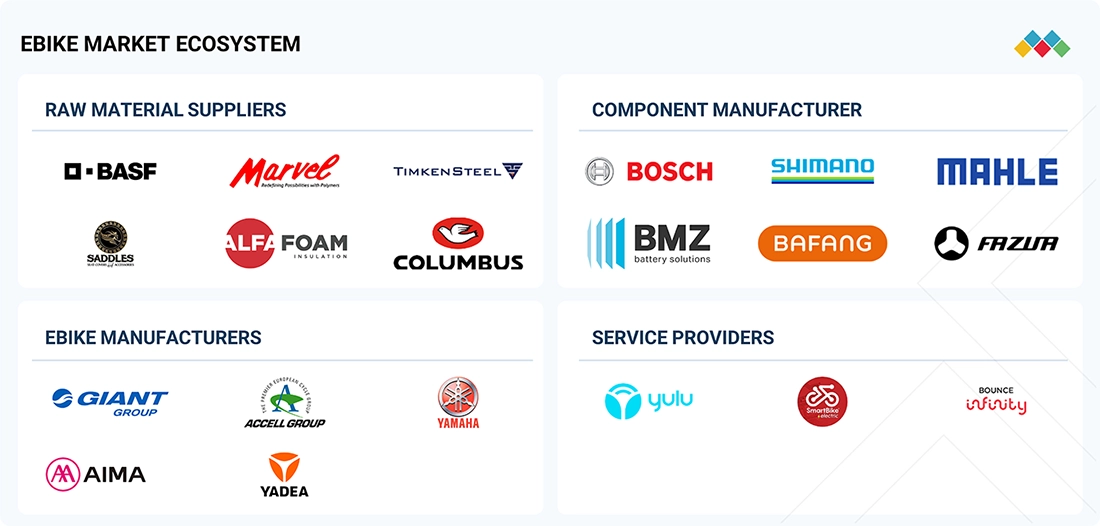
The ecosystem highlights various ebike market players, including raw material suppliers, ebike component manufacturers, ebike manufacturers, and end users. The leading players in the ebike market are Giant Bicycles (Taiwan), Yadea Technology Group Co., Ltd. (China), Yamaha Motor Co., Ltd. (Japan), Pon.Bike (Netherlands), and Accell group N.V. (Netherlands), among others, which offer advanced ebikes with a strong distribution network worldwide.
Logos and trademarks shown above are the property of their respective owners. Their use here is for informational and illustrative purposes only.
MARKET SEGMENTS
Source: Secondary Research, Interviews with Experts, MarketsandMarkets Analysis
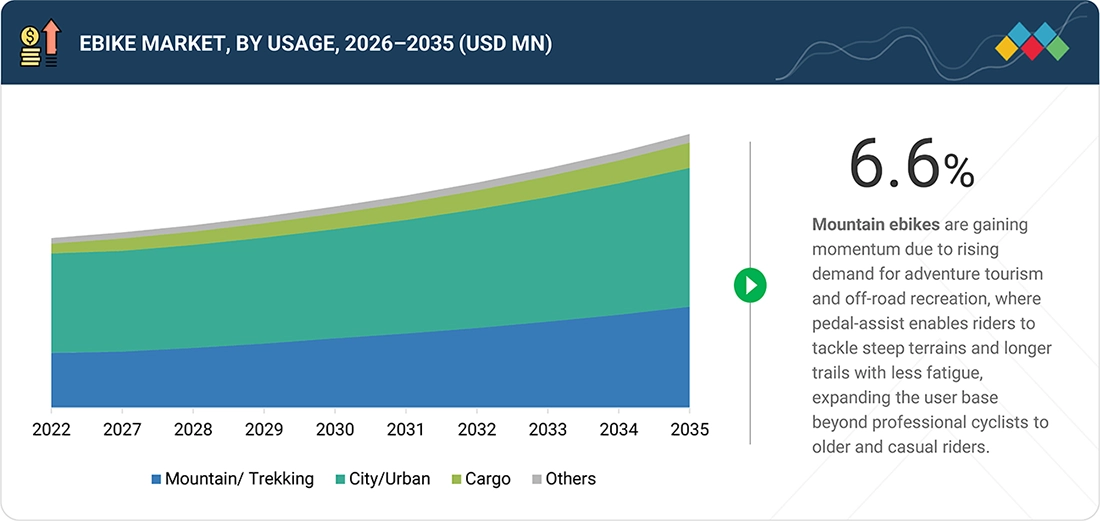
City/urban ebikes dominate the segment, with differences at the regional level. In Asia–Oceania, especially China and Southeast Asia, urban ebikes are growing strongly because they are the primary low-cost daily transport. Around 25% of urban users prefer them for affordability and convenience, and the region contributes over 75% of global demand. In Europe, the market is mature but still strong in cities, where around 38% of commuters use ebikes for short trips, supported by strict emission policies and dense cycling infrastructure, though growth is stabilizing due to market saturation. In North America, demand for mountain/trekking ebikes is higher due to increased outdoor activities. Moreover, demand for cargo ebikes has increased, as they are used in last-mile delivery.
Class III is the fastest-growing segment in the ebike market. In Asia Oceania, Class I ebikes dominate, as lower-speed, throttle-assisted models are widely used for daily commuting because of affordability and relaxed regulations. In Europe, Class I (pedal-assist, ≤25 km/h) is the most common, driven by strict regulatory frameworks that limit speed and throttle use, making it the standard for urban mobility. In contrast, North America shows growing demand for Class II and Class III ebikes, with Class III (up to ~45 km/h) gaining traction for longer commutes and suburban travel, supported by more flexible regulations and rising interest in high-speed urban mobility.
Pedal-assist mode holds the dominant market share and will continue to for the foreseeable future. The shift from throttle-assisted to pedal-assist ebikes is driven by changing consumer preferences and regulatory influence. Pedal-assist models are gaining popularity because they offer a more natural riding experience, better battery efficiency, and improved range, making them suitable for daily commuting and fitness-oriented users. In contrast, throttle-assisted ebikes, while convenient, tend to consume more battery power and face stricter regulations in many markets, limiting their growth.
Personal ownership of e-bikes will dominate the market through the forecast period. Because personal e-bikes are used mostly for daily commuting and recreational purposes, commercial adoption is growing rapidly, especially in last-mile delivery, ride sharing, and rental services. Businesses prefer fleet deployment because e-bikes offer lower operating costs, higher efficiency in urban areas, and easier maintenance compared to fuel-based vehicles. At the same time, digital fleet management tools (tracking, diagnostics, battery monitoring) are making large-scale operations more efficient.
REGION
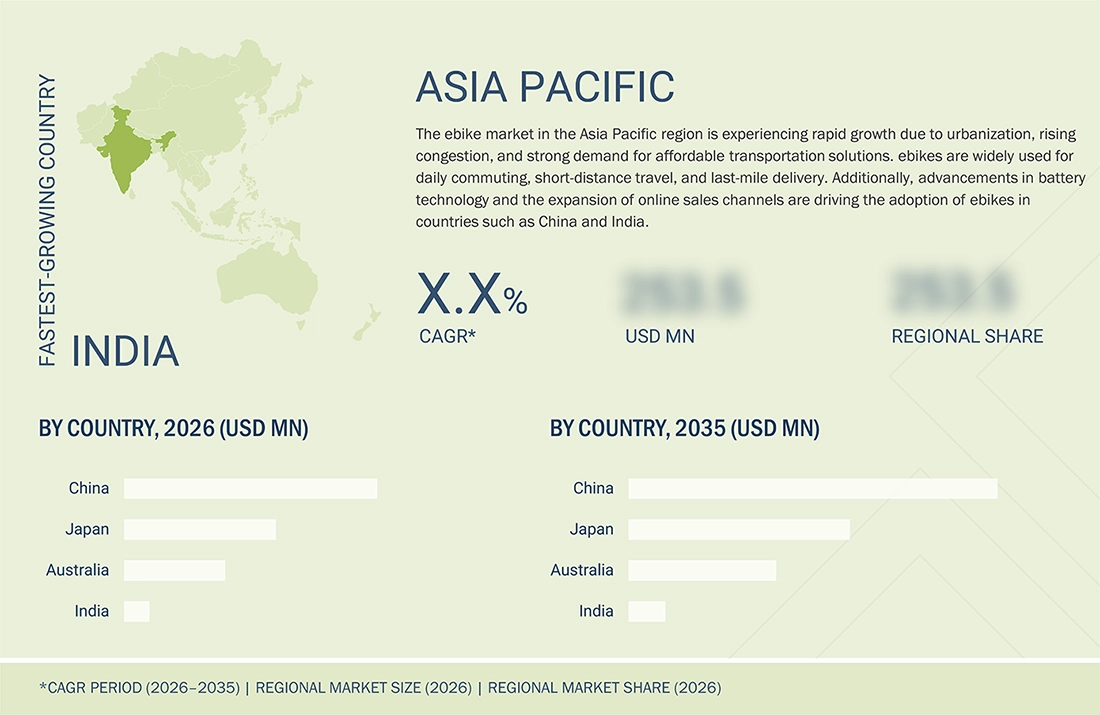
Asia Pacific is likely to be the largest ebike market globally, throughout the forecast period.
Asia Pacific leads the ebike market largely because ebikes are deeply integrated into daily transportation systems across the region, especially in countries such as China, where they serve as a primary mode of low-cost mobility rather than a lifestyle product. The region benefits from large-scale local manufacturing and supply chains, which significantly reduce costs and make ebikes more affordable to a wider population. In addition, high urban population density, traffic congestion, and rising fuel prices push consumers toward efficient two-wheel solutions. Governments also support electrification to reduce urban pollution, further boosting adoption. According to the International Energy Agency, the widespread use of electric two-wheelers in Asia plays a crucial role in lowering transport emissions, which is why the region continues to dominate global ebike demand.
E-BIKE MARKET SIZE, SHARE & ANALYSIS: COMPANY EVALUATION MATRIX
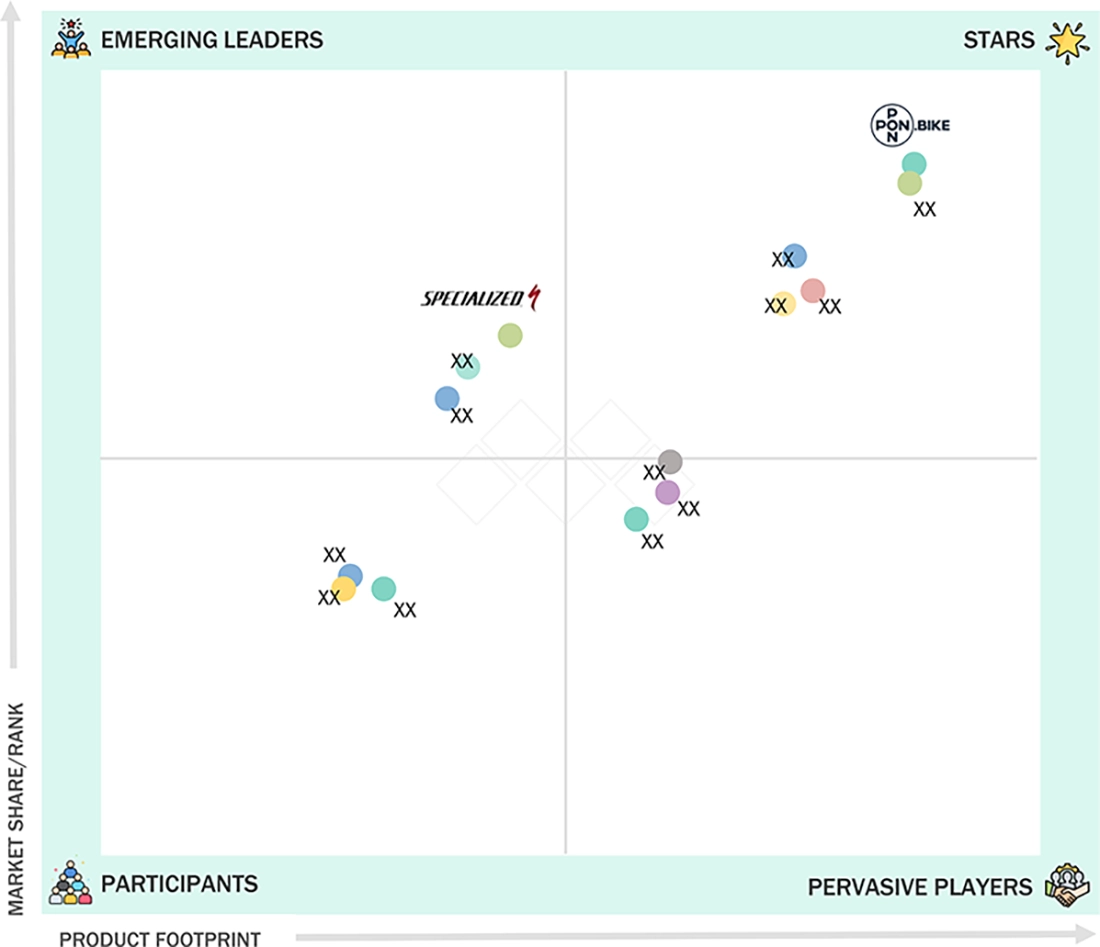
Pon.Bike (Star) maintains a strong market presence and offers a wide range of products in the ebike market, enabling widespread adoption in cargo, city, gravel, mountain, and trekking ebikes. Specialized Bicycle Components (Emerging Leader) is gaining traction with innovative ebike with connected features and other services.
Source: Secondary Research, Interviews with Experts, MarketsandMarkets Analysis
KEY MARKET PLAYERS
- Pon.Bike (Netherlands)
- Yadea Group Holdings (China)
- AIMA Technology Group (China)
- Giant Bicycles (Taiwan)
- Yamaha Motor Company (Japan)
- Accelle Group (Netherlands)
- Merida Industries Co., Ltd. (Taiwan)
- Pedgo Electric Bikes (US)
- Specialized Bicycles Components (US)
- VanMoof (Netherlands)
- BH Bikes (Spain)
MARKET SCOPE
| REPORT METRIC | DETAILS |
|---|---|
| Market Size in 2026 (Value) | 46.39 Billion |
| Market Forecast in 2035 (Value) | 74.98 Billion |
| Growth Rate | CAGR of 5.5% from 2026 to 2035 |
| Years Considered | 2022–2035 |
| Base Year | 2025 |
| Forecast Period | 2026-2035 |
| Units Considered | Value (USD Million), Volume (Thousand Ton) |
| Report Coverage | Revenue forecast, top companies market share, startup companies market share, growth factors and trends, TCO of ebikes, ASP of ebike according to key players, and AI impact on ebikes |
| Segments Covered |
|
| Regional Scope | Asia Pacific, Europe, North America |
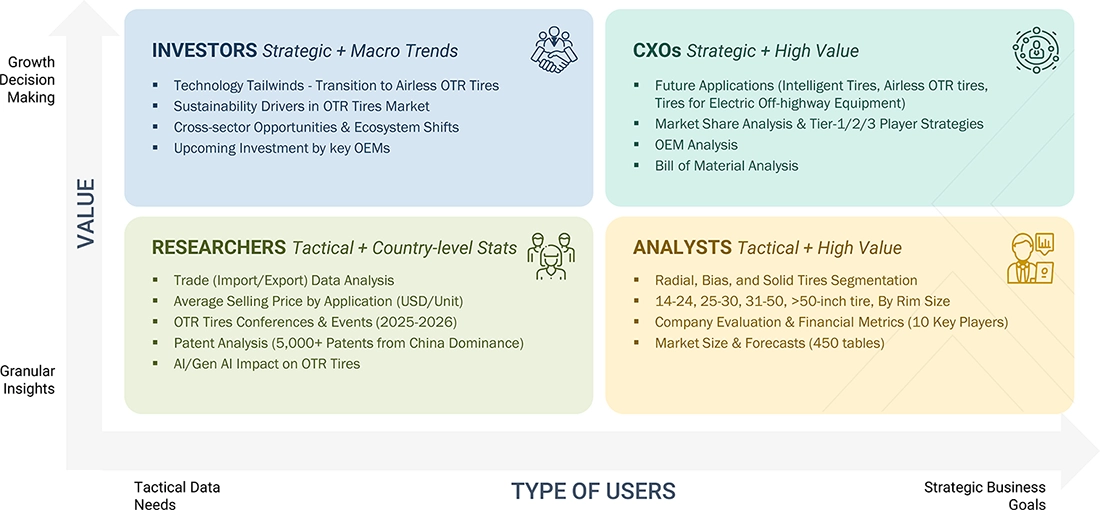
WHAT IS IN IT FOR YOU: E-BIKE MARKET SIZE, SHARE & ANALYSIS REPORT CONTENT GUIDE
DELIVERED CUSTOMIZATIONS
We have successfully delivered the following deep-dive customizations:
| CLIENT REQUEST | CUSTOMIZATION DELIVERED | VALUE ADDS |
|---|---|---|
| Region-specific insights (Europe slowdown vs. Asia growth) | Country-level analysis with 2024–2026 sales estimates | Identification of high-growth segments (mid-drive, >250W) |
| Segmentation by Class I, II, III, motor type, and battery capacity | Detailed segmentation (pedal-assist vs. throttle, hub vs. mid-drive) | Explanation of regional market shifts and demand patterns |
| Pricing trends and impact of subsidies/tariffs (2025–2026) | Scenario-based forecasts (2026 decline vs. recovery outlook) | Actionable regional expansion recommendations |
| Consumer behavior analysis (commuting vs. recreation) | Company-specific insights and product launch tracking | Early signals on recovery timelines and risk factors |
| Regulatory and safety compliance updates | Currency conversions for cross-market comparison | Simplification of complex data into decision-ready insights |
RECENT DEVELOPMENTS
- April 2026 : Segwal launched a compact, utility-focused urban e-bike after CES 2026, featuring a 750W hub motor, ~80-mile range, and a 716Wh battery. It supports modular accessories (cargo racks, kid seats) and smart features like Apple FindMy and radar safety, making it ideal for last-mile logistics and city commuting.
- March 2026 : Specialized Bicycle Components, Inc. launched the "S-Works Turbo Levo 4 LTD" as a flagship electric mountain ebike, with a carbon frame structure and a 111 Nm torque motor with a 840 Wh battery.
- February 2026 : Viral Bikes launched the Wander-ee Gravel e-bike, featuring a Pinion Smart.Shift drivetrain and long-distance touring capability. Built for bikepacking, it integrates high-end components and rugged geometry, targeting niche high-performance riders.
- February 2026 : Merida launched the eONE-SIXTY/ETMO series of trail eMTBs, which were offered with Bosch CX motors and improved affordability in alloy frames.
- February 2025 : Zaragoza launched a fully electric public bike-sharing system available 24/7 across all districts, designated as the "24/7 Ebike System." It is an integral component of the “Bizi” bike-sharing program, implemented in collaboration with Lyft Urban Solutions and managed locally.
Table of Contents
 Exclusive indicates content/data unique to MarketsandMarkets and not available with any competitors.
TITLE
PAGE NO
1
INTRODUCTION
15
2
EXECUTIVE SUMMARY
3
PREMIUM INSIGHTS
4
MARKET OVERVIEW
4.1
INTRODUCTION
4.2
MARKET DYNAMICS
4.2.1
DRIVERS
4.2.1.1
GOVERNMENT SUPPORT TO INCREASE EBIKE SALES FOR CO2 EMISSION REDUCTION
4.2.1.2
GROWING POPULARITY OF MOUNTAIN AND CARGO BIKES
4.2.1.3
GROWTH OF MICROMOBILITY SERVICES AND MOBILITY-AS-A-SERVICE (MAAS)
4.2.2
RESTRAINTS
4.2.2.1
LIMITED CHARGING INFRASTRUCTURE FOR EBIKES
4.2.2.2
VARIED GOVERNMENT REGULATIONS AND LACK OF PROPER INFRASTRUCTURE
4.2.3
OPPORTUNITIES
4.2.3.1
TREND OF CONNECTED EBIKES
4.2.3.2
DEVELOPMENT OF LIGHTWEIGHT ELECTRICAL ENERGY STORAGE SYSTEM
4.2.3.3
DEVELOPMENTS IN DRIVE MOTORS FOR IMPROVED PERFORMANCE OF EBIKES
4.2.4
CHALLENGES
4.2.4.1
HIGHER PRICES OF EBIKES
4.2.4.2
IMPORTING TO EUROPE UNION AND THE US FROM CHINA
4.2.4.3
COMPETITION FROM ALTERNATIVE MICROMOBILITY SOLUTIONS (ELECTRIC MOPEDS, ELECTRIC SCOOTERS)
4.3
UNMET NEEDS AND WHITE SPACES
4.4
INTERCONNECTED MARKETS AND CROSS-SECTOR OPPORTUNITIES
4.5
STRATEGIC MOVES BY TIER-1/2/3 PLAYERS
5
INDUSTRY TRENDS
5.1
MACROECONOMIC OUTLOOK
5.1.1
INTRODUCTION
5.1.2
GDP TRENDS AND FORECAST
5.1.3
TRENDS IN GLOBAL AUTOMOTIVE & TRANSPORTATION INDUSTRY
5.2
SUPPLY CHAIN ANALYSIS
5.3
ECOSYSTEM ANALYSIS
5.4
PRICING ANALYSIS
5.4.1
AVERAGE SELLING PRICE TREND, BY REGION, 2022–2025
5.4.2
AVERAGE SELLING PRICE TREND, BY USAGE, 2022–2025
5.4.3
AVERAGE SELLING PRICE TREND, BY MODE, 2022–2025
5.4.4
OEM-WISE PRICING, BY BATTERY CAPACITY
5.4.5
AVERAGE SELLING PRICE BY KEY PLAYERS
5.5
TRADE ANALYSIS
5.5.1
IMPORT SCENARIO, (HS CODE 871160), 2020–2025
5.5.2
EXPORT SCENARIO, (HS CODE 871160), 2020–2025
5.6
KEY CONFERENCES AND EVENTS, 2026–2027
5.7
TRENDS/DISRUPTIONS IMPACTING CUSTOMER BUSINESS
5.8
INVESTMENT SCENARIO
5.9
FUNDING BY USE CASE APPLICATION
5.10
CASE STUDY ANALYSIS
5.11
TOTAL COST OF OWNERSHIP
5.11.1
TOTAL COST OF OWNERSHIP (GLOBAL)
5.11.2
TOTAL COST OF OWNERSHIP FOR EBIKES IN INDIA, EBIKES VS. E2W VS ICE.2W
5.11.3
TOTAL COST OF OWNERSHIP (INDIA)
5.12
OEM ANALYSIS
5.12.1
ELECTRIC MOTOR SUPPLIER VS. MOTOR SUPPLIER
5.12.2
OEM VS BREATH OF THE PRODUCTS OFFERED
5.12.3
OEM VS MOTOR TYPE
5.12.4
OEM VS BATTERY VOLTAGE
6
TECHNOLOGICAL ADVANCEMENTS, AI-DRIVEN IMPACT, PATENTS, INNOVATIONS, AND FUTURE STRATEGIC APPLICATIONS
6.1
TECHNOLOGY ANALYSIS
6.1.1
KEY TECHNOLOGIES
6.1.1.1
ALL-WHEEL DRIVE
6.1.1.2
MOTOR DRIVE
6.1.1.3
BATTERY TECHNOLOGY
6.1.1.4
ELECTRIC MOUNTAIN BIKE
6.1.1.5
LITHIUM-ION BATTERY SYSTEMS AND BATTERY MANAGEMENT SYSTEM
6.1.1.6
PEDAL ASSIST SENSORS
6.1.2
COMPLEMENTARY TECHNOLOGY
6.1.2.1
SWAPPABLE BATTERIES
6.1.2.2
INTEGRATION OF INTELLIGENT FEATURES
6.1.2.3
FOLDING EBIKES FOR URBAN MOBILITY
6.1.2.4
DIGITAL DISPLAY/HMI
6.1.2.5
GPS TRACKING & ANTI-THEFT SYSTEMS
6.1.2.6
REGENERATIVE BRAKING (LIMITED ADOPTION)
6.1.3
ADJACENT TECHNOLOGY
6.1.3.1
AFTERMARKET E-BIKE KIT
6.1.3.2
SUBSCRIPTION AND SHARING SERVICE
6.1
TECHNOLOGY/PRODUCT ROADMAP
6.2
PATENT ANALYSIS
6.3
FUTURE APPLICATIONS
6.4
IMPACT OF AI/GEN AI ON EBIKE MARKET
6.4.1
TOP USE CASES AND MARKET POTENTIAL
6.4.2
BEST PRACTICES IN EBIKE DEVELOPMENT
6.4.3
CASE STUDIES OF AI IMPLEMENTATION IN EBIKE MARKET
6.4.4
INTERCONNECTED ADJACENT ECOSYSTEM AND IMPACT ON MARKET PLAYERS
6.4.5
CLIENTS’ READINESS TO ADOPT GENERATIVE AI IN EBIKE MARKET
6.6
SUCCESS STORIES AND REAL-WORLD APPLICATIONS
7
REGULATORY LANDSCAPE
7.1
US
7.2
CANADA
7.3
ASIA PACIFIC
7.4
EUROPE
7.5
REGIONAL REGULATIONS AND COMPLIANCE
7.5.1
REGULATORY BODIES, GOVERNMENT AGENCIES, AND OTHER ORGANIZATIONS
7.5.1.1
NORTH AMERICA
7.5.1.2
EUROPE
7.5.1.3
ASIA PACIFIC
7.5.2
GLOBAL SAFETY REGULATIONS
8
CUSTOMER LANDSCAPE & BUYER BEHAVIOR
8.1
DECISION-MAKING PROCESS
8.2
BUYER STAKEHOLDERS AND BUYING EVALUATION CRITERIA
8.3
ADOPTION BARRIERS & INTERNAL CHALLENGES
8.4
UNMET NEEDS FROM VARIOUS END-USE INDUSTRIES
8.5
MARKET PROFITABILITY
9
EBIKE MARKET, BY CLASS
[MARKET SIZE & FORECAST TO 2035 – IN VALUE (USD MILLION) & VOLUME]
9.1
INTRODUCTION
9.2
CLASS I
9.3
CLASS II
9.4
CLASS III
9.5
KEY PRIMARY INSIGHTS
10
EBIKE MARKET, BY SPEED
[MARKET SIZE & FORECAST TO 2035 – IN VALUE (USD MILLION) & VOLUME]
10.1
INTRODUCTION
10.2
UP TO 25 KM/H
10.3
25-45 KM/H
10.4
KEY PRIMARY INSIGHTS
11
EBIKE MARKET, BY BATTERY TYPE
[MARKET SIZE & FORECAST TO 2035 – IN VALUE (USD MILLION) & VOLUME]
11.1
INTRODUCTION
11.2
LITHIUM-ION
11.3
LITHIUM-ION POLYMER
11.4
LEAD ACID
11.5
OTHER BATTERY TYPES
11.6
KEY PRIMARY INSIGHTS
12
EBIKE MARKET, BY BATTERY CAPACITY
[MARKET SIZE & FORECAST TO 2035 – IN VALUE (USD MILLION) & VOLUME]
12.1
INTRODUCTION
12.2
<250 W
12.3
>250 W–<450W
12.4
>450 W–<650 W
12.5
>650 W
12.6
KEY PRIMARY INSIGHTS
13
EBIKE MARKET, BY BATTERY VOLTAGE
(MARKET SIZE & FORECAST TO 2035 – IN VOLUME, THOUSAND UNITS)
13.1
INTRODUCTION
13.2
LESS THAN 39V
13.3
39V TO 45V
13.4
45V TO 51V
13.5
KEY PRIMARY INSIGHTS
14
EBIKE MARKET, BY TYPE OF BATTERY INTEGRATION
(MARKET SIZE & FORECAST TO 2035 – IN VOLUME, THOUSAND UNITS)
14.1
INTRODUCTION
14.2
INTEGRATED
14.3
EXTERNAL
14.4
KEY PRIMARY INSIGHTS
15
EBIKE MARKET, BY MODE
[MARKET SIZE & FORECAST TO 2035 – IN VALUE (USD MILLION) & VOLUME]
15.1
INTRODUCTION
15.2
PEDAL ASSIST
15.3
THROTTLE
15.4
KEY PRIMARY INSIGHTS
16
EBIKE MARKET, BY COMPONENT
[MARKET SIZE & FORECAST TO 2035 – IN VALUE (USD MILLION) & VOLUME]
16.1
INTRODUCTION
16.2
BATTERY
16.3
ELECTRIC MOTOR
16.4
FRAMES WITH FORK
16.5
WHEELS
16.6
CRANK GEAR
16.7
BRAKE SYSTEM
16.8
MOTOR CONTROLLER
16.9
KEY PRIMARY INSIGHTS
17
EBIKE MARKET, BY USAGE
[MARKET SIZE & FORECAST TO 2035 – IN VALUE (USD MILLION) & VOLUME]
17.1
INTRODUCTION
17.2
MOUNTAIN/TREKKING
17.3
CITY/URBAN
17.4
CARGO
17.5
OTHER USAGE
17.6
KEY PRIMARY INSIGHTS
18
EBIKE MARKET, BY OWNERSHIP
(MARKET SIZE & FORECAST TO 2035 – IN VOLUME, THOUSAND UNITS)
18.1
INTRODUCTION
18.2
SHARED
18.3
PERSONAL
18.4
KEY PRIMARY INSIGHTS
19
EBIKE MARKET, BY MOTOR TYPE
[MARKET SIZE & FORECAST TO 2035 – IN VALUE (USD MILLION) & VOLUME]
19.1
INTRODUCTION
19.2
HUB MOTOR
19.3
MID MOTOR
19.4
KEY PRIMARY INSIGHTS
20
EBIKE MARKET, BY MOTOR WEIGHT
[MARKET SIZE & FORECAST TO 2035 – IN VALUE (USD MILLION) & VOLUME]
20.1
INTRODUCTION
20.2
<2 KG
20.3
>2KG–<2.4KG
20.4
>2.4 KG
20.5
KEY PRIMARY INSIGHTS
21
EBIKE MARKET, BY MOTOR POWER
[MARKET SIZE & FORECAST TO 2035 – IN VALUE (USD MILLION) & VOLUME]
21.1
INTRODUCTION
21.2
<40 NM
21.3
>40 NM–<70 NM
21.4
>70 NM
21.5
KEY PRIMARY INSIGHTS
22
EBIKE MARKET, BY MOTOR POWER (WATT)
[MARKET SIZE & FORECAST TO 2035 – IN VALUE (USD MILLION) & VOLUME]
22.1
INTRODUCTION
22.2
LESS THAN 250 W
22.3
251–350 W
22.4
351–500 W
22.5
501–600 W
22.6
>600 W
22.7
KEY PRIMARY INSIGHTS
23
EBIKE MARKET, BY DRIVE SYSTEM
(MARKET SIZE & FORECAST TO 2035 – IN VOLUME, THOUSAND UNITS)
23.1
INTRODUCTION
23.2
CHAIN DRIVE
23.3
BELT DRIVE
23.4
KEY PRIMARY INSIGHTS
24
EBIKE MARKET, BY REGION
(MARKET SIZE & FORECAST TO 2032 – IN VALUE, USD MILLION & VOLUME)
24.1
INTRODUCTION
24.2
ASIA PACIFIC
24.2.1
MACROECONOMIC OUTLOOK FOR ASIA PACIFIC
24.2.2
CHINA
24.2.3
JAPAN
24.2.4
INDIA
24.2.5
SOUTH KOREA
24.2.6
TAIWAN
24.2.7
AUSTRALIA
24.2.8
REST OF ASIA PACIFIC
24.3
EUROPE
24.3.1
MACROECONOMIC OUTLOOK FOR EUROPE
24.3.2
GERMANY
24.3.3
NETHERLANDS
24.3.4
FRANCE
24.3.5
SPAIN
24.3.6
UK
24.3.7
AUSTRIA
24.3.8
BELGIUM
24.3.9
SWITZERLAND
24.3.10
ITALY
24.3.11
REST OF EUROPE
24.4
NORTH AMERICA
24.4.1
MACROECONOMIC OUTLOOK FOR NORTH AMERICA
24.4.2
US
24.4.3
CANADA
25
COMPETITIVE LANDSCAPE
STRATEGIC ASSESSMENT OF LEADING PLAYERS, MARKET RANKING/SHARE, REVENUE ANALYSIS, COMPANY POSITIONING, AND COMPETITIVE BENCHMARKS INFLUENCING MARKET POTENTIAL
25.1
INTRODUCTION
25.2
KEY PLAYER STRATEGIES/RIGHT TO WIN
25.3
REVENUE ANALYSIS, (2022-2025)
25.4
GLOBAL MARKET SHARE ANALYSIS FOR EBIKE MANUFACTURERS,
25.4.1
NORTH AMERICA MARKET SHARE ANALYSIS,2025
25.4.2
EUROPE MARKET SHARE ANALYSIS,2025
25.4.3
ASIA PACIFIC MARKET SHARE ANALYSIS,2025
25.5
EBIKE MARKET SHARE ANALYSIS OF KEY OEMS, 2024–2025
25.5.1
PON, MARKET SHARE, 2024–2025
25.5.2
ACCELL GROUP, MARKET SHARE, 2024–2025
25.5.3
GIANT GROUP, MARKET SHARE, 2024–2025
25.5.4
CUBE, MARKET SHARE, 2024–2025
25.5.5
SPECIALIZED BICYCLE COMPONENTS, INC., MARKET SHARE, 2024–2025
25.5.6
TREK BICYCLE CORPORATION, MARKET SHARE, 2024–2025
25.5.7
YAMAHA MOTOR CORPORATION, MARKET SHARE, 2024–2025
25.5.8
MERIDA BIKES, MARKET SHARE, 2024–2025
25.6
EBIKE DISPLAY MARKET SHARE ANALYSIS,
25.7
EBIKE BATTERY MARKET SHARE ANALYSIS,
25.8
EBIKE DRIVE UNIT MARKET SHARE ANALYSIS,
25.9
COMPANY VALUATION AND FINANCIAL MATRIX
25.10
BRAND COMPARISON
25.11
SUPPLIER ANALYSIS
25.12
COMPANY EVALUATION MATRIX: KEY PLAYERS,
25.12.1
STARS
25.12.2
EMERGING LEADERS
25.12.3
PERVASIVE PLAYERS
25.12.4
PARTICIPANTS
25.12.5
COMPANY FOOTPRINT: KEY PLAYERS,
25.12.5.1
COMPANY FOOTPRINT
25.12.5.2
REGION FOOTPRINT
25.12.5.3
BY MOTOR TYPE FOOTPRINT
25.12.5.4
BY USAGE FOOTPRINT
25.13
COMPANY EVALUATION MATRIX: STARTUPS/SMES,
25.13.1
PROGRESSIVE COMPANIES
25.13.2
RESPONSIVE COMPANIES
25.13.3
DYNAMIC COMPANIES
25.13.4
STARTING BLOCKS
25.13.5
COMPETITIVE BENCHMARKING
25.13.5.1
DETAILED LIST OF KEY STARTUPS/SMES
25.13.5.2
COMPETITIVE BENCHMARKING OF KEY STARTUPS/SMES
25.14
COMPETITIVE SCENARIO
25.14.1
PRODUCT LAUNCHES
25.14.2
DEALS
25.14.3
EXPANSIONS
26
COMPANY PROFILES
IN-DEPTH REVIEW OF COMPANIES, PRODUCTS, RECENT INITIATIVES, AND POSITIONING STRATEGIES IN EBIKE MARKET LANDSCAPE
26.1
KEY PLAYERS
26.1.1
E-BIKE MANUFACTURERS
26.1.1.1
ACCELL GROUP N.V.
26.1.1.2
GIANT MANUFACTURING CO. LTD.
26.1.1.3
YADEA GROUP HOLDINGS LTD.
26.1.1.4
YAMAHA MOTOR COMPANY
26.1.1.5
PEDEGO ELECTRIC BIKES
26.1.1.6
PON.BIKE
26.1.1.7
AIMA TECHNOLOGY GROUP CO. LTD.
26.1.1.8
MERIDA INDUSTRY CO. LTD
26.1.1.9
TREK BICYCLE CORPORATION
26.1.1.10
SPECIALIZED BICYCLE COMPONENTS, INC.
26.1.1.11
ANANDA DRIVE TECHNIQUES (SHANGHAI) CO., LTD
26.1.2
ADDITIONAL COMPANIES
26.1.2.1
HERO LECTRO E-CYCLES
26.1.2.2
STORMER
26.1.2.3
COWBOY
26.1.2.4
FUJI-TA BICYCLE CO., LTD
26.1.2.5
ELECTRIC BIKE COMPANY
26.1.2.6
RAD POWER BIKES LLC
26.1.2.7
VANMOOF
26.1.2.8
BH BIKES
26.1.2.9
BROMPTON BICYCLE LTD.
26.1.2.10
RIESE & MÜLLER GMBH
26.1.3
E-BIKE COMPONENT SUPPLIERS
26.1.3.1
BOSCH
26.1.3.2
FAZUA
26.1.3.3
SRAM
26.1.3.4
BAFANG
26.1.3.5
BROSE FAHRZEUGTEILE
26.1.3.6
SHIMANO
26.1.3.7
JOHNSON MATTHEY BATTERY SYSTEMS
26.1.3.8
PROMOVEC A/S
26.1.3.9
MAHLE GMBH
26.1.3.10
BMZ GMBH
26.1.3.11
WUXI TRUCKRUN MOTOR CO.
26.1.3.12
TQ
26.1.3.13
ZF
26.1.3.14
SAMSUNG SDI CO. LTD.
26.1.3.15
PANASONIC CORPORATION
27
RESEARCH METHODOLOGY
27.1
RESEARCH DATA
27.1.1
SECONDARY DATA
27.1.1.1
KEY DATA FROM SECONDARY SOURCES
27.1.2
PRIMARY DATA
27.1.2.1
KEY DATA FROM PRIMARY SOURCES
27.1.2.2
KEY PRIMARY PARTICIPANTS
27.1.2.3
BREAKDOWN OF PRIMARY INTERVIEWS
27.1.2.4
KEY INDUSTRY INSIGHTS
27.2
MARKET SIZE ESTIMATION
27.2.1
BOTTOM-UP APPROACH
27.2.2
TOP-DOWN APPROACH
27.2.3
BASE NUMBER CALCULATION
27.3
MARKET FORECAST APPROACH
27.3.1
SUPPLY SIDE
27.3.2
DEMAND SIDE
27.4
DATA TRIANGULATION
27.5
FACTOR ANALYSIS
27.6
RESEARCH ASSUMPTIONS
27.7
RESEARCH LIMITATIONS AND RISK ASSESSMENT
28
APPENDIX
Methodology
Various secondary sources, directories, and databases were used to identify and collect information for an extensive ebike market study. The study involved four main activities in estimating the current size of the ebike market: secondary research, validation through primary research, assumptions, and market analysis. The research study drew on secondary sources such as company annual reports and presentations, industry association publications, ebike magazine articles, directories, technical handbooks, the World Economic Outlook, trade websites, technical articles, and databases to identify and collect information for an extensive study of the ebike market. Primary sources, including experts from related industries, automobile OEMs, and suppliers, were interviewed to obtain and verify critical information and to assess prospects and market estimates.
Secondary Research
Secondary sources for this research study included the ebike industry associations, internal databases, corporate filings (such as annual reports, investor presentations, and financial statements), and data from trade and business publications. Secondary data was collected and analyzed to determine the overall market size, and the findings were further validated by primary research.
Primary Research
In the primary research process, several interviews were conducted with market experts from the demand and supply sides across three major regions: North America, Europe, and Asia-Oceania. 30% of primary interviews were conducted with OEMs, and 70% with Tier-1.
Primary data was collected through questionnaires, emails, and telephone interviews. In the canvassing of primary sources, various departments within organizations, such as sales, operations, and administration, were included to provide a holistic viewpoint in the report. After interacting with industry experts, brief sessions were held with highly experienced independent consultants to validate the findings from the primary sources. These sessions, along with insights from in-house subject-matter experts, led to the conclusions described in the remainder of this report.
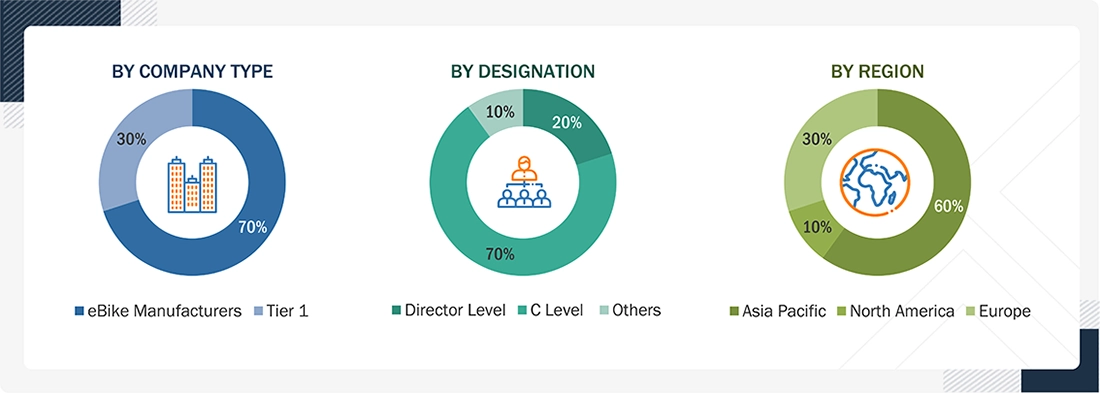
Note: Company tiers are based on the supply chain (Tier 1: component manufacturers; Tier 2: OEMs; Tier 3: ebike manufacturers). Other designations include sales, marketing, and product managers.
To know about the assumptions considered for the study, download the pdf brochure
Market Size Estimation
The bottom-up approach derived the market size based on volume and value. This was followed by primary interviews and feature mapping on a regional basis, using the MarketsandMarkets repository.
The market size was validated through in-depth interviews with industry experts, excerpts from the discussion guide in the appendix, and secondary research. The report-writing phase begins after the final market size numbers are determined.
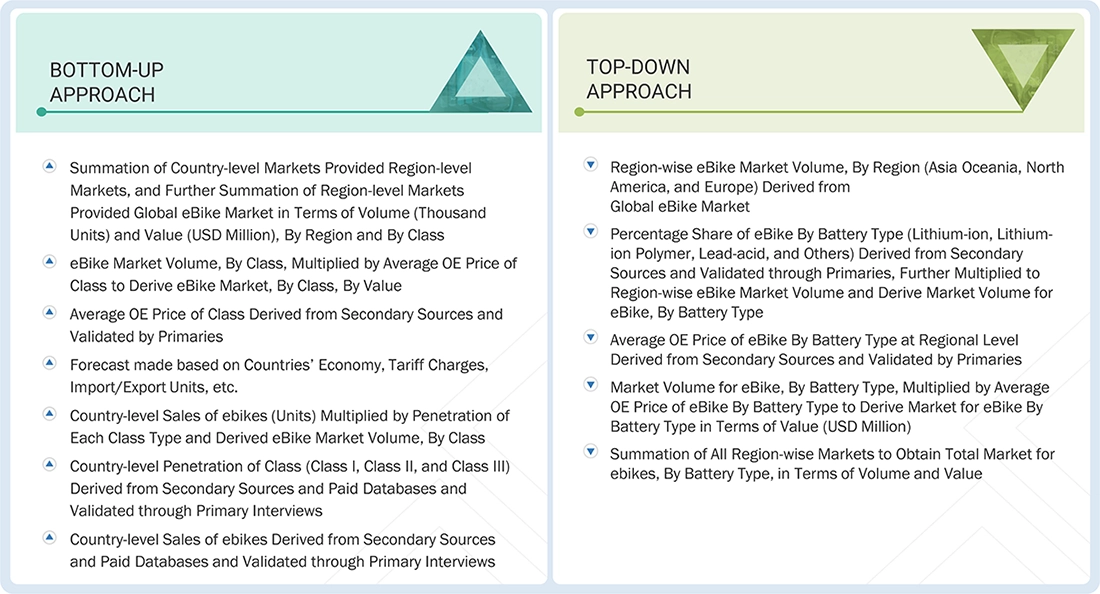
Bottom-Up Approach: By Usage
The bottom-up approach was used to estimate and validate the size of the ebike market by usage. Country-level ebike sales (in units) were derived from secondary sources such as country-wise manufacturing associations, paid databases, research publications and journals, and secondary articles, and were validated through primary interviews to determine the size of the ebike market by class and usage in terms of volume. Country-level penetration and usage types (mountain/trekking bikes, city/urban, cargo, and others) were derived from secondary sources and paid databases and validated through primary interviews.
The market is then forecast based on various parameters, including analysis of historical data, market trends, and growth drivers such as increasing bike sales, increased infrastructure development activities, economic conditions, and government incentives and subsidies. Technological advancements in e-bike motors, emerging market opportunities, and competitive landscape assessments are also considered to arrive at the country-wise forecast of e-bikes by usage.
Country-level ebike sales (in units) were multiplied by the penetration of each usage type to derive the ebike market volume by usage type. The average OE price by usage type was derived from secondary sources and validated by primary sources. The ebike market volume by usage type was then multiplied by the average OE usage price to derive the ebike market value by usage type (USD million). The summation of country-level markets provided the regional-level market. Further summation of the regional-level markets provided the global ebike market in terms of volume (thousand units) and value (USD million) by usage.
Top-Down Approach – By Battery Type
Regional market size estimates for ebikes by battery type were derived from the global ebike market by volume. The percentage share of ebikes by battery type (lithium-ion, lithium-ion polymer, lead-acid, and others) was derived from secondary sources and validated through primary research. This share was multiplied by the region-wise ebike market volume to derive the market volume for ebikes by battery type. The average OE price of an ebike by battery type at the regional level was derived from secondary sources and validated through primary research. The market volume for ebikes by battery type was then multiplied by the average OE price of ebikes to derive the market for ebikes by battery type in value (USD million). All region-wise markets were summed to obtain the total market for ebikes by battery type in volume (thousand units) and value (USD million).
A similar approach was followed to obtain the ebike market by motor type, mode, battery type, component, and speed.
ebike Market : Top-Down and Bottom-Up Approach
Data Triangulation
All percentage shares, splits, and breakdowns were determined using secondary sources and verified through primary sources. All parameters expected to affect the markets covered in this research study were accounted for, viewed in extensive detail, verified through primary research, and analyzed to obtain the final quantitative and qualitative data. This data was consolidated, supplemented with detailed inputs and analysis from MarketsandMarkets, and presented in the report.
Market Definition
An ebike is a bicycle equipped with a small electric motor and a rechargeable battery that assists the rider's pedaling power. The battery can be recharged by plugging it into a power source. Typically, an ebike takes about 6 to 8 hours to fully charge and can travel a distance of 35 to 50 kilometers at a speed of approximately 20 km/h.
Key Stakeholders
- ebike manufacturers
- ebike battery & motor manufacturers
- Component suppliers for ebikes
- Raw material suppliers for ebikes
- Country-level associations
- Traders, distributors, and suppliers of ebikes
Report Objectives
-
To define, describe, and forecast the size of the global ebike market in terms of value (USD million) and volume (thousand units)
- By Class (Class-I, Class-II, Class-III) at the regional level
- By Speed (up to 25 km/h, 25-45 km/h) at the regional level
- By Battery Type (Lithium-ion, Lithium-ion Polymer, Lead Acid, and Others) at the regional level
- By Motor Type (Hub and Mid) at the regional level
- By Mode (Pedal Assist and Throttle) at the regional level
- By Component (Batteries, Electric Motors, Frames with Forks, Wheels, Crank Gears, Brake Systems, and Motor Controller) at the regional level
- By Usage (Mountain/Trekking, City/Urban, Cargo, and Others) at the regional level
- By Ownership (Shared and Personal)
- By Battery Capacity (<250W, >250 & <450W, >450 & <650W, and >650W)
- By Motor Weight (<2 kg, >2 kg & <2.4 kg, >2.4 kg)
- By Motor Power (<40 Nm, >40 Nm-<70 Nm, >70 Nm)
- Country-level Analysis of Class-wise and Usage-wise segments (Asia Pacific, Europe, and North America)
- To understand the dynamics (drivers, restraints, opportunities, and challenges) of the market
- To strategically analyze market with trade analysis, pricing analysis, recession impact, case study analysis, patent analysis, technology analysis, regulatory analysis, key conferences and events, bill of material, the total cost of ownership, pricing analysis trends/disruptions impacting buyers, financial matrix, investment, and funding case scenario.
- To analyze the competitive landscape of the global players in the market, along with their market share/ranking
- To analyze the Competitive Evaluation Matrix of the global and regional ebike manufacturers and ebike component suppliers in the market
- To analyze a detailed listing of OEMs and their brands, OEM-wise technical specifications, mergers & acquisitions, partnerships, collaborations, expansions, and new product launches/developments undertaken by critical participants in the market.
Available customizations:
Along with the market data, MarketsandMarkets offers customizations per company-specific needs.
The following customization options are available for the report:
⚡ Growth Signals
Personalize This Research
- Triangulate with your Own Data
- Get Data as per your Format and Definition
- Gain a Deeper Dive on a Specific Application, Geography, Customer or Competitor
- Any level of Personalization
Let Us Help You
- What are the Known and Unknown Adjacencies Impacting the ebike Market
- What will your New Revenue Sources be?
- Who will be your Top Customer; what will make them switch?
- Defend your Market Share or Win Competitors
- Get a Scorecard for Target Partners


JIM NAAS
PRODUCT DIRECTOR, WEASLER
Weasler Engineering, a CentroMotion organization
Global Provider of Industrial Actuation & Control Solutions
Our organization was interested in learning more about the attractiveness of a particular market space. We contacted MarketsandMarkets to help us based on previous positive experiences we had with them. The results did not disappoint! We discussed our objectives with them, and the team at MarketsandMarkets developed and executed a proposal that met our needs precisely. We were very impressed by their level of expertise, the quality of the analysis and their insightful recommendations. We would not hesitate in working with them again in the future.

Matt Kardel,
Vice President
Aptiv,
A global technology company that develops safer, greener and more connected solutions.
We contracted with MarketsandMarkets to evaluate the value chain and potential go-to-market partners related to our interest in the Fleet Management space. The team successfully completed the work on time and at the pricing agreed. MarketsandMarkets listened and understood our objectives and collaborated well with us to help us get the visibility we needed to make an investment.
We have subsequently used MarketsandMarkets again related to Smart Cities to good results.
What the ebike Report Didn't Show You?
Explore the strategic intelligence behind the ebike Market
- 🏆 Competitors
- 🎯 Opportunities
- 📈 Growth Signals
Generate 15+ consulting-grade insights instantly
Powered by 17 years of MarketsandMarkets intelligence
