






- DESCRIPTION
- TABLE OF CONTENTS
- METHODOLOGY
- DOWNLOAD PDF
Phototherapy Equipment Market by Product (Conventional Phototherapy Equipment, Fiber-Optic Phototherapy Equipment), Application (Neonatal Jaundice, Skin Diseases (Psoriasis, Vitiligo)), End User (Hospitals, Homecare Settings) - Global Forecast to 2031

USD 0.62 BN
MARKET SIZE, 250



PHOTOTHERAPY EQUIPMENT MARKET SIZE, SHARE & GROWTH SNAPSHOT
Source: Secondary Research, Interviews with Experts, MarketsandMarkets Analysis
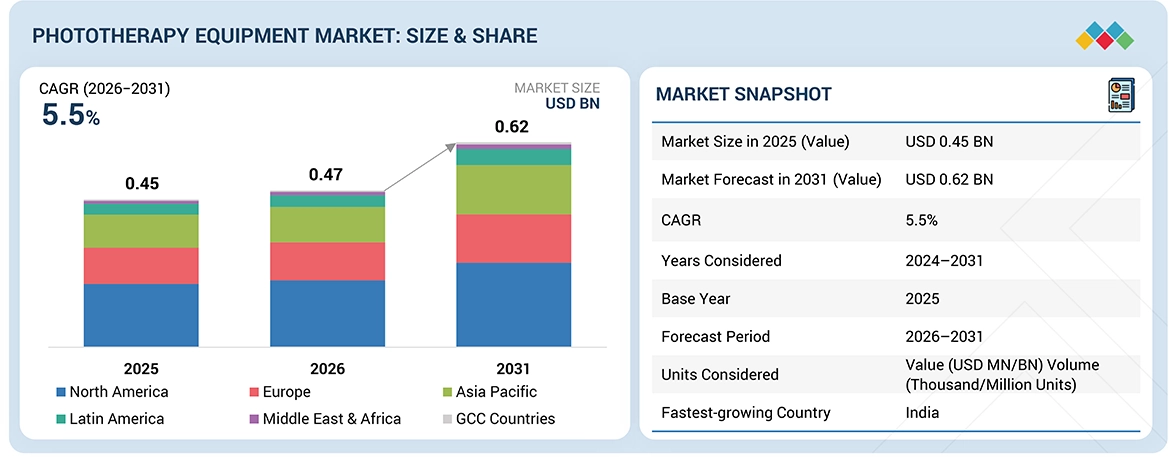
The global phototherapy equipment market is projected to grow from USD 0.47 billion in 2026 to USD 0.62 billion by 2031, at a CAGR of 5.5% during the forecast period. The market was valued at USD 0.45 billion in 2025. The rising incidence of preterm births worldwide is a critical driver of demand for phototherapy equipment. Preterm infants are at a higher risk of developing neonatal jaundice due to their underdeveloped liver function, which limits their ability to process and eliminate bilirubin effectively. As a result, these infants often require immediate and intensive phototherapy treatment in neonatal intensive care units (NICUs). The growing number of preterm deliveries, influenced by factors such as maternal health conditions, lifestyle changes, and advanced maternal age, is increasing the burden on neonatal care facilities. Consequently, hospitals are expanding their NICU capacities and investing in advanced phototherapy systems to manage the rising patient load. Furthermore, the need for continuous monitoring and precise treatment in preterm infants is driving the adoption of technologically advanced devices with improved safety features. This trend is expected to sustain long-term demand for phototherapy equipment, particularly in regions with high preterm birth rates and improving neonatal care infrastructure.
KEY TAKEAWAYS
-
BY Country
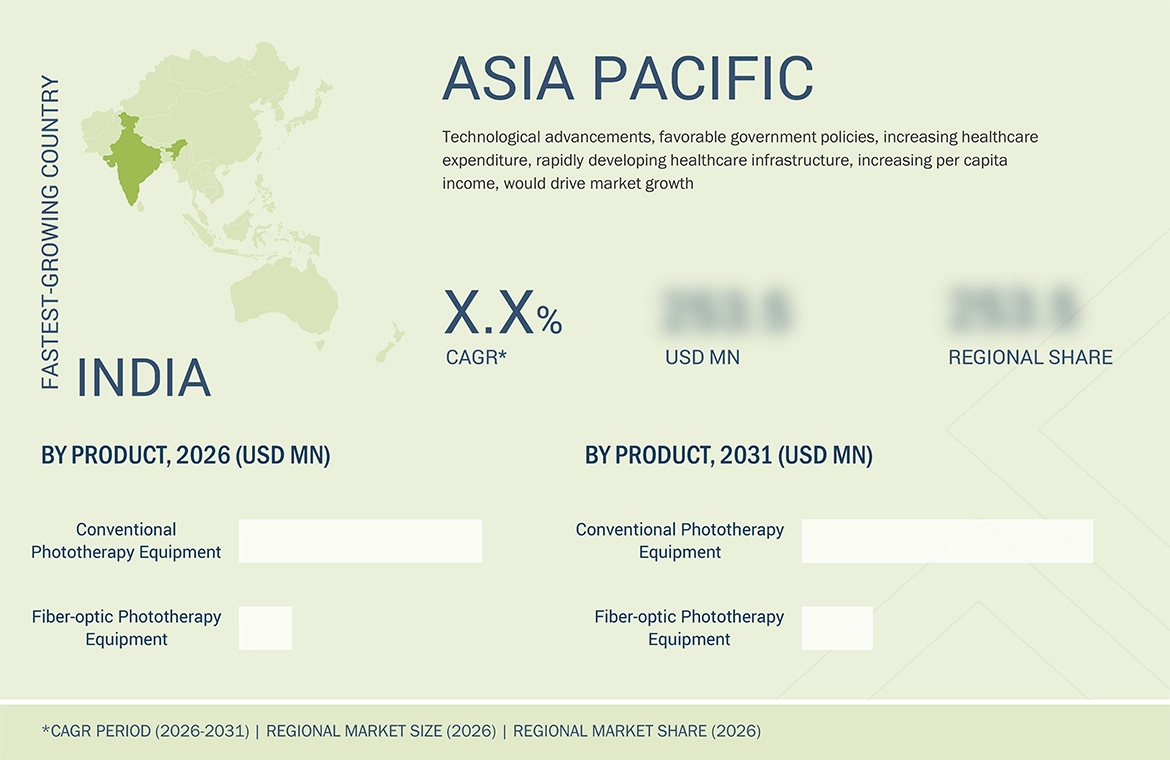
India is expected to register the highest CAGR of 8.0% during the forecast period.
-
BY PRODUCT
By product, the conventional phototherapy equipment led the market, accounting for a share of 80.0% in 2026.
-
BY APPLICATION
By application, skin diseases are expected to record a higher CAGR during forecast period.
-
BY END USER
By end user, hospitals are likely to register the highest CAGR during the forecast period.
-
COMPETITIVE LANDSCAPE - KEY PLAYERS
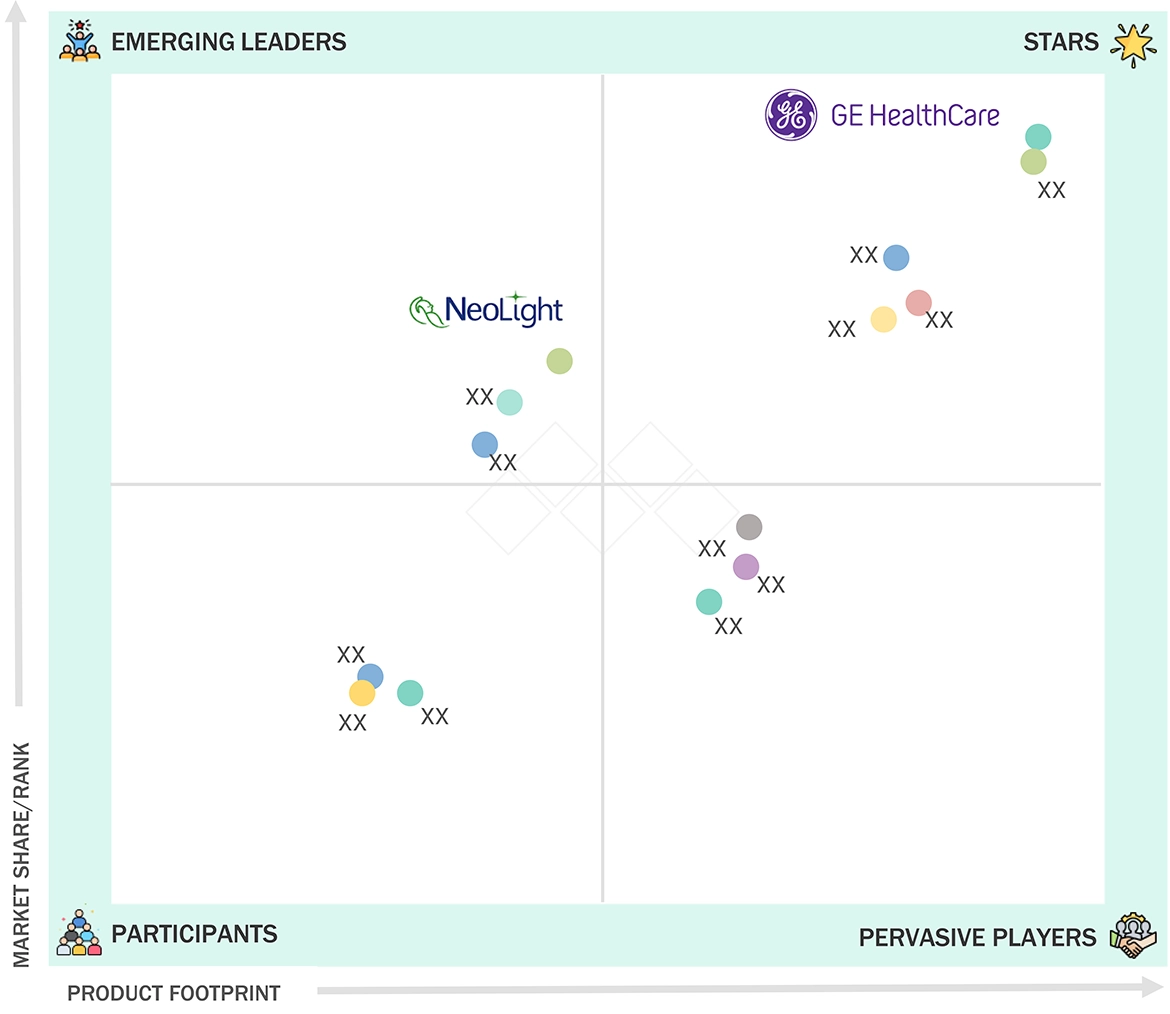
Drägerwerk AG & Co. KGaA (Germany), GE HealthCare (US), Natus Medical (US), Phothera (US) and Shanghai SIGMA High-tech (China) were identified as Star players in the phototheraoy equipment market, as they emphasis more on innovation and have broad industry coverage and strong operational and financial strength.
-
COMPETITIVE LANDSCAPE - STARTUPS/SMES
Neolight (US), Fanem (Brazil), Phoenix Medical Systems (India) are among a few key startups and SMEs due to their strong product portfolio and business strategies.
Rapid advancements in healthcare infrastructure across emerging economies are significantly driving the growth of the phototherapy equipment market. Governments and private sector stakeholders in regions such as the Asia Pacific, Latin America, the Middle East, and Africa are investing heavily in hospitals, maternity centers, and neonatal intensive care units. These efforts aim to improve maternal and child healthcare outcomes, which naturally boost the adoption of phototherapy devices. Moreover, rising healthcare spending and broader health insurance coverage are making advanced treatments more accessible. International health organizations and public health initiatives also contribute by equipping facilities with essential neonatal care technologies, including phototherapy systems. As a result, underserved regions are experiencing increased demand for affordable and reliable phototherapy solutions. This growth not only expands market presence but also opens doors for manufacturers to develop innovative, cost-effective devices tailored to local needs.
TRENDS & DISRUPTIONS IMPACTING CUSTOMERS' CUSTOMERS
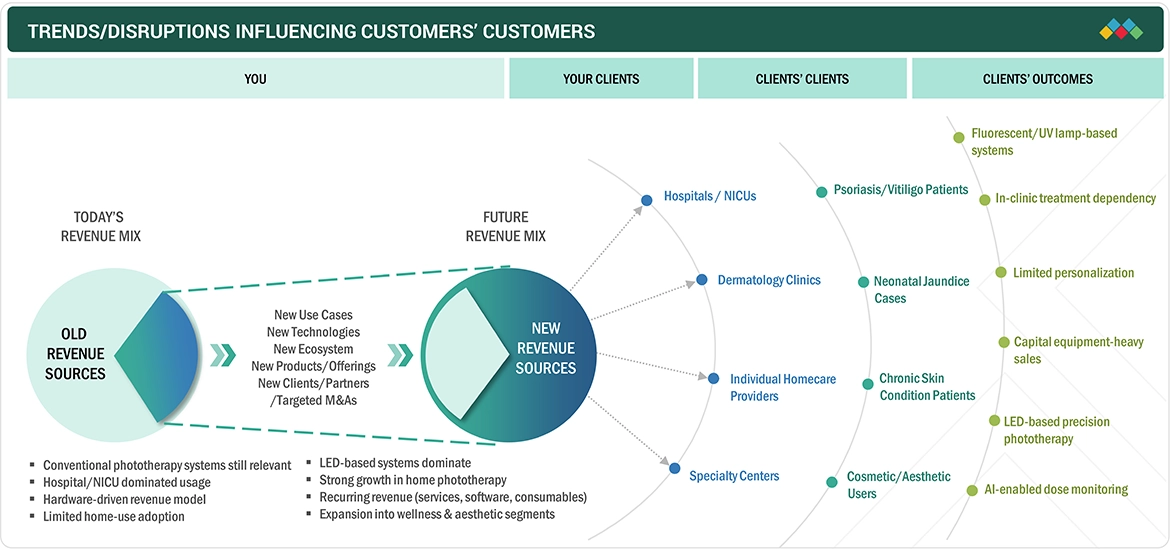
The phototherapy equipment market is evolving from traditional standalone light therapy systems toward connected, energy-efficient, and patient-centric treatment platforms that support dermatology, neonatal care, and home-based therapy. Rising demand for non-invasive treatment, LED-based technologies, and portable devices is reshaping customer expectations across hospitals, clinics, and home care settings. Digital ecosystems integrating remote monitoring, dose tracking, telehealth, and smart device connectivity are accelerating adoption. As healthcare providers prioritize precision, safety, and treatment convenience, manufacturers are focusing on compact designs, wearable solutions, software-enabled monitoring, strategic collaborations, and recurring service-based care models. The shift toward home phototherapy, personalized treatment protocols, and integrated clinical workflows is further driving innovation across dermatology and neonatal applications.
Source: Secondary Research, Interviews with Experts, MarketsandMarkets Analysis
MARKET DYNAMICS

OPPORTUNITIES
Impact
Level
-
Development of low-cost phototherapy equipment

-
Rising adoption of home phototherapy for skin diseases


-
Rising adoption of used and refurbished phototherapy equipment

Source: Secondary Research, Interviews with Experts, MarketsandMarkets Analysis
The increasing number of neonatal jaundice cases is a major driver for phototherapy demand. Neonatal jaundice occurs when a newborn’s liver is not mature enough to efficiently process bilirubin, leading to a yellowing of the skin and eyes. This condition is very common, especially in the first week of life, and requires prompt treatment to prevent complications like kernicterus, which can cause long-term brain damage. Phototherapy is the standard and most effective treatment, as it helps break down excess bilirubin in the blood using light exposure. With rising birth rates in many regions and improved diagnosis in hospitals, more cases are being detected and treated. Additionally, increased awareness among parents and healthcare professionals is leading to earlier intervention. This growing clinical need directly drives the demand for reliable, efficient, and widely available phototherapy equipment in hospitals and neonatal care units.
One of the key restraints in the phototherapy market is the availability and increasing use of alternative treatment methods. For neonatal jaundice, in some cases, exchange transfusion or pharmacological treatments may be considered depending on severity, reducing reliance on phototherapy. For skin disorders, patients often opt for topical creams, systemic medications, biologics, or immunosuppressants, which can provide faster or more convenient relief. These alternatives are often preferred due to ease of use, shorter treatment duration, or perceived effectiveness in severe cases. Additionally, advancements in dermatology have led to the development of highly targeted drug therapies that compete directly with phototherapy. As a result, in some clinical settings, phototherapy is not the first-line treatment. This shift in preference can limit the overall demand for phototherapy devices, especially in regions with strong pharmaceutical access and advanced healthcare systems.
The development of affordable phototherapy devices presents a major opportunity for market expansion. In many developing and low-income regions, high equipment costs limit access to advanced neonatal and dermatological care. By designing cost-effective phototherapy systems without compromising safety and performance, manufacturers can significantly expand their customer base. Innovations such as LED technology, simplified device design, and locally manufactured components can help reduce production costs. Governments and non-profit organizations are also supporting initiatives to improve neonatal care infrastructure, creating additional demand for low-cost solutions. Portable and easy-to-use devices are especially valuable in rural healthcare centers where specialized medical staff may be limited. This opportunity not only increases market penetration but also helps improve health outcomes in underserved populations by making essential treatment more widely accessible.
The increasing use of refurbished and second-hand phototherapy devices presents a challenge for manufacturers. Many healthcare providers, especially in cost-sensitive regions, opt for refurbished equipment due to lower upfront costs. While this improves affordability, it reduces demand for new devices and affects revenue growth for manufacturers. Additionally, refurbished equipment may not always meet the latest safety standards or technological advancements, which can impact treatment quality. Concerns about reliability, maintenance issues, and shorter lifespan can also arise. However, the strong price advantage of used equipment continues to make it attractive for smaller clinics and hospitals. This creates a competitive pressure on original equipment manufacturers (OEMs) to reduce prices or offer more value-added services. Without proper regulation or standardization of refurbished medical devices, this segment may continue to challenge the growth of new phototherapy equipment sales.
PHOTOTHERAPY EQUIPMENT MARKET: COMMERCIAL USE CASES ACROSS INDUSTRIES
| COMPANY | USE CASE DESCRIPTION | BENEFITS |
|---|---|---|
|
|
Develops advanced neonatal phototherapy systems used in NICUs for treating neonatal jaundice through controlled light exposure. Focuses on integration with incubators and monitoring systems (Market Intel) | High treatment precision | Seamless NICU integration | Improved patient safety | Energy-efficient systems |
|
|
Offers LED-based phototherapy devices such as bilirubin management systems for hospitals and neonatal care units, addressing hyperbilirubinemia in newborns (Market Data Forecast) | Advanced LED technology | Faster bilirubin reduction | Improved clinical outcomes | Global service network |
|
|
Provides neonatal phototherapy solutions including LED-based systems for hospitals and homecare settings, focusing on ease of use and flexibility (Market Intel) | User-friendly devices | Portable solutions | Reduced treatment time | High efficiency |
|
|
Manufactures neonatal care equipment, including phototherapy units designed for safe and continuous jaundice treatment in NICUs (MarkWide Research) | Reliable performance | Continuous therapy capability | High safety standards |
|
|
Provides NICU-compatible phototherapy systems like LED-based units used alongside warmers and incubators for newborn care (Phoenix Medical Systems) | Cost-effective solutions | Compatibility with NICU setups | Efficient light distribution |





Logos and trademarks shown above are the property of their respective owners. Their use here is for informational and illustrative purposes only.
MARKET ECOSYSTEM
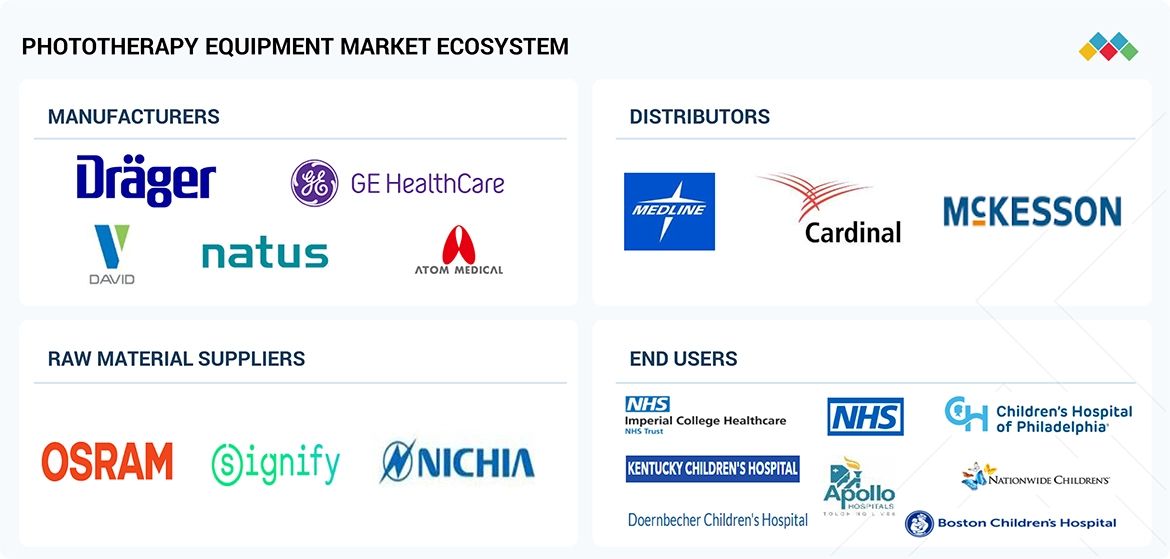
The ecosystem map of the overall phototherapy equipment market comprises the key elements present in the market and defines these elements through the involvement of various stakeholders. It includes phototherapy devices (such as LED-based systems, conventional fluorescent units, and fiber-optic devices), related consumables (including eye protection patches, disposable covers, and sensors), software-enabled control systems, and associated services. Manufacturers of phototherapy equipment include organizations engaged in research, product development, optimization, regulatory approval, and commercialization of devices. These companies may operate through in-house manufacturing facilities or collaborate with contract development and manufacturing organizations (CDMOs) for production and assembly. Distributors in this ecosystem include third-party distributors, medical device suppliers, wholesalers, and e-commerce platforms that facilitate the availability of phototherapy equipment across different regions. The research and development phase involves in-house R&D centers, academic and clinical research institutions, and technology partners contributing to innovations such as LED efficiency, wavelength precision, device portability, and integration with neonatal care systems. Regulatory authorities and certification bodies play a crucial role in ensuring compliance with safety, quality, and performance standards before market entry. The end users segment refers to the application areas where phototherapy equipment is deployed, including hospitals, neonatal intensive care units (NICUs), dermatology clinics, and home care settings. These end users represent primary demand drivers within the ecosystem. On the other hand, investors/funders, regulatory bodies, and government agencies act as major influencers in the phototherapy equipment market ecosystem, shaping product development, adoption rates, and geographic expansion strategies.
Logos and trademarks shown above are the property of their respective owners. Their use here is for informational and illustrative purposes only.
MARKET SEGMENTS
Source: Secondary Research, Interviews with Experts, MarketsandMarkets Analysis
Increasing awareness among healthcare professionals and parents regarding the importance of early diagnosis and treatment of neonatal jaundice and skin disorders is driving the adoption of phototherapy equipment. Educational campaigns, training programs, and improved clinical guidelines have enhanced the ability of healthcare providers to identify conditions requiring phototherapy at an early stage. Early detection allows for timely intervention, reducing the risk of complications and improving patient outcomes. In neonatal care, routine bilirubin screening has become a standard practice in many hospitals, leading to higher diagnosis rates and increased use of phototherapy devices. Similarly, in dermatology, greater awareness of treatment options is encouraging patients to seek medical advice and adhere to prescribed therapies. The growing role of digital health platforms and teleconsultations is further facilitating awareness and access to care. As knowledge about the benefits and safety of phototherapy continues to spread, its adoption is expected to increase across both developed and developing regions.
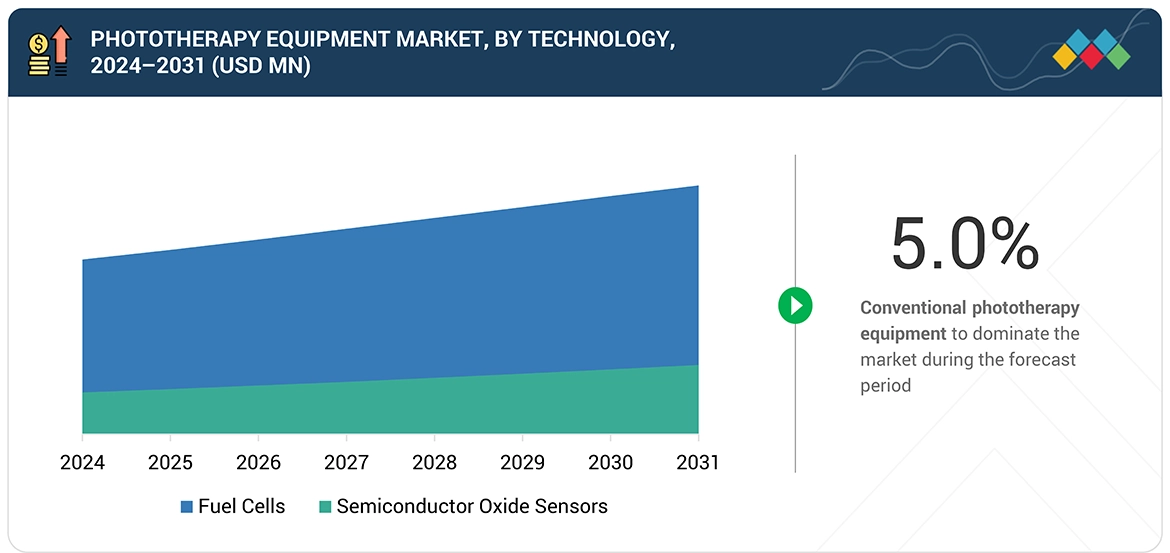
Conventional phototherapy equipment is designed with simplicity in mind, making it highly user-friendly for healthcare professionals across varying levels of expertise. Unlike advanced phototherapy technologies that may require specialized training or technical knowledge, conventional systems can be operated effectively with basic instruction. This ease of use is particularly beneficial in healthcare settings where skilled personnel may be limited, such as rural hospitals or understaffed clinics. Nurses and general practitioners can quickly learn to set up and monitor treatment, ensuring timely intervention for neonatal jaundice cases. The straightforward design also reduces the likelihood of operational errors, enhancing patient safety. Additionally, the minimal training requirement lowers the burden on healthcare institutions to invest in extensive staff education programs. This operational convenience makes conventional phototherapy systems a practical choice for high-volume healthcare environments, where efficiency and rapid response are critical. As a result, their simplicity significantly contributes to their continued preference and widespread adoption.
Hospitals account for the largest share in the phototherapy equipment market primarily due to the high volume of neonatal cases they manage. A significant proportion of births occur in hospital settings, especially in urban and semi-urban regions, leading to a steady influx of newborns requiring medical evaluation. Neonatal jaundice is one of the most common conditions observed in newborns, often requiring immediate intervention through phototherapy. Hospitals are typically the first point of diagnosis and treatment, ensuring that a large number of cases are managed within their facilities. Additionally, complicated or high-risk pregnancies are more likely to be handled in hospitals, increasing the probability of neonatal complications that require phototherapy. This continuous and high patient flow necessitates the availability of multiple phototherapy units to ensure timely treatment. As a result, hospitals consistently invest in such equipment, reinforcing their dominant share in the market.
REGION
India to be fastest-growing region market during forecast period
Healthcare infrastructure across the Asia Pacific is rapidly evolving, driven by economic growth and increasing government focus on public health. Countries like India, China, and Indonesia are investing heavily in building new hospitals, upgrading existing facilities, and expanding neonatal care services. The establishment of modern hospitals and specialty clinics in both urban and rural areas is improving access to advanced treatment options, including phototherapy. Additionally, private healthcare providers are entering the market, bringing in better infrastructure and advanced medical technologies. The growth of tier-2 and tier-3 cities as healthcare hubs is particularly significant, as these regions were previously underserved. With improved infrastructure comes increased procurement of essential neonatal care equipment, including phototherapy devices. This widespread expansion of healthcare facilities not only boosts accessibility but also drives consistent demand for equipment, making it a key contributor to the region’s rapid market growth.
PHOTOTHERAPY EQUIPMENT MARKET: COMPANY EVALUATION MATRIX
In the phototherapy equipment market, GE Healthcare (Star) has a strong and established product portfolio and a vast geographic presence. Neolight (Emerging Leader) has substantial product innovations compared to its competitors. While the company maintains a broad product portfolio, there is an opportunity to further strengthen and refine its growth strategy for business development.
Source: Secondary Research, Interviews with Experts, MarketsandMarkets Analysis
KEY MARKET PLAYERS
- Drägerwerk AG & Co. KGaA (Germany)
- GE HealthCare (US)
- Natus Medical (US)
- Atom Medical (Japan)
- Bistos (South Korea)
- Ningbo David (China)
- Phothera (US)
- STRATA Skin Sciences (US)
- Xuzhou Kernel Medical (China)
- Shanghai SIGMA High-tech (China)
- Ultralite Enterprises, Inc. (US)
- Hoenle Medical GmbH (Germany)
- Weyer (Germany)
- Neolight (US)
- Fanem (Brazil)
- Phoenix Medical Systems (India)
- Shenzhen Comen Medical Instruments Co. Ltd. (China)
- Theralight, Inc. (US)
- UV Technologies (UK)
- Curelight (Sweden)
- Photo Therapeutics Ltd (UK)
- Tiny Hearts Technology (Nigeria)
- Lifetrons Inno Equipments Pvt Ltd (India)
- Ibis Medical Equipment and Systems Pvt Ltd (India)
- Sci Health (Lithuania)
MARKET SCOPE
| REPORT METRIC | DETAILS |
|---|---|
| Market Size Value in 2025 (Value) | USD 0.45 Billion |
| Revenue Forecast in 2031 (Value) | USD 0.62 Billion |
| Growth Rate | 5.5% |
| Years Considered | 2024–2031 |
| Base Year | 2025 |
| Forecast Period | 2026–2031 |
| Units Considered | Value (USD MN/BN), Volume (Thousand Units) |
| Report Coverage | Revenue Forecast, Company Ranking, Competitive Landscape, Growth Factors, and Trends |
| Segments Covered | By Product: Conventional Phototherapy, Fiber-optic Phototherapy; By Application: Neonatal Jaundice, Skin Diseases (Psoriasis, Vitiligo, Eczema); By End User: Hospitals, Home Care Settings |
| Regions Covered | North America, Europe, Asia Pacific, Latin America, Middle East & Africa and GCC Countries |
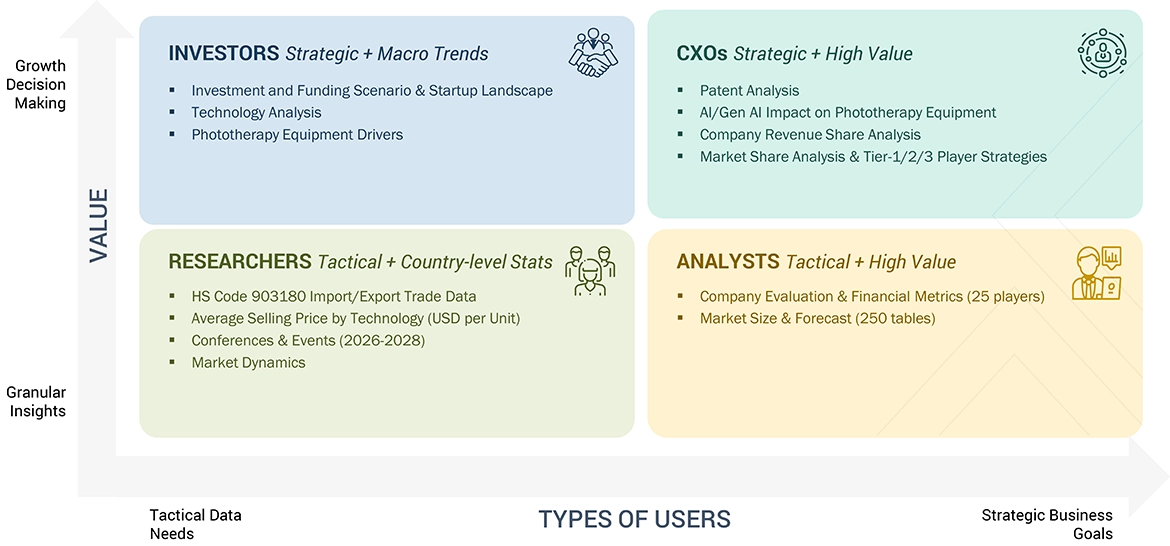
WHAT IS IN IT FOR YOU: PHOTOTHERAPY EQUIPMENT MARKET REPORT CONTENT GUIDE
DELIVERED CUSTOMIZATIONS
We have successfully delivered the following deep-dive customizations:
| CLIENT REQUEST | CUSTOMIZATION DELIVERED | VALUE ADDS |
|---|---|---|
| Product Analysis | Comparative analysis of phototherapy equipment technologies by type, including LED-based systems, conventional (fluorescent) phototherapy, and fiber optic devices, along with evaluation by applications such as neonatal jaundice management, psoriasis, vitiligo, eczema, and other dermatological conditions. | Assessment of device efficacy (irradiance levels, wavelength precision), treatment time, safety profile, portability (home vs hospital use), energy efficiency, maintenance requirements, and cost per treatment to support optimal product selection and clinical outcomes. |
| Company Information | Detailed profiles of leading global and regional phototherapy equipment manufacturers including GE HealthCare, Drager, Natus Medical, Phoenix Medical Systems, and Solarc Systems, covering product portfolios, technology platforms (LED innovation, fiber optic systems), regulatory approvals, geographic presence, partnerships, and recent product launches. | Competitive benchmarking across key players highlighting positioning by technology innovation (LED dominance), product performance, pricing strategies, distribution strength, and focus areas such as NICU vs dermatology vs homecare segments. |
| Geographic Analysis | In-depth regional assessment of the global phototherapy equipment market covering North America, Europe, Asia Pacific, Latin America, and Middle East & Africa, with analysis of healthcare infrastructure, neonatal care capacity, and dermatology treatment adoption trends. | Country-level market sizing, CAGR forecasts, neonatal birth rates and jaundice incidence analysis, dermatology disease prevalence, healthcare spending, and demand outlook across key markets such as the U.S., Germany, UK, China, India, and Brazil. |
RECENT DEVELOPMENTS
- February 2025 : Xuzhou Kernel Medical received FDA clearance for a 308nm Excimer Phototherapy Device. 308nm Excimer Phototherapy Device is intended to be used for the treatment of psoriasis and vitiligo.
- December 2024 : Shanghai SIGMA High-tech received FDA clearance for a UV phototherapy device.
- February 2025 : Shenzhen Kaiyan received FDA clearance for the CurrentBody LED 4-in-1 Zone Facial Mapping Mask. This Class II over-the-counter device is designed for targeted anti-aging, acne treatment, and skin rejuvenation.
- April 2025 : APK Technology received FDA clearance for an Ultraviolet Phototherapy Device.
Table of Contents
 Exclusive indicates content/data unique to MarketsandMarkets and not available with any competitors.
4
MARKET OVERVIEW
37
4.2.1.1
RISING INCIDENCE OF NEONATAL JAUNDICE
4.2.1.2
GROWING NUMBER OF PRETERM AND LOW-WEIGHT BIRTHS
4.2.1.3
RISING PREVALENCE OF SKIN DISEASES
4.2.1.4
LAUNCH OF TECHNOLOGICALLY ADVANCED PHOTOTHERAPY EQUIPMENT
4.2.1.5
RISING ADOPTION OF LED-BASED PHOTOTHERAPY EQUIPMENT
4.2.2.1
HIGH USE OF ALTERNATIVE MODES OF TREATMENT
4.2.2.2
STRINGENT REGULATORY POLICIES FOR NEW DEVICE APPROVAL
4.2.3.1
DEVELOPMENT OF LOW-COST PHOTOTHERAPY EQUIPMENT
4.2.3.2
RISING ADOPTION OF HOME PHOTOTHERAPY FOR TREATING SKIN DISEASES
4.2.4.1
RISING TREND OF PURCHASING REFURBISHED EQUIPMENT IN EMERGING MARKETS
4.2.4.2
LIMITED ADOPTION OF PHOTOTHERAPY EQUIPMENT IN DEVELOPING NATIONS
4.3
UNMET NEEDS AND WHITE SPACES
4.3.1
UNMET NEEDS IN PHOTOTHERAPY EQUIPMENT MARKET
4.3.2
WHITE SPACE OPPORTUNITIES
4.4
INTERCONNECTED MARKETS AND CROSS-SECTOR OPPORTUNITIES
4.4.1
INTERCONNECTED MARKETS
4.4.2
CROSS-SECTOR OPPORTUNITIES
4.5
STRATEGIC MOVES BY TIER-1/2/3 PLAYERS
5
INDUSTRY TRENDS
48
5.1
PORTER’S FIVE FORCES ANALYSIS
5.1.1
THREAT OF NEW ENTRANTS
5.1.2
THREAT OF SUBSTITUTES
5.1.3
BARGAINING POWER OF BUYERS
5.1.4
BARGAINING POWER OF SUPPLIERS
5.1.5
INTENSITY OF COMPETITIVE RIVALRY
5.2
MACROECONOMIC OUTLOOK
5.2.2
GDP TRENDS AND FORECAST
5.2.3
TRENDS IN GLOBAL NEONATAL & DERMATOLOGY CARE INDUSTRY
5.3
SUPPLY CHAIN ANALYSIS
5.6.1
AVERAGE SELLING PRICE TREND, BY KEY PLAYER (2025)
5.6.2
AVERAGE SELLING PRICE TREND, BY REGION (2024–2026)
5.7.1
IMPORT SCENARIO (HS CODE 9018090)
5.7.2
EXPORT SCENARIO (HS CODE 9018090)
5.8
KEY CONFERENCES AND EVENTS, 2026–2027
5.9
TRENDS/DISRUPTIONS IMPACTING CUSTOMERS’ BUSINESSES
5.10
INVESTMENT & FUNDING SCENARIO
5.11.1
CASE STUDY 1: SMART NICU UPGRADE AT BOSTON CHILDREN’S HOSPITAL
5.11.2
CASE STUDY 2: AFFORDABLE PHOTOTHERAPY EXPANSION IN RURAL INDIA
5.11.3
CASE STUDY 3: PREDICTIVE NEONATAL MONITORING AT MOUNT SINAI HOSPITAL, CANADA
5.12
IMPACT OF US TARIFFS—PHOTOTHERAPY EQUIPMENT MARKET
5.12.3
PRICE IMPACT ANALYSIS
5.12.4
IMPACT ON COUNTRIES/REGIONS
5.12.5
END-USE INDUSTRY IMPACT
6
TECHNOLOGICAL ADVANCEMENTS, AI-DRIVEN IMPACT, PATENTS, INNOVATIONS, AND FUTURE APPLICATIONS
67
6.1
KEY EMERGING TECHNOLOGIES
6.1.1
ADVANCED LED PHOTOTHERAPY SYSTEMS
6.1.2
FIBER-OPTIC & WEARABLE PHOTOTHERAPY TECHNOLOGIES
6.2
COMPLEMENTARY TECHNOLOGIES
6.2.1
BIOSENSOR & CHEMICAL SENSOR TECHNOLOGIES
6.2.2
POINT-OF-CARE & HOME CARE TREATMENT PLATFORMS
6.3
TECHNOLOGY/PRODUCT ROADMAP
6.3.1
SHORT-TERM (2025–2027) | FOUNDATION & EARLY COMMERCIALIZATION
6.3.2
MID-TERM (2027–2030) | EXPANSION & STANDARDIZATION
6.3.3
LONG-TERM (2030–2035+) | MASS COMMERCIALIZATION & DISRUPTION
6.4.1
INSIGHTS: JURISDICTION AND TOP APPLICANT ANALYSIS
6.5.1
AI-ENABLED SMART PHOTOTHERAPY & CONNECTED CARE SYSTEMS
6.5.2
NON-INVASIVE MEDICAL BREATH DIAGNOSTICS
6.5.3
NEXT-GENERATION LED & PRECISION PHOTOTHERAPY TECHNOLOGIES
6.6
IMPACT OF AI/GEN AI ON PHOTOTHERAPY EQUIPMENT MARKET
6.6.1
TOP USE CASES AND MARKET POTENTIAL
6.6.2
BEST PRACTICES FOLLOWED BY MANUFACTURERS/OEMS IN PHOTOTHERAPY EQUIPMENT MARKET
6.6.3
CASE STUDIES OF AI IMPLEMENTATION IN PHOTOTHERAPY EQUIPMENT
6.6.4
INTERCONNECTED ADJACENT ECOSYSTEMS AND IMPACT ON MARKET PLAYERS
6.6.5
CLIENTS’ READINESS TO ADOPT GENERATIVE AI IN PHOTOTHERAPY EQUIPMENT MARKET
7
CUSTOMER LANDSCAPE & BUYER BEHAVIOR
78
7.1
DECISION-MAKING PROCESS
7.2
KEY STAKEHOLDERS INVOLVED IN BUYING PROCESS AND THEIR EVALUATION CRITERIA
7.2.1
KEY STAKEHOLDERS IN BUYING PROCESS
7.2.2
KEY BUYING CRITERIA
7.3
ADOPTION BARRIERS & INTERNAL CHALLENGES
7.4
UNMET NEEDS OF VARIOUS END-USE INDUSTRIES
7.5.3
MARGIN OPPORTUNITIES IN KEY APPLICATIONS
8
REGULATORY LANDSCAPE
83
8.1
REGIONAL REGULATIONS AND COMPLIANCE
8.1.1
REGULATORY BODIES, GOVERNMENT AGENCIES, AND OTHER ORGANIZATIONS
9
PHOTOTHERAPY EQUIPMENT MARKET, BY PRODUCT
86
9.2
CONVENTIONAL PHOTOTHERAPY
9.2.1
AFFORDABILITY AND ACCESSIBILITY DRIVING CONTINUED USE OF CONVENTIONAL PHOTOTHERAPY EQUIPMENT
9.3
FIBER-OPTIC PHOTOTHERAPY
9.3.1
PARENT-FRIENDLY DESIGN AND HOME-BASED CARE DEMAND ACCELERATE GROWTH IN FIBER-OPTIC PHOTOTHERAPY
10
PHOTOTHERAPY EQUIPMENT MARKET, BY APPLICATION
92
10.2.1
INCREASING NUMBER OF PRETERM AND LOW-WEIGHT BIRTHS TO DRIVE MARKET GROWTH
10.3.1.1
RISING DEMAND FOR NON-INVASIVE THERAPIES AND TECHNOLOGICAL ADVANCEMENTS TO DRIVE MARKET
10.3.2.1
HIGH EFFECTIVENESS IN MANAGING VITILIGO DRIVES MARKET GROWTH
10.3.3.1
GROWING BURDEN OF PEDIATRIC ECZEMA TO SUPPORT DEMAND FOR PHOTOTHERAPY
11
PHOTOTHERAPY EQUIPMENT MARKET, BY END USER
101
11.2.1
RISING PATIENT ADMISSIONS AND ADVANCED TREATMENT INFRASTRUCTURE SUPPORT DOMINANCE OF HOSPITALS
11.3.1
INCREASING ADOPTION OF PORTABLE AND HOME-USE DEVICES TO DRIVE MARKET GROWTH
12
PHOTOTHERAPY EQUIPMENT MARKET, BY REGION
105
12.2.1.1
GOVERNMENT INITIATIVES AND TECHNOLOGICAL ADVANCEMENTS SUPPORTING MARKET GROWTH
12.2.2.1
EXPANSION OF NEONATAL CARE SERVICES AND HOME-BASED PHOTOTHERAPY ADOPTION DRIVING MARKET GROWTH
12.3.1.1
ADVANCED HEALTHCARE INFRASTRUCTURE AND INNOVATION LEADERSHIP DRIVING MARKET GROWTH
12.3.2.1
NHS MODERNIZATION AND INCREASING DERMATOLOGY TREATMENT DEMAND SUPPORTING MARKET GROWTH
12.3.3.1
PUBLIC HEALTHCARE INVESTMENTS AND RISING NEONATAL CARE DEMAND DRIVING MARKET GROWTH
12.3.4.1
HEALTHCARE MODERNIZATION AND RISING AWARENESS OF SKIN DISEASE TREATMENTS SUPPORTING MARKET GROWTH
12.3.5.1
RISING NEONATAL HEALTHCARE INVESTMENTS AND DERMATOLOGY TREATMENT ADOPTION ARE DRIVING GROWTH
12.4.1.1
HEALTHCARE EXPANSION AND DOMESTIC MEDICAL DEVICE MANUFACTURING DRIVING MARKET GROWTH
12.4.2.1
AGING POPULATION AND ADVANCED HEALTHCARE TECHNOLOGIES SUPPORTING MARKET GROWTH
12.4.3.1
RISING NEONATAL HEALTHCARE DEMAND AND GOVERNMENT HEALTHCARE INITIATIVES DRIVING MARKET GROWTH
12.4.4.1
EXPANSION OF NEONATAL HEALTHCARE PROGRAMS AND DERMATOLOGY SERVICES SUPPORTING MARKET GROWTH
12.4.5.1
TECHNOLOGICAL INNOVATION AND EXPANDING DERMATOLOGY CARE DRIVING MARKET GROWTH
12.4.6
REST OF ASIA PACIFIC
12.5.1.1
EXPANDING NEONATAL HEALTHCARE SERVICES AND GROWING DERMATOLOGY MARKET SUPPORTING GROWTH
12.5.2.1
HEALTHCARE MODERNIZATION AND INCREASING NEONATAL CARE AWARENESS DRIVING MARKET GROWTH
12.5.3
REST OF LATIN AMERICA
12.6
MIDDLE EAST & AFRICA
13
COMPETITIVE LANDSCAPE
153
13.2
KEY PLAYER STRATEGIES/RIGHT TO WIN
13.4
MARKET SHARE ANALYSIS
13.5
COMPANY EVALUATION MATRIX: KEY PLAYERS, 2025
13.5.5
COMPANY FOOTPRINT: KEY PLAYERS, 2025
13.5.5.1
COMPANY FOOTPRINT
13.5.5.2
REGION FOOTPRINT
13.5.5.3
PRODUCT FOOTPRINT
13.5.5.4
APPLICATION FOOTPRINT
13.5.5.5
END-USER FOOTPRINT
13.6
COMPETITIVE EVALUATION MATRIX: STARTUPS/SMES, 2025
13.6.1
PROGRESSIVE COMPANIES
13.6.2
RESPONSIVE COMPANIES
13.6.5
COMPETITIVE BENCHMARKING: STARTUPS/SMES, 2025
13.6.5.1
DETAILED LIST OF KEY STARTUPS/SMES
13.6.5.2
COMPETITIVE BENCHMARKING OF STARTUPS/SMES
13.7
COMPANY VALUATION AND FINANCIAL METRICS
13.9
COMPETITIVE SCENARIO
13.9.1
PRODUCT LAUNCHES & APPROVALS
14
COMPANY PROFILES
171
14.1.1.1
BUSINESS OVERVIEW
14.1.1.2
PRODUCTS OFFERED
14.1.1.3.2
STRATEGIC CHOICES
14.1.1.3.3
WEAKNESSES AND COMPETITIVE THREATS
14.1.2
DRÄGERWERK AG & CO. KGAA
14.1.5
SHANGHAI SIGMA HIGH-TECH CO., LTD.
14.1.7
PHOENIX MEDICAL SYSTEMS
14.2.1
NINGBO DAVID MEDICAL DEVICE CO., LTD.
14.2.2
STRATA SKIN SCIENCES
14.2.3
XUZHOU KERNEL MEDICAL EQUIPMENT CO., LTD.
14.2.4
ULTRALITE ENTERPRISES, INC.
14.2.5
HOENLE MEDICAL GMBH
14.2.7
SHENZHEN COMEN MEDICAL INSTRUMENTS CO., LTD.
14.2.11
PHOTO THERAPEUTICS LTD
14.2.12
TINY HEARTS TECHNOLOGY
14.2.13
LIFETRONS INNO EQUIPMENTS PVT LTD
14.2.14
IBIS MEDICAL EQUIPMENT AND SYSTEMS PVT LTD
15
RESEARCH METHODOLOGY
208
15.1.1.1
KEY DATA FROM SECONDARY SOURCES
15.1.2.1
KEY DATA FROM PRIMARY SOURCES
15.1.2.2
KEY INDUSTRY INSIGHTS
15.2
MARKET SIZE ESTIMATION
15.3
MARKET BREAKDOWN AND DATA TRIANGULATION
15.4
MARKET SHARE ESTIMATION
15.6
METHODOLOGY-RELATED LIMITATIONS
15.8
RESEARCH LIMITATIONS
16.2
KNOWLEDGESTORE: MARKETSANDMARKETS’ SUBSCRIPTION PORTAL
16.3
CUSTOMIZATION OPTIONS
TABLE 1
STANDARD CURRENCY CONVERSION RATES TO USD
TABLE 2
PHOTOTHERAPY EQUIPMENT MARKET: PORTER’S FIVE FORCES ANALYSIS
TABLE 3
GDP PERCENTAGE CHANGE, BY KEY COUNTRY, 2021–2030
TABLE 4
AVERAGE SELLING PRICE TREND OF PHOTOTHERAPY PRODUCTS, BY KEY PLAYER 2025 (USD)
TABLE 5
AVERAGE PRICING TREND OF PHOTOTHERAPY PRODUCTS, BY REGION, 2024–2026 (USD)
TABLE 6
IMPORT DATA FOR PHOTOTHERAPY EQUIPMENT PRODUCTS UNDER HS CODE 9018090, BY COUNTRY, 2021–2025 (USD THOUSAND)
TABLE 7
EXPORT DATA FOR PHOTOTHERAPY EQUIPMENT UNDER HS CODE 903180, BY COUNTRY, 2020–2024 (USD THOUSAND)
TABLE 8
PHOTOTHERAPY EQUIPMENT MARKET: DETAILED LIST OF KEY CONFERENCES AND EVENTS (2026-2027)
TABLE 9
US-ADJUSTED RECIPROCAL TARIFF RATES
TABLE 10
KEY PRODUCT-RELATED TARIFF EFFECTIVE FOR PHOTOTHERAPY EQUIPMENT
TABLE 11
TOP USE CASES AND MARKET POTENTIAL
TABLE 12
PHOTOTHERAPY EQUIPMENT MARKET: CASE STUDIES RELATED TO AI IMPLEMENTATION
TABLE 13
INTERCONNECTED ADJACENT ECOSYSTEMS AND IMPACT ON MARKET PLAYERS
TABLE 14
INFLUENCE OF KEY STAKEHOLDERS ON BUYING PROCESS OF PHOTOTHERAPY EQUIPMENT
TABLE 15
KEY BUYING CRITERIA FOR PHOTOTHERAPY EQUIPMENT
TABLE 16
PHOTOTHERAPY EQUIPMENT MARKET: UNMET NEEDS/END-USER EXPECTATIONS
TABLE 17
NORTH AMERICA: REGULATORY BODIES, GOVERNMENT AGENCIES, AND OTHER ORGANIZATIONS
TABLE 18
EUROPE: REGULATORY BODIES, GOVERNMENT AGENCIES, AND OTHER ORGANIZATIONS
TABLE 19
ASIA PACIFIC: REGULATORY BODIES, GOVERNMENT AGENCIES, AND OTHER ORGANIZATIONS
TABLE 20
LATIN AMERICA: REGULATORY BODIES, GOVERNMENT AGENCIES, AND OTHER ORGANIZATIONS
TABLE 21
MIDDLE EAST & AFRICA AND GCC COUNTRIES: REGULATORY BODIES, GOVERNMENT AGENCIES, AND OTHER ORGANIZATIONS
TABLE 22
GLOBAL STANDARDS IN PHOTOTHERAPY EQUIPMENT MARKET
TABLE 23
PHOTOTHERAPY EQUIPMENT MARKET, BY PRODUCT, 2024–2031 (USD MILLION)
TABLE 24
CONVENTIONAL PHOTOTHERAPY EQUIPMENT MARKET, BY COUNTRY, 2024–2031 (USD MILLION)
TABLE 25
CONVENTIONAL PHOTOTHERAPY EQUIPMENT MARKET VOLUME, BY REGION, 2024–2031 (UNITS)
TABLE 26
FIBER-OPTIC PHOTOTHERAPY EQUIPMENT MARKET, BY COUNTRY, 2024–2031 (USD MILLION)
TABLE 27
FIBER-OPTIC PHOTOTHERAPY EQUIPMENT MARKET VOLUME, BY REGION, 2024–2031 (UNITS)
TABLE 28
PHOTOTHERAPY EQUIPMENT MARKET, BY APPLICATION, 2024–2031 (USD MILLION)
TABLE 29
PHOTOTHERAPY EQUIPMENT MARKET FOR NEONATAL JAUNDICE, BY COUNTRY, 2024–2031 (USD MILLION)
TABLE 30
PHOTOTHERAPY EQUIPMENT MARKET FOR SKIN DISEASES, BY TYPE, 2024–2031 (USD MILLION)
TABLE 31
PHOTOTHERAPY EQUIPMENT MARKET FOR SKIN DISEASES, BY COUNTRY, 2024–2031 (USD MILLION)
TABLE 32
PHOTOTHERAPY EQUIPMENT MARKET FOR PSORIASIS, BY COUNTRY, 2024–2031 (USD MILLION)
TABLE 33
PHOTOTHERAPY EQUIPMENT MARKET FOR VITILIGO, BY COUNTRY, 2024–2031 (USD MILLION)
TABLE 34
PHOTOTHERAPY EQUIPMENT MARKET FOR ECZEMA, BY COUNTRY, 2024–2031 (USD MILLION)
TABLE 35
PHOTOTHERAPY EQUIPMENT MARKET BY END USER, 2024–2031 (USD MILLION)
TABLE 36
PHOTOTHERAPY EQUIPMENT MARKET FOR HOSPITALS, BY COUNTRY, 2024–2031 (USD MILLION)
TABLE 37
PHOTOTHERAPY EQUIPMENT MARKET FOR HOME CARE SETTINGS, BY COUNTRY, 2024–2031 (USD MILLION)
TABLE 38
PHOTOTHERAPY EQUIPMENT MARKET, BY REGION, 2024–2031 (USD MILLION)
TABLE 39
NORTH AMERICA: PHOTOTHERAPY EQUIPMENT MARKET, BY COUNTRY, 2024–2031 (USD MILLION)
TABLE 40
NORTH AMERICA: PHOTOTHERAPY EQUIPMENT MARKET, BY PRODUCT, 2024–2031 (USD MILLION)
TABLE 41
NORTH AMERICA: PHOTOTHERAPY EQUIPMENT MARKET, BY APPLICATION, 2024–2031 (USD MILLION)
TABLE 42
NORTH AMERICA: PHOTOTHERAPY EQUIPMENT MARKET FOR SKIN DISEASES, BY TYPE, 2024–2031 (USD MILLION)
TABLE 43
NORTH AMERICA: PHOTOTHERAPY EQUIPMENT MARKET, BY END USER, 2024–2031 (USD MILLION)
TABLE 44
US: PHOTOTHERAPY EQUIPMENT MARKET, BY PRODUCT, 2024–2031 (USD MILLION)
TABLE 45
US: PHOTOTHERAPY EQUIPMENT MARKET, BY APPLICATION, 2024–2031 (USD MILLION)
TABLE 46
US: PHOTOTHERAPY EQUIPMENT MARKET FOR SKIN DISEASES, BY TYPE, 2024–2031 (USD MILLION)
TABLE 47
US: PHOTOTHERAPY EQUIPMENT MARKET, BY END USER, 2024–2031 (USD MILLION)
TABLE 48
CANADA: PHOTOTHERAPY EQUIPMENT MARKET, BY PRODUCT, 2024–2031 (USD MILLION)
TABLE 49
CANADA: PHOTOTHERAPY EQUIPMENT MARKET, BY APPLICATION, 2024–2031 (USD MILLION)
TABLE 50
CANADA: PHOTOTHERAPY EQUIPMENT MARKET FOR SKIN DISEASES, BY TYPE, 2024–2031 (USD MILLION)
TABLE 51
CANADA: PHOTOTHERAPY EQUIPMENT MARKET, BY END USER, 2024–2031 (USD MILLION)
TABLE 52
EUROPE: PHOTOTHERAPY EQUIPMENT MARKET, BY COUNTRY, 2024–2031 (USD MILLION)
TABLE 53
EUROPE: PHOTOTHERAPY EQUIPMENT MARKET, BY PRODUCT, 2024–2031 (USD MILLION)
TABLE 54
EUROPE: PHOTOTHERAPY EQUIPMENT MARKET, BY APPLICATION, 2024–2031 (USD MILLION)
TABLE 55
EUROPE: PHOTOTHERAPY EQUIPMENT MARKET FOR SKIN DISEASES, BY TYPE, 2024–2031 (USD MILLION)
TABLE 56
EUROPE: PHOTOTHERAPY EQUIPMENT MARKET, BY END USER, 2024–2031 (USD MILLION)
TABLE 57
GERMANY: PHOTOTHERAPY EQUIPMENT MARKET, BY PRODUCT, 2024–2031 (USD MILLION)
TABLE 58
GERMANY: PHOTOTHERAPY EQUIPMENT MARKET, BY APPLICATION, 2024–2031 (USD MILLION)
TABLE 59
GERMANY: PHOTOTHERAPY EQUIPMENT MARKET FOR SKIN DISEASES, BY TYPE, 2024–2031 (USD MILLION)
TABLE 60
GERMANY: PHOTOTHERAPY EQUIPMENT MARKET, BY END USER, 2024–2031 (USD MILLION)
TABLE 61
UK: PHOTOTHERAPY EQUIPMENT MARKET, BY PRODUCT, 2024–2031 (USD MILLION)
TABLE 62
UK: PHOTOTHERAPY EQUIPMENT MARKET, BY APPLICATION, 2024–2031 (USD MILLION)
TABLE 63
UK: PHOTOTHERAPY EQUIPMENT MARKET FOR SKIN DISEASES, BY TYPE, 2024–2031 (USD MILLION)
TABLE 64
UK: PHOTOTHERAPY EQUIPMENT MARKET, BY END USER, 2024–2031 (USD MILLION)
TABLE 65
FRANCE: PHOTOTHERAPY EQUIPMENT MARKET, BY PRODUCT, 2024–2031 (USD MILLION)
TABLE 66
FRANCE: PHOTOTHERAPY EQUIPMENT MARKET, BY APPLICATION, 2024–2031 (USD MILLION)
TABLE 67
FRANCE: PHOTOTHERAPY EQUIPMENT MARKET FOR SKIN DISEASES, BY TYPE, 2024–2031 (USD MILLION)
TABLE 68
FRANCE: PHOTOTHERAPY EQUIPMENT MARKET, BY END USER, 2024–2031 (USD MILLION)
TABLE 69
ITALY: PHOTOTHERAPY EQUIPMENT MARKET, BY PRODUCT, 2024–2031 (USD MILLION)
TABLE 70
ITALY: PHOTOTHERAPY EQUIPMENT MARKET, BY APPLICATION, 2024–2031 (USD MILLION)
TABLE 71
ITALY: PHOTOTHERAPY EQUIPMENT MARKET FOR SKIN DISEASES, BY TYPE, 2024–2031 (USD MILLION)
TABLE 72
ITALY: PHOTOTHERAPY EQUIPMENT MARKET, BY END USER, 2024–2031 (USD MILLION)
TABLE 73
SPAIN: PHOTOTHERAPY EQUIPMENT MARKET, BY PRODUCT, 2024–2031 (USD MILLION)
TABLE 74
SPAIN: PHOTOTHERAPY EQUIPMENT MARKET, BY APPLICATION, 2024–2031 (USD MILLION)
TABLE 75
SPAIN: PHOTOTHERAPY EQUIPMENT MARKET FOR SKIN DISEASES, BY TYPE, 2024–2031 (USD MILLION)
TABLE 76
SPAIN: PHOTOTHERAPY EQUIPMENT MARKET, BY END USER, 2024–2031 (USD MILLION)
TABLE 77
REST OF EUROPE: PHOTOTHERAPY EQUIPMENT MARKET, BY PRODUCT, 2024–2031 (USD MILLION)
TABLE 78
REST OF EUROPE: PHOTOTHERAPY EQUIPMENT MARKET, BY APPLICATION, 2024–2031 (USD MILLION)
TABLE 79
REST OF EUROPE: PHOTOTHERAPY EQUIPMENT MARKET FOR SKIN DISEASES, BY TYPE, 2024–2031 (USD MILLION)
TABLE 80
REST OF EUROPE: PHOTOTHERAPY EQUIPMENT MARKET, BY END USER, 2024–2031 (USD MILLION)
TABLE 81
ASIA PACIFIC: PHOTOTHERAPY EQUIPMENT MARKET, BY COUNTRY, 2024–2031 (USD MILLION)
TABLE 82
ASIA PACIFIC: PHOTOTHERAPY EQUIPMENT MARKET, BY PRODUCT, 2024–2031 (USD MILLION)
TABLE 83
ASIA PACIFIC: PHOTOTHERAPY EQUIPMENT MARKET, BY APPLICATION, 2024–2031 (USD MILLION)
TABLE 84
ASIA PACIFIC: PHOTOTHERAPY EQUIPMENT MARKET FOR SKIN DISEASES, BY TYPE, 2024–2031 (USD MILLION)
TABLE 85
ASIA PACIFIC: PHOTOTHERAPY EQUIPMENT MARKET, BY END USER, 2024–2031 (USD MILLION)
TABLE 86
CHINA: PHOTOTHERAPY EQUIPMENT MARKET, BY PRODUCT, 2024–2031 (USD MILLION)
TABLE 87
CHINA: PHOTOTHERAPY EQUIPMENT MARKET, BY APPLICATION, 2024–2031 (USD MILLION)
TABLE 88
CHINA: PHOTOTHERAPY EQUIPMENT MARKET FOR SKIN DISEASES, BY TYPE, 2024–2031 (USD MILLION)
TABLE 89
CHINA: PHOTOTHERAPY EQUIPMENT MARKET, BY END USER, 2024–2031 (USD MILLION)
TABLE 90
JAPAN: PHOTOTHERAPY EQUIPMENT MARKET, BY PRODUCT, 2024–2031 (USD MILLION)
TABLE 91
JAPAN: PHOTOTHERAPY EQUIPMENT MARKET, BY APPLICATION, 2024–2031 (USD MILLION)
TABLE 92
JAPAN: PHOTOTHERAPY EQUIPMENT MARKET FOR SKIN DISEASES, BY TYPE, 2024–2031 (USD MILLION)
TABLE 93
JAPAN: PHOTOTHERAPY EQUIPMENT MARKET, BY END USER, 2024–2031 (USD MILLION)
TABLE 94
INDIA: PHOTOTHERAPY EQUIPMENT MARKET, BY PRODUCT, 2024–2031 (USD MILLION)
TABLE 95
INDIA: PHOTOTHERAPY EQUIPMENT MARKET, BY APPLICATION, 2024–2031 (USD MILLION)
TABLE 96
INDIA: PHOTOTHERAPY EQUIPMENT MARKET FOR SKIN DISEASES, BY TYPE, 2024–2031 (USD MILLION)
TABLE 97
INDIA: PHOTOTHERAPY EQUIPMENT MARKET, BY END USER, 2024–2031 (USD MILLION)
TABLE 98
AUSTRALIA: PHOTOTHERAPY EQUIPMENT MARKET, BY PRODUCT, 2024–2031 (USD MILLION)
TABLE 99
AUSTRALIA: PHOTOTHERAPY EQUIPMENT MARKET, BY APPLICATION, 2024–2031 (USD MILLION)
TABLE 100
AUSTRALIA: PHOTOTHERAPY EQUIPMENT MARKET FOR SKIN DISEASES, BY TYPE, 2024–2031 (USD MILLION)
TABLE 101
AUSTRALIA: PHOTOTHERAPY EQUIPMENT MARKET, BY END USER, 2024–2031 (USD MILLION)
TABLE 102
SOUTH KOREA: PHOTOTHERAPY EQUIPMENT MARKET, BY PRODUCT, 2024–2031 (USD MILLION)
TABLE 103
SOUTH KOREA: PHOTOTHERAPY EQUIPMENT MARKET, BY APPLICATION, 2024–2031 (USD MILLION)
TABLE 104
SOUTH KOREA: PHOTOTHERAPY EQUIPMENT MARKET FOR SKIN DISEASES, BY TYPE, 2024–2031 (USD MILLION)
TABLE 105
SOUTH KOREA: PHOTOTHERAPY EQUIPMENT MARKET, BY END USER, 2024–2031 (USD MILLION)
TABLE 106
REST OF ASIA PACIFIC: PHOTOTHERAPY EQUIPMENT MARKET, BY PRODUCT, 2024–2031 (USD MILLION)
TABLE 107
REST OF ASIA PACIFIC: PHOTOTHERAPY EQUIPMENT MARKET, BY APPLICATION, 2024–2031 (USD MILLION)
TABLE 108
REST OF ASIA PACIFIC: PHOTOTHERAPY EQUIPMENT MARKET FOR SKIN DISEASES, BY TYPE, 2024–2031 (USD MILLION)
TABLE 109
REST OF ASIA PACIFIC: PHOTOTHERAPY EQUIPMENT MARKET, BY END USER, 2024–2031 (USD MILLION)
TABLE 110
LATIN AMERICA: PHOTOTHERAPY EQUIPMENT MARKET, BY COUNTRY, 2024–2031 (USD MILLION)
TABLE 111
LATIN AMERICA: PHOTOTHERAPY EQUIPMENT MARKET, BY PRODUCT, 2024–2031 (USD MILLION)
TABLE 112
LATIN AMERICA: PHOTOTHERAPY EQUIPMENT MARKET, BY APPLICATION, 2024–2031 (USD MILLION)
TABLE 113
LATIN AMERICA: PHOTOTHERAPY EQUIPMENT MARKET FOR SKIN DISEASES, BY TYPE, 2024–2031 (USD MILLION)
TABLE 114
LATIN AMERICA: PHOTOTHERAPY EQUIPMENT MARKET, BY END USER, 2024–2031 (USD MILLION)
TABLE 115
BRAZIL: PHOTOTHERAPY EQUIPMENT MARKET, BY PRODUCT, 2024–2031 (USD MILLION)
TABLE 116
BRAZIL: PHOTOTHERAPY EQUIPMENT MARKET, BY APPLICATION, 2024–2031 (USD MILLION)
TABLE 117
BRAZIL: PHOTOTHERAPY EQUIPMENT MARKET FOR SKIN DISEASES, BY TYPE, 2024–2031 (USD MILLION)
TABLE 118
BRAZIL: PHOTOTHERAPY EQUIPMENT MARKET, BY END USER, 2024–2031 (USD MILLION)
TABLE 119
MEXICO: PHOTOTHERAPY EQUIPMENT MARKET, BY PRODUCT, 2024–2031 (USD MILLION)
TABLE 120
MEXICO: PHOTOTHERAPY EQUIPMENT MARKET, BY APPLICATION, 2024–2031 (USD MILLION)
TABLE 121
MEXICO: PHOTOTHERAPY EQUIPMENT MARKET FOR SKIN DISEASES, BY TYPE, 2024–2031 (USD MILLION)
TABLE 122
MEXICO: PHOTOTHERAPY EQUIPMENT MARKET, BY END USER, 2024–2031 (USD MILLION)
TABLE 123
REST OF LATIN AMERICA: PHOTOTHERAPY EQUIPMENT MARKET, BY PRODUCT, 2024–2031 (USD MILLION)
TABLE 124
REST OF LATIN AMERICA: PHOTOTHERAPY EQUIPMENT MARKET, BY APPLICATION, 2024–2031 (USD MILLION)
TABLE 125
REST OF LATIN AMERICA: PHOTOTHERAPY EQUIPMENT MARKET FOR SKIN DISEASES, BY TYPE, 2024–2031 (USD MILLION)
TABLE 126
REST OF LATIN AMERICA: PHOTOTHERAPY EQUIPMENT MARKET, BY END USER, 2024–2031 (USD MILLION)
TABLE 127
MIDDLE EAST & AFRICA: PHOTOTHERAPY EQUIPMENT MARKET, BY PRODUCT, 2024–2031 (USD MILLION)
TABLE 128
MIDDLE EAST & AFRICA: PHOTOTHERAPY EQUIPMENT MARKET, BY APPLICATION, 2024–2031 (USD MILLION)
TABLE 129
MIDDLE EAST & AFRICA: PHOTOTHERAPY EQUIPMENT MARKET FOR SKIN DISEASES, BY TYPE, 2024–2031 (USD MILLION)
TABLE 130
MIDDLE EAST & AFRICA: PHOTOTHERAPY EQUIPMENT MARKET, BY END USER, 2024–2031 (USD MILLION)
TABLE 131
GCC COUNTRIES: PHOTOTHERAPY EQUIPMENT MARKET, BY PRODUCT, 2024–2031 (USD MILLION)
TABLE 132
GCC COUNTRIES: PHOTOTHERAPY EQUIPMENT MARKET, BY APPLICATION, 2024–2031 (USD MILLION)
TABLE 133
GCC COUNTRIES: PHOTOTHERAPY EQUIPMENT MARKET FOR SKIN DISEASES, BY TYPE, 2024–2031 (USD MILLION)
TABLE 134
GCC COUNTRIES: PHOTOTHERAPY EQUIPMENT MARKET, BY END USER, 2024–2031 (USD MILLION)
TABLE 135
KEY DEVELOPMENTS IN PHOTOTHERAPY EQUIPMENT MARKET, JANUARY 2021–MAY 2026
TABLE 136
PHOTOTHERAPY EQUIPMENT MARKET: DEGREE OF COMPETITION
TABLE 137
PHOTOTHERAPY EQUIPMENT MARKET: REGION FOOTPRINT
TABLE 138
PHOTOTHERAPY EQUIPMENT MARKET: PRODUCT FOOTPRINT
TABLE 139
PHOTOTHERAPY EQUIPMENT MARKET: APPLICATION FOOTPRINT
TABLE 140
PHOTOTHERAPY EQUIPMENT MARKET: END-USER FOOTPRINT
TABLE 141
PHOTOTHERAPY EQUIPMENT MARKET: DETAILED LIST OF KEY STARTUPS/SMES
TABLE 142
PHOTOTHERAPY EQUIPMENT MARKET: COMPETITIVE BENCHMARKING OF STARTUPS/SMES
TABLE 143
PHOTOTHERAPY EQUIPMENT MARKET: PRODUCT LAUNCHES & APPROVALS, JANUARY 2021–JANUARY 2026
TABLE 144
PHOTOTHERAPY EQUIPMENT MARKET: DEALS, JANUARY 2021–JANUARY 2026
TABLE 145
GE HEALTHCARE: COMPANY OVERVIEW
TABLE 146
GE HEALTHCARE: PRODUCTS OFFERED
TABLE 147
DRÄGERWERK AG & CO. KGAA: COMPANY OVERVIEW
TABLE 148
DRÄGERWERK AG & CO. KGAA: PRODUCTS OFFERED
TABLE 149
DRÄGERWERK AG & CO. KGAA: PRODUCT LAUNCHES, JANUARY 2021–MAY 2026
TABLE 150
NATUS SENSORY: COMPANY OVERVIEW
TABLE 151
NATUS SENSORY: PRODUCTS OFFERED
TABLE 152
NATUS SENSORY: DEALS, JANUARY 2021–MAY 2026
TABLE 153
PHOTHERA: COMPANY OVERVIEW
TABLE 154
PHOTHERA: PRODUCTS OFFERED
TABLE 155
PHOTHERA: PRODUCT LAUNCHES, JANUARY 2021–MAY 2026
TABLE 156
SHANGHAI SIGMA HIGH-TECH CO., LTD.: COMPANY OVERVIEW
TABLE 157
SHANGHAI SIGMA HIGH-TECH CO., LTD.: PRODUCTS OFFERED
TABLE 158
SHANGHAI SIGMA HIGH-TECH CO., LTD.: PRODUCT LAUNCHES, JANUARY 2021–MAY 2026
TABLE 159
ATOM MEDICAL CORP: COMPANY OVERVIEW
TABLE 160
ATOM MEDICAL CORP: PRODUCTS OFFERED
TABLE 161
PHOENIX MEDICAL SYSTEMS: COMPANY OVERVIEW
TABLE 162
PHOENIX MEDICAL SYSTEMS: PRODUCTS OFFERED
TABLE 163
NEOLIGHT LLC: COMPANY OVERVIEW
TABLE 164
NEOLIGHT LLC: PRODUCTS OFFERED
TABLE 165
NEOLIGHT LLC: DEALS, JANUARY 2021–MAY 2026
TABLE 166
FANEM: COMPANY OVERVIEW
TABLE 167
FANEM: PRODUCTS OFFERED
TABLE 168
BISTOS CO., LTD.: COMPANY OVERVIEW
TABLE 169
BISTOS CO., LTD.: PRODUCTS OFFERED
TABLE 170
NINGBO DAVID MEDICAL DEVICE CO., LTD.: COMPANY OVERVIEW
TABLE 171
STRATA SKIN SCIENCES: COMPANY OVERVIEW
TABLE 172
XUZHOU KERNEL MEDICAL EQUIPMENT CO., LTD.: COMPANY OVERVIEW
TABLE 173
ULTRALITE ENTERPRISES, INC.: COMPANY OVERVIEW
TABLE 174
HOENLE MEDICAL GMBH COMPANY OVERVIEW
TABLE 175
WEYER GMBH: COMPANY OVERVIEW
TABLE 176
SHENZHEN COMEN MEDICAL INSTRUMENTS CO., LTD.: COMPANY OVERVIEW
TABLE 177
THERALIGHT, LLC: COMPANY OVERVIEW
TABLE 178
ATHRODAX LTD: COMPANY OVERVIEW
TABLE 179
CURELIGHT: COMPANY OVERVIEW
TABLE 180
PHOTO THERAPEUTICS LTD: COMPANY OVERVIEW
TABLE 181
TINY HEARTS TECHNOLOGY: COMPANY OVERVIEW
TABLE 182
LIFETRONS INNO EQUIPMENTS PVT LTD: COMPANY OVERVIEW
TABLE 183
IBIS MEDICAL EQUIPMENT AND SYSTEMS PVT LTD: COMPANY OVERVIEW
TABLE 184
SCI HEALTH: COMPANY OVERVIEW
TABLE 185
RISK ASSESSMENT: PHOTOTHERAPY EQUIPMENT
FIGURE 1
PHOTOTHERAPY EQUIPMENT MARKET SEGMENTATION
FIGURE 2
KEY INSIGHTS AND MARKET HIGHLIGHTS
FIGURE 3
PHOTOTHERAPY EQUIPMENT MARKET, 2026–2031
FIGURE 4
MAJOR STRATEGIES ADOPTED BY KEY PLAYERS IN PHOTOTHERAPY EQUIPMENT MARKET
FIGURE 5
DISRUPTIVE TRENDS IMPACTING GROWTH OF PHOTOTHERAPY EQUIPMENT MARKET
FIGURE 6
HIGH-GROWTH SEGMENTS AND EMERGING FRONTIERS IN PHOTOTHERAPY EQUIPMENT MARKET, 2025
FIGURE 7
ASIA PACIFIC TO REGISTER HIGHEST GROWTH DURING FORECAST PERIOD
FIGURE 8
INCREASING ADOPTION OF ENERGY-EFFICIENT LED PHOTOTHERAPY SYSTEMS AND EXPANSION OF HOME-BASED TREATMENT SOLUTIONS TO DRIVE MARKET
FIGURE 9
CHINA AND CONVENTIONAL PHOTOTHERAPY EQUIPMENT ACCOUNTED FOR LARGEST MARKET SHARE IN 2025
FIGURE 10
INDIA TO REGISTER HIGHEST CAGR DURING FORECAST PERIOD
FIGURE 11
NORTH AMERICA ACCOUNTED FOR LARGEST MARKET SHARE IN 2025
FIGURE 12
EMERGING ECONOMIES TO REGISTER HIGHER GROWTH RATES DURING FORECAST PERIOD
FIGURE 13
PHOTOTHERAPY EQUIPMENT MARKET: DRIVERS, RESTRAINTS, OPPORTUNITIES, AND CHALLENGES
FIGURE 14
PHOTOTHERAPY EQUIPMENT MARKET: PORTER’S FIVE FORCES ANALYSIS
FIGURE 15
PHOTOTHERAPY EQUIPMENTS MARKET: SUPPLY CHAIN ANALYSIS
FIGURE 16
VALUE CHAIN ANALYSIS: MAJOR VALUE ADDED DURING MANUFACTURING AND ASSEMBLY PHASES
FIGURE 17
PHOTOTHERAPY EQUIPMENT MARKET: ECOSYSTEM ANALYSIS
FIGURE 18
TRENDS/DISRUPTIONS INFLUENCING CUSTOMERS’ BUSINESSES IN PHOTOTHERAPY EQUIPMENT MARKET
FIGURE 19
PHOTOTHERAPY EQUIPMENT MARKET: INVESTMENT & FUNDING SCENARIO
FIGURE 20
NUMBER OF PATENTS PUBLISHED (JANUARY 2016–MAY 2026)
FIGURE 21
TOP APPLICANT COUNTRIES/REGIONS FOR PHOTOTHERAPY EQUIPMENT (JANUARY 2016− MAY 2026)
FIGURE 22
INFLUENCE OF KEY STAKEHOLDERS ON BUYING PROCESS OF PHOTOTHERAPY EQUIPMENT
FIGURE 23
KEY BUYING CRITERIA FOR PHOTOTHERAPY EQUIPMENT
FIGURE 24
NORTH AMERICA: PHOTOTHERAPY EQUIPMENT MARKET SNAPSHOT
FIGURE 25
ASIA PACIFIC: PHOTOTHERAPY EQUIPMENT MARKET SNAPSHOT
FIGURE 26
REVENUE ANALYSIS OF TOP PLAYERS IN PHOTOTHERAPY EQUIPMENT MARKET, 2021–2025 (USD MILLION)
FIGURE 27
MARKET SHARE ANALYSIS OF KEY PLAYERS, 2025
FIGURE 28
PHOTOTHERAPY EQUIPMENTS MARKET: COMPANY EVALUATION MATRIX (KEY PLAYERS), 2025
FIGURE 29
PHOTOTHERAPY EQUIPMENT MARKET: COMPANY FOOTPRINT
FIGURE 30
PHOTOTHERAPY EQUIPMENT MARKET: COMPANY EVALUATION MATRIX (STARTUPS/SMES), 2025
FIGURE 31
EV/EBITDA OF KEY VENDORS
FIGURE 32
YEAR-TO-DATE (YTD) PRICE TOTAL RETURN AND 5-YEAR STOCK BETA OF KEY VENDORS
FIGURE 33
PHOTOTHERAPY EQUIPMENT MARKET: BRAND COMPARISON
FIGURE 34
GE HEALTHCARE: COMPANY SNAPSHOT
FIGURE 35
DRÄGERWERK AG & CO. KGAA: COMPANY SNAPSHOT
FIGURE 36
RESEARCH DESIGN
FIGURE 37
PRIMARY SOURCES
FIGURE 38
BREAKDOWN OF PRIMARY INTERVIEWS: SUPPLY/DEMAND-SIDE PARTICIPANTS
FIGURE 39
BREAKDOWN OF PRIMARY INTERVIEWS: SUPPLY-SIDE PARTICIPANTS, BY COMPANY TYPE, DESIGNATION, AND REGION
FIGURE 40
BREAKDOWN OF PRIMARY INTERVIEWS (DEMAND SIDE): BY END USER, DESIGNATION, AND REGION
FIGURE 41
REVENUE SHARE ANALYSIS ILLUSTRATION: GE HEALTHCARE
FIGURE 42
SUPPLY-SIDE ANALYSIS OF TOP COMPANIES (2025)
FIGURE 43
PHOTOTHERAPY EQUIPMENT MARKET: CAGR PROJECTIONS OF DRIVERS, RESTRAINTS, OPPORTUNITIES, AND CHALLENGES (2024–2031)
FIGURE 44
CAGR PROJECTIONS: SUPPLY-SIDE ANALYSIS
FIGURE 45
DATA TRIANGULATION METHODOLOGY
Methodology
The study involved major activities in estimating the current market size for the phototherapy equipment market. Exhaustive secondary research was done to collect information on the phototherapy equipment market. The next step was to validate these findings, assumptions, and sizing with industry experts across the value chain using primary research. Different approaches, such as top-down and bottom-up, were employed to estimate the total market size. After that, the market breakup and data triangulation procedures were used to estimate the market size of the segments and subsegments of the phototherapy equipment market.
Secondary Research
This research study involved the wide use of secondary sources, directories, databases such as Dun & Bradstreet, Bloomberg Businessweek, Factiva, whitepapers, and companies’ house documents. Secondary research was undertaken to identify and collect information for this extensive, technical, market-oriented, and commercial study of the phototherapy equipment market. It was also used to obtain important information on the top players, market classification and segmentation aligned with industry trends, the lowest level of geographic markets, and key market developments. A database of the key industry leaders was also prepared using secondary research.
Primary Research
In the primary research process, various supply- and demand-side sources were interviewed to obtain qualitative and quantitative information for this report. Primary sources from the supply side included industry experts such as CEOs, VPs/Managing Directors, Marketing Heads/Directors, Sales Directors, Marketing/Sales Managers, Regional/Area Sales Managers, Export/Import Heads/Managers, and Other Phototherapy equipment Market Related Personnel from various companies and organizations operating in the phototherapy equipment market. Primary sources from the demand side included Law Enforcement Agencies, Vice Presidents, C-level Executives, Department Heads, Enterprises, Individuals, Supply Management Team of Hospitals, Clinic Personnel, and Laboratory Technicians.
Breakdown of Primary Interviews
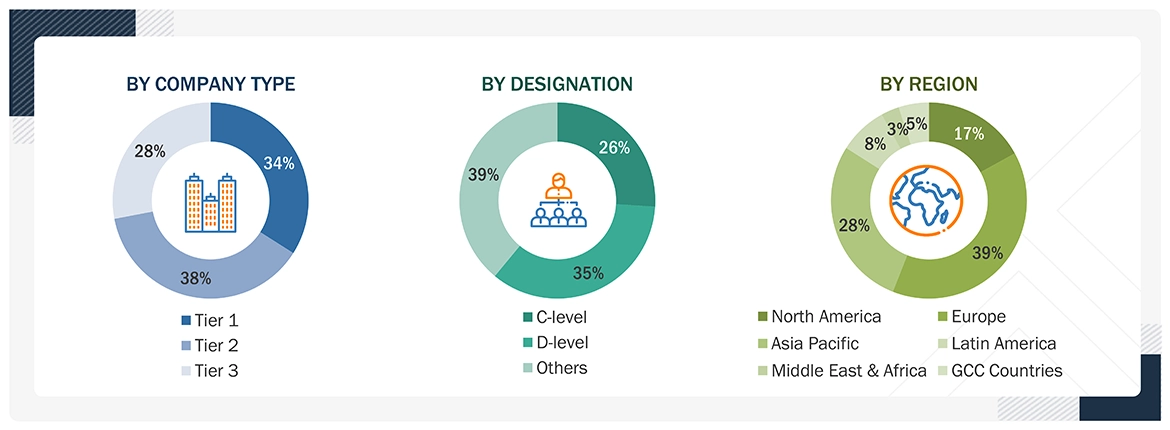
Note 1: C-level primaries include CEOs, COOs, CTOs, and VPs.
Note 2: Other primaries include sales, marketing, and product managers.
Note 3: Companies are classified into tiers based on their total revenue. As of 2025: Tier 1 = >USD 1 billion, Tier 2 = USD 500 million to USD 1 billion, and Tier 3 = <USD 500 million.
To know about the assumptions considered for the study, download the pdf brochure
Market Size Estimation
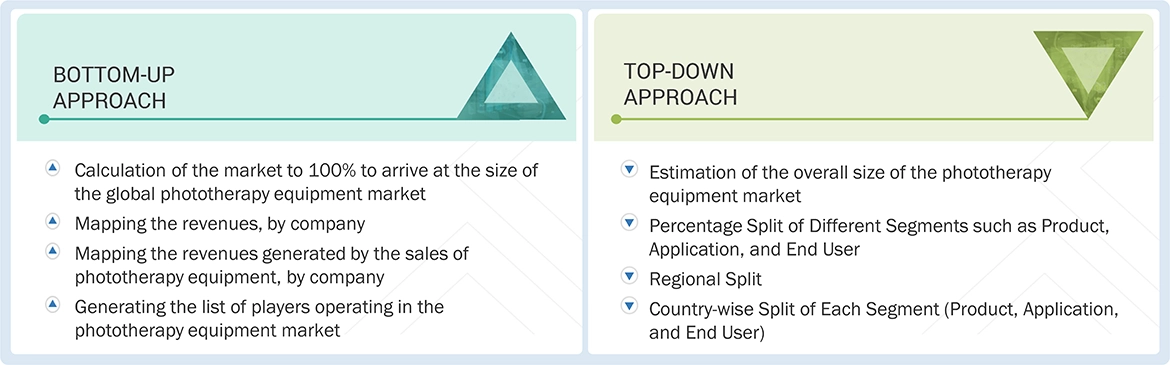
Both top-down and bottom-up approaches were used to estimate and validate the total size of the phototherapy equipment market. These methods were also used extensively to estimate the size of various subsegments in the market. The research methodology used to estimate the market size includes the following:
Phototherapy Equipment Market : Top-Down and Bottom-Up Approach
Data Triangulation
The entire market was split into three segments when the market size was determined. Data triangulation and market breakdown were used where necessary to complete the market engineering process and derive precise statistics for all segments.
Approach for deriving the market size and estimating market growth.
Using secondary data from paid and unpaid sources, the market rankings of the major players were determined through a thorough analysis of their phototherapy equipment sales. Due to data restrictions, in certain cases, the revenue share was determined after a thorough analysis of large corporations' product portfolios and individual sales performance. This information was verified at each stage by in-depth interviews with professionals in the field.
Market Definition
Phototherapy involves using a specific wavelength of light to treat various medical conditions (such as psoriasis, vitiligo, acne vulgaris, neonatal jaundice, cancer, and eczema) by exposing the affected area of the body to a light source.
Key Stakeholders
- Phototherapy equipment manufacturing companies
- Phototherapy equipment accessories manufacturing companies
- Phototherapy equipment suppliers and distributors
- Neonatologists
- Dermatologists
- Distributors, suppliers, and commercial service providers
- Hospitals and clinics
- Research laboratories and academic institutes
Report Objectives
- To describe, analyze, and forecast the phototherapy equipment market by product, application, end user, and region
- To describe and forecast the phototherapy equipment market for key regions, namely, North America, Europe, the Asia Pacific, Latin America, the Middle East and Africa, and GCC Countries
- To provide detailed information regarding drivers, restraints, opportunities, and challenges influencing the growth of the phototherapy equipment market
- To strategically analyze the ecosystem, regulations, patenting trend, value chain, Porter’s five forces, and prices pertaining to the market under study
- To strategically analyze micromarkets1 with respect to individual growth trends, prospects, and contributions to the overall market
- To analyze market opportunities for stakeholders and provide details of the competitive landscape for market players
- To profile key players and comprehensively analyze their market shares and core competencies2 in the phototherapy equipment market
- To analyze competitive developments such as collaborations, acquisitions, product launches, expansions, and R&D activities in the phototherapy equipment market
Available customizations:
With the given market data, MarketsandMarkets offers customizations as per your company’s specific needs. The following customization options are available for the report:
Product Analysis
- Product matrix, which gives a detailed comparison of the product portfolios of each company
Regional Analysis
- Further breakdown of the Rest of Asia Pacific phototherapy equipment market into Vietnam, New Zealand, and others.
- Further breakdown of the Rest of Latin America phototherapy equipment market into Colombia, Chile, Ecuador, and others.
- Further breakdown of the Rest of Europe phototherapy equipment market into Belgium, Russia, the Netherlands, Switzerland, and others.
Company Information
- Detailed analysis and profiling of additional market players (up to 5)
Personalize This Research
- Triangulate with your Own Data
- Get Data as per your Format and Definition
- Gain a Deeper Dive on a Specific Application, Geography, Customer or Competitor
- Any level of Personalization
Let Us Help You
- What are the Known and Unknown Adjacencies Impacting the Phototherapy Equipment Market
- What will your New Revenue Sources be?
- Who will be your Top Customer; what will make them switch?
- Defend your Market Share or Win Competitors
- Get a Scorecard for Target Partners


JAYANT RAJPUROHIT
Director of Market Insights, Data and Analytics
SFI Health,
Leading Pharmaceutical Company

We at SFI Health approached MarketsandMarkets for an Opportunity Assessment on "Incidence and Prevalence of Focus Indications" as we wanted to know the most attractive HCPs like Physician, Functional MD, Naturopath and Pharmacist. The project was critical for us to ensure our focus on the right target which would enable sustainable growth and profitability for SFI Health. The business insights provided exceeded our expectations and we were extremely impressed. The team at MarketsandMarkets is highly professional and detail oriented and very well understood our business needs. MarketsandMarkets offers a unique combination of expertise and dedicated engagement model. We identified 2 new products to be launched in coming months, based on the research findings provided by MarketsandMarkets. We are happy with the services and would strongly recommend MarketsandMarkets to my peers in the industry.

BEATRIZ DE LA CALLE
Head of Commercial Analytics
Qualicaps,
Leading Pharmaceutical Company

We partnered with MarketsandMarkets for an assessment study on hard empty capsules. The team was extremely professional in understanding our business requirements and we received timely responses to all our queries. The market intelligence and the recommendations has met our business requirements. We were extremely impressed to see the final study results; it really exceeded our expectations. The market intelligence offered by MarketsandMarkets, and clarity on next steps will help us achieve our business objective for the Year 2021. We are happy with the services and would strongly recommend MarketsandMarkets to my peers in the industry.

Bob Williams,
Senior Director Business Development & Innovation
Bracco Diagnostics Inc.,
Italian Multinational in life sciences sector and a World Leader in imaging diagnostics
We were pleased with targeted insights that MarketsandMarkets identified from a custom study on the 'Radiation Dose Management Solutions Market'. Your team identified and characterized the market participants as well as underlying trends accurately. This study was useful to Bracco in formulating business strategies for our dose monitoring product lines and we thank MarketsandMarkets for the job well done.
Cody Coonradt,
Market Development and Strategy Manager
3M Health Information Systems,
Leader in Health care Coding, Payment & Analytics Solutions.
The value for our organization comes from three things: depth of research, specificity of segments and being easy to work with. As important as the first two are, the third can't be underestimated. MarketsandMarkets, maybe more than any other research vendor, wants to know what is top of mind for our team and what big questions we are grappling to answer.
Their customer first approach and high value engagement model, have given us great analysis and excellent value for money
Previous Next
