







2026-05-14
9 min read

At Cloudflare, we are heavy users of ClickHouse, an open source online analytical processing (OLAP) database. Every day, we make millions of calls to ClickHouse to determine how much users should be billed for their usage of Cloudflare products. If we don't finish those jobs in a timely fashion, the invoices become very difficult to reconcile.
This pipeline powers hundreds of millions of dollars in usage revenue, fraud systems, and more, so being delayed has major downstream implications.
Which is why it was a big problem when the daily aggregation jobs in ClickHouse – responsible for ensuring Cloudflare’s bills go out – had slowed way down, following a migration. All the usual suspects looked clean: I/O, memory, rows scanned, parts read. Everything we would normally check when a ClickHouse query is slow appeared to be normal.
This is the story of how we discovered a hidden bottleneck buried deep within ClickHouse’s internals, and the three patches we wrote to fix it.
The setup: a petabyte-scale analytics platform
We use ClickHouse to store over a hundred petabytes of data across a few dozen clusters. To simplify onboarding for our many internal teams, we built a system called "Ready-Analytics" in early 2022.
The premise is simple: instead of designing new tables, teams can stream data into a single, massive table. Datasets are disambiguated by a namespace, and each record uses a standard schema (e.g., 20 float fields, 20 string fields, a timestamp, and an indexID).
In ClickHouse, the way data is sorted is crucial to query performance. This is where the indexID comes into play. It’s a string field, which forms part of the primary key, meaning that every individual namespace can have its data sorted in a way that is optimal for the queries the owners of that namespace expect to be running. Altogether, we end up with a primary key that looks like this: (namespace, indexID, timestamp).
This system is popular, with hundreds of applications using it. It had already grown to more than 2PiB of data by December 2024, and an ingestion rate of millions of rows per second. But it had one critical flaw: its retention policy.
The problem: one retention policy to rule them all
Cloudflare has been using ClickHouse for many years, since before it had native Time-to-Live (TTL) features. Consequently, we built our own retention system based on partitioning. The Ready-Analytics table was partitioned by day, and our retention job simply dropped partitions older than 31 days.
This "one-size-fits-all" 31-day retention was a major limitation. Some teams needed to store data for years due to legal or contractual obligations, while others needed only a few days. This restriction meant these use cases couldn't use Ready-Analytics and had to opt for a conventional setup, which has a far more complex onboarding process.
We needed a new system that allowed per-namespace retention.
The solution: a new partitioning scheme
We considered two main approaches:
A Table-per-Namespace: This would naturally solve the retention problem but would require significant new automation to manage thousands of tables on demand.
A New Partitioning Key: We could change the partitioning key from just
(day)to(namespace, day).
We chose the second option. This would allow our existing retention system to continue managing partitions, but now with per-namespace granularity.
We knew this would increase the total number of data parts in the table, but we made a key assumption: since every query is filtered by a specific namespace, the number of parts read by any single query shouldn't change. We believed this meant performance would be unaffected.

This shows how we changed the partitioning, allowing us to cheaply drop data for a single namespace
This new system also allowed us to build a sophisticated storage management layer. Using the max-min fairness algorithm, we could set a target disk utilization (e.g., 90%) and automatically "share" available space. Namespaces using less than their fair share would cede their unused capacity to those that needed more. This allowed us to confidently run our clusters at 90% utilization.
We began the migration in January 2025. Using ClickHouse's Merge table feature, we combined the old and new tables, writing all new data to the new partitioned table while the old data aged out.
The mystery: when billing starts to break
Two months later, in late March 2025, our billing team reported that their daily aggregation jobs were slowing down. These jobs are time-critical; if they don't finish, bills don't go out. The jobs were getting progressively slower, and we were approaching a deadline.
We investigated, but none of the usual suspects were to blame. I/O was fine. Memory was fine. The metrics for individual queries showed they were not reading more data or more parts than before. Our initial assumption seemed correct, yet the system was grinding to a halt.
It took several days before we even had a theory. Finally, we made a plot of query duration against the total part count in the cluster. The correlation was undeniable.

Average SELECT Query Durations on the Ready Analytics ClickHouse Cluster, showing progressive performance degradation.
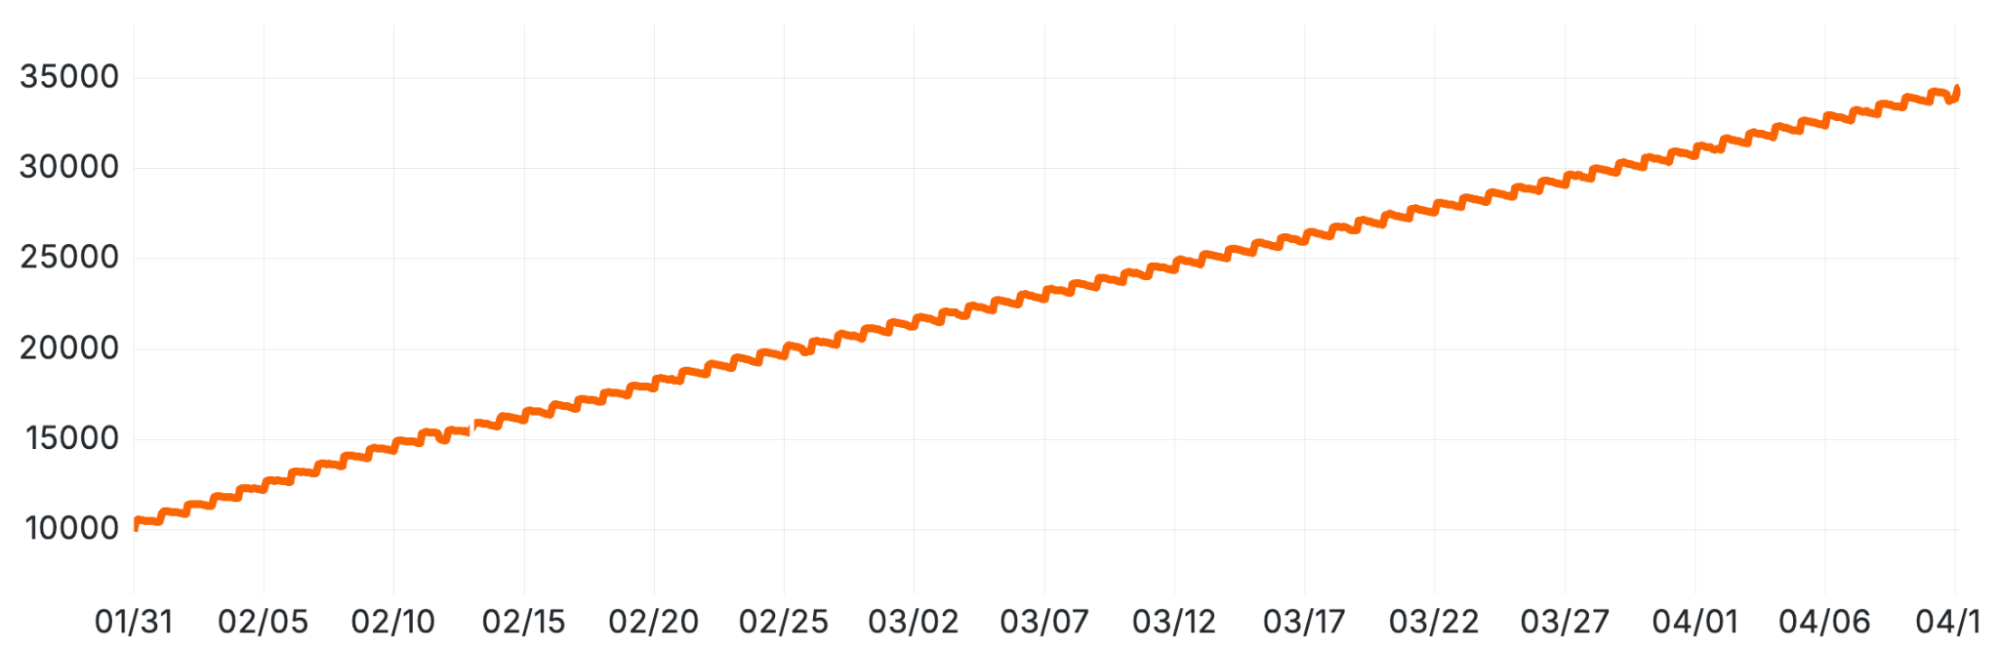
Linear Growth in Total Data Part Count per Table Replica, following the new (namespace, day) partitioning scheme.
But why? If we weren't reading the extra parts, why did their mere existence slow us down?
The investigation: hunting bottlenecks with flame graphs
We turned to ClickHouse's built-in trace_log to generate flame graphs. This is a built-in table that records traces from the running ClickHouse server. It not only includes traces of what code is being executed, but it associates these with specific users, query IDs and other metadata, meaning you can filter down to quite precise sets of events if necessary. In our case, we wanted to look specifically at leaf SELECT queries. This was easy thanks to the available metadata in this table.
The first CPU-based flame graph quickly confirmed our suspicion: a huge amount of time was being spent in query planning. This is the phase before execution when ClickHouse decides which parts to read.
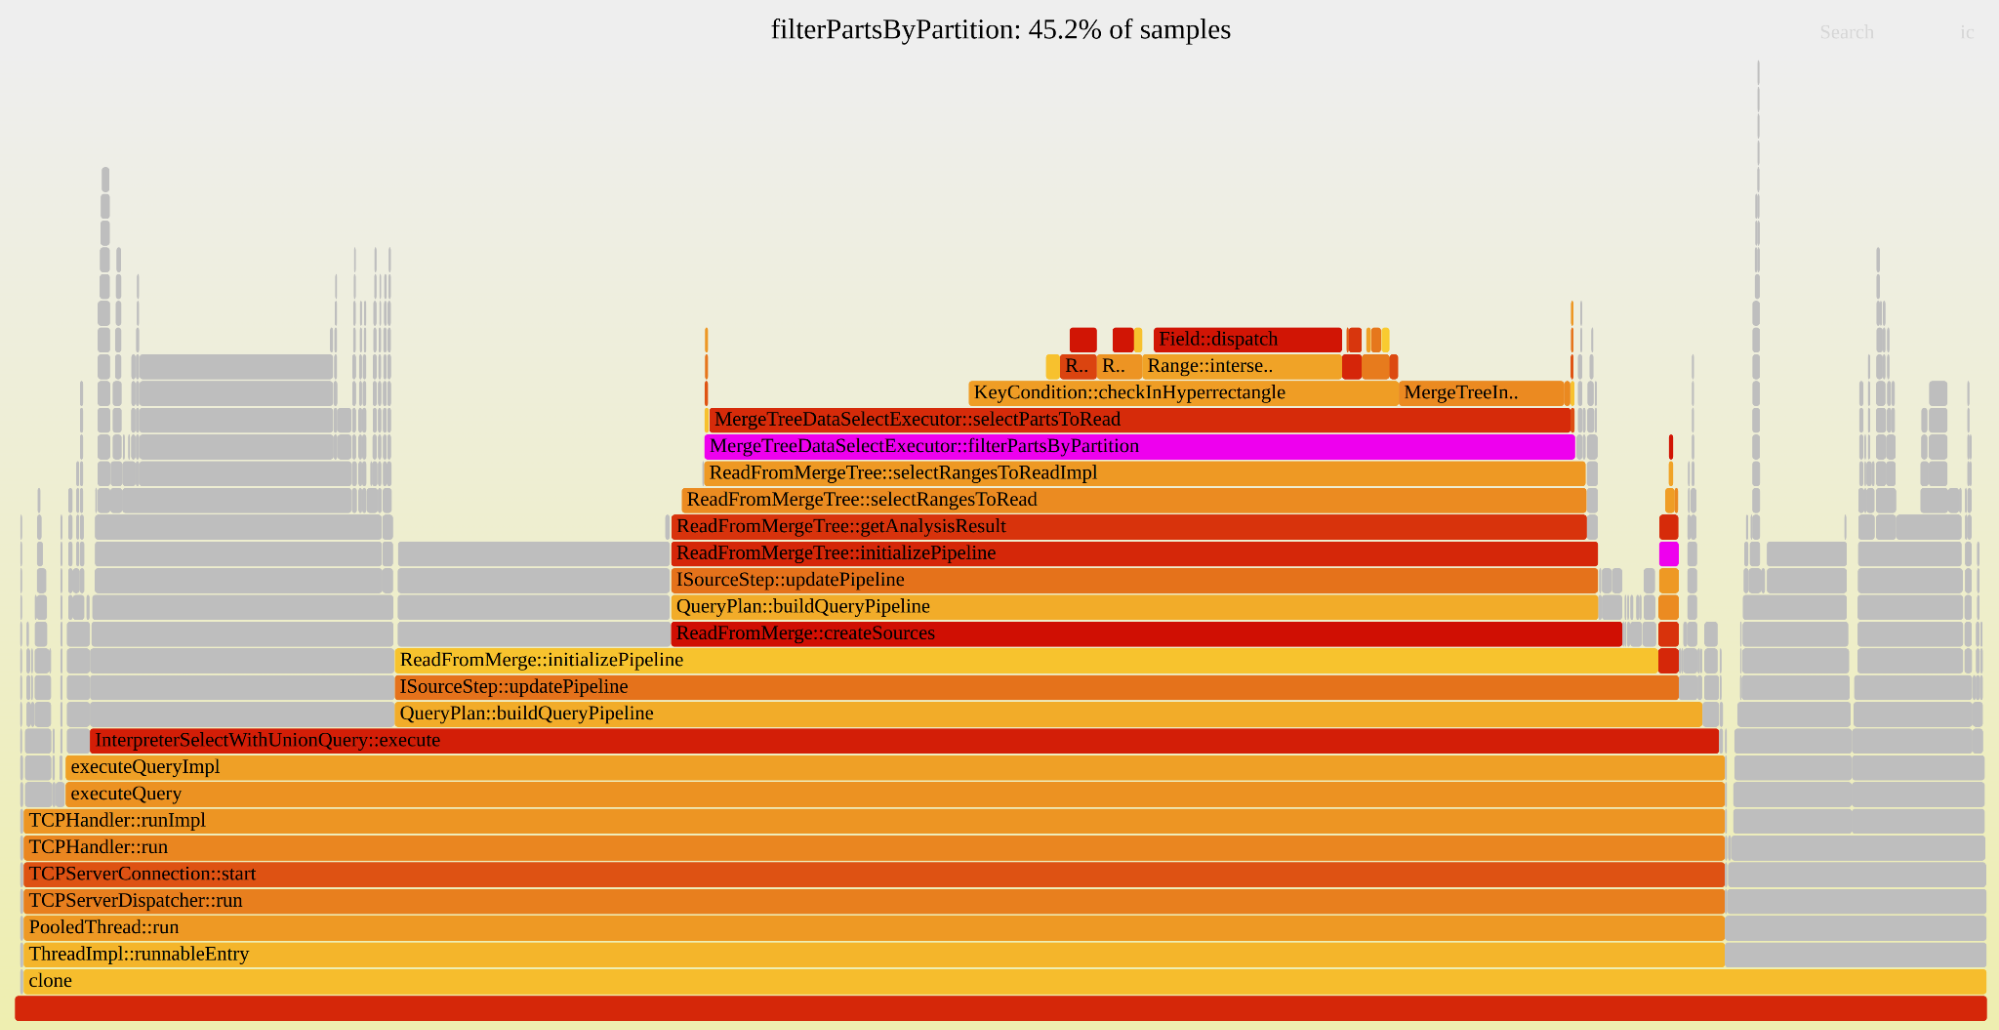
Flame graph showing that 45% of leaf query CPU time is spent filtering a vector of parts based on the partition ID
The flame graph was clear: 45% of the sampled CPU time was being spent in a single function called filterPartsByPartition.
Our first attempt at a fix was a small patch to this exact code path. The planner evaluates heuristics to prune parts, and we believed they weren't being evaluated in the optimal order for our table. Our patch changed the order, yielding a small 5% improvement. We were on the right path, but we'd missed the real problem.
We had been generating "CPU" traces, which only sample active threads. We switched to "Real" traces, which sample all threads, including those that are inactive or waiting. The new flame graph was a revelation.

Flame graph showing that more than half of leaf query duration is spent waiting for a mutex that protects the list of active parts
The problem wasn't CPU-bound work; it was massive lock contention. More than half of our query duration was spent waiting to acquire a single mutex (MergeTreeData) that protects the table's list of parts. To plan a query, every single thread had to:
Acquire an exclusive lock on this mutex.
Make a complete copy of the list of all parts in the table.
Release the lock.
Filter that list down to the relevant parts.
With tens of thousands of parts and hundreds of concurrent queries, they were all just standing in a single-file line.
The fixes: a trio of patches
This insight helped us plan a series of optimizations to alleviate these hotspots. As with all the patches we make to ClickHouse, we try to make them generic, and eventually get them contributed to the upstream codebase. This makes it easier for us to maintain our fork, and means the community benefits from the changes we make too!
Optimization 1: use a shared lock
The query planner doesn't modify the parts list; it just reads it. It had no business using an exclusive lock.
The Fix: We modified the code to acquire a shared lock (std::shared_lock) instead. This allowed all query planners to enter the critical section concurrently.
The Result: A massive, immediate drop in query duration. The lock contention vanished.

Immediate Impact of the Shared Lock Optimization (Optimization 1) on Average SELECT Query Durations, demonstrating the resolution of lock contention.
Optimization 2: stop copying the vector
Performance was significantly better, but still not back to baseline. We went back to the trace log and made another ‘Real’ flame graph.

Flame graph showing that we spend a quarter of leaf query duration copying the vector of all parts, and another quarter filtering through it (copying again).
The new flame graph showed the bottleneck had simply moved. Now, time was being spent copying the giant vector of parts, even with the shared lock. Intuitively, copying a vector sounds cheap, but when it contains tens of thousands of elements, and you do it hundreds of times a second, it adds up.
The Fix: We deferred the copy entirely. We created a "shared copy" of the parts list. Read-only operations (like query planning) just read from this copy. Any operation that modifies the set of parts (like a new insert) regenerates the cache. Planners now only copy the filtered list of parts they actually need.
The Result: Another significant performance improvement.

Further Performance Improvement After Rolling Out the Vector Copy Optimization (Optimization 2).
After seeing these massive savings internally, we decided to bring these changes to the community. After some small design iterations with the maintainers at ClickHouse Inc., we got the changes merged under PR #85535. They have been available since ClickHouse version 25.11.
Optimization 3: binary search for parts
We're still not done. As part counts grow, performance still degrades, just much more slowly. The correlation with part count was still there. Coming back to this after a few months, a new flame graph (looking the same as Figure 3) shows the time is spent in the filtering code path (the one we tried to fix first). This code performs a linear scan over all parts, evaluating predicates against each one. Over a few months, we were back to select durations from before the optimizations.
But we know this list of parts is sorted by the partitioning key. Remember that the first column of the partition key is namespace, which the vast majority of queries filter on, because it identifies the “tenant.” How can we make use of this?
The Fix: We implemented a binary search based on the namespace part of the partition ID. This works because the vector is sorted, so you can filter out a lot of the entries without actually looking at them. This is particularly effective since the namespace is the first part of that sorting key. After this first-pass of binary search, we have a much smaller range of parts we need to examine, and for those we still step through each one, applying the same logic as before to exclude parts based on other conditions.
The Result: After deploying this patch in March 2026, query durations dropped by 50% (see Figure 8). More importantly, this finally breaks correlation of query durations with the number of parts. Unfortunately, this solution doesn’t generalize that well for arbitrary query conditions (e.g. conditions such as namespace in (5,10)). We are looking into more generic approaches like extending the query condition cache to cover part filtering.
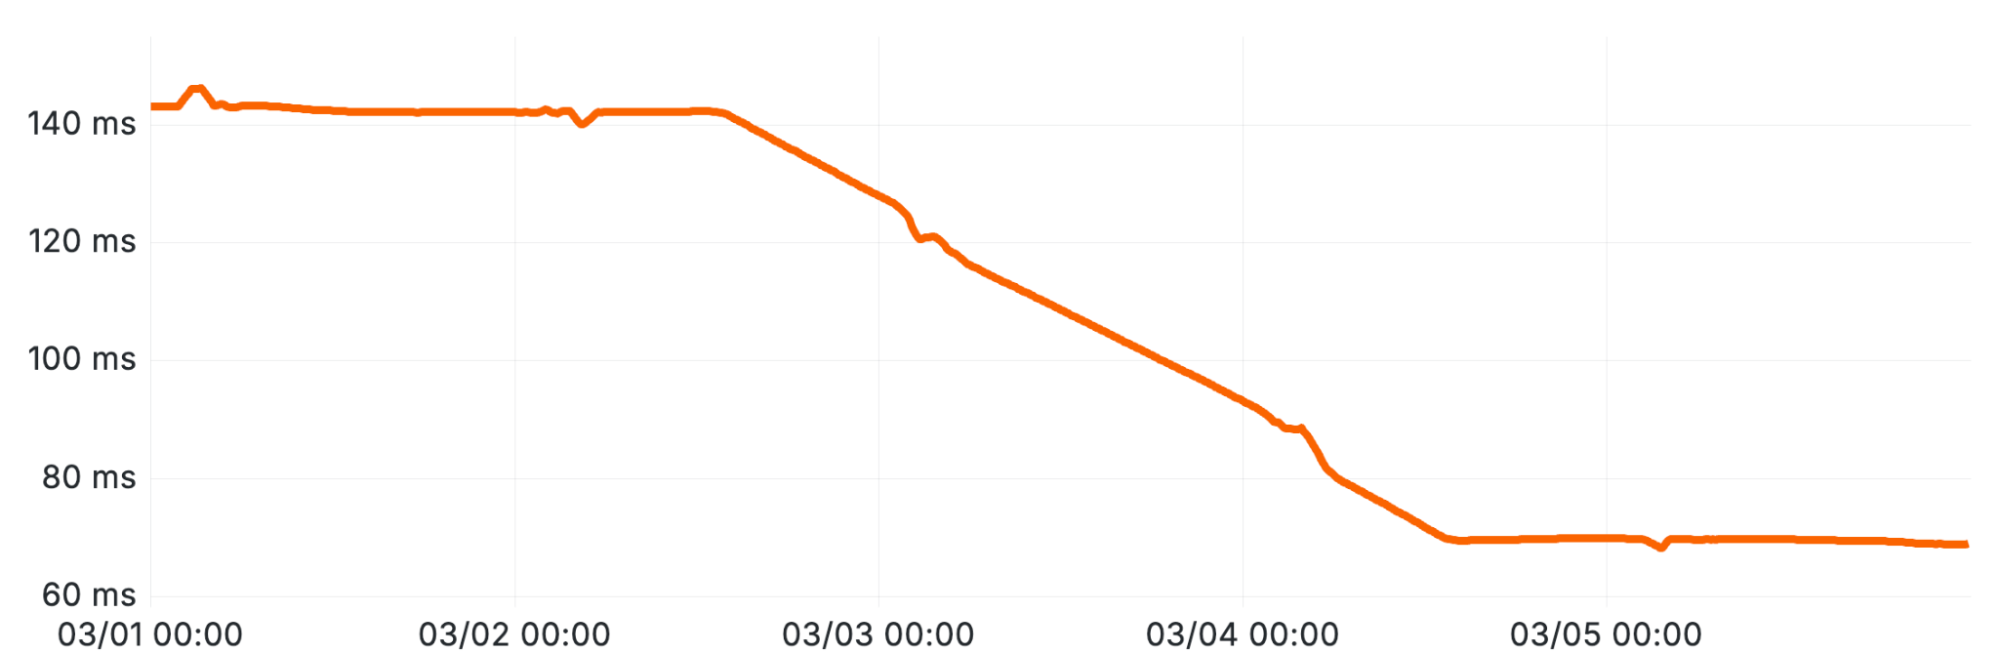
Sustained Latency Reduction Following the Implementation of Binary Search for Part Pruning (Optimization 3).
An uneasy truce
These optimizations resolved the immediate crisis with the billing system. But this journey exposed the deep, non-obvious costs of our partitioning choice.
Other problems remain. In this blog post we’ve only described the problems increasing part counts had on our select durations, but it has also caused problems for ZooKeeper, which tracks metadata for all the parts in ClickHouse. Perhaps one day we’ll tell the story of the 100 gigabyte ZooKeeper cluster.
We've bought ourselves significant breathing room, but the fundamental question remains: Was this partitioning scheme the right long-term choice? Or will we eventually need to bite the bullet and move to a different architecture? For now, our patches are holding, but the experience was a clear example of how even a well-planned change can fall victim to incorrect assumptions.
When the billing team first reported this problem we had 30,000 parts per replica. The part rate never stopped growing, and a year later we hit 160k parts per replica, but query durations have been stable thanks to the optimizations we made here.
At Cloudflare, we solve complex engineering problems at a massive scale. If the debugging and optimizations we described here sound like the type of challenge you’re looking for, check out some of the open roles we are hiring for.