








Winston Churchill once said, “Let our advance worrying become advance thinking and planning.” With our free online Gantt chart and Gantt chart software, you can let your advance worrying become planning. Just like the Prime Minister would have wanted.
Gantt charts have been around since WWI and Gantt chart software since the 1980’s. Although a Gantt chart creator has traditionally been the product of desktop programs, Gantt chart software is now available online and stronger than ever.
Here’s what you need to know about online Gantt charts and how to create one.
A Gantt chart is a chart that displays tasks scheduled over a specific period of time. According to recent research, 86% of project managers request platforms with project planning tools.
Gantt chart software is useful for projects of all sizes and helps to prioritize the many tasks making them up.
The left side of the Gantt chart creator contains a list of activities, and along the top is the appropriate timescale.
Take a look at this production calendar in StudioBinder:
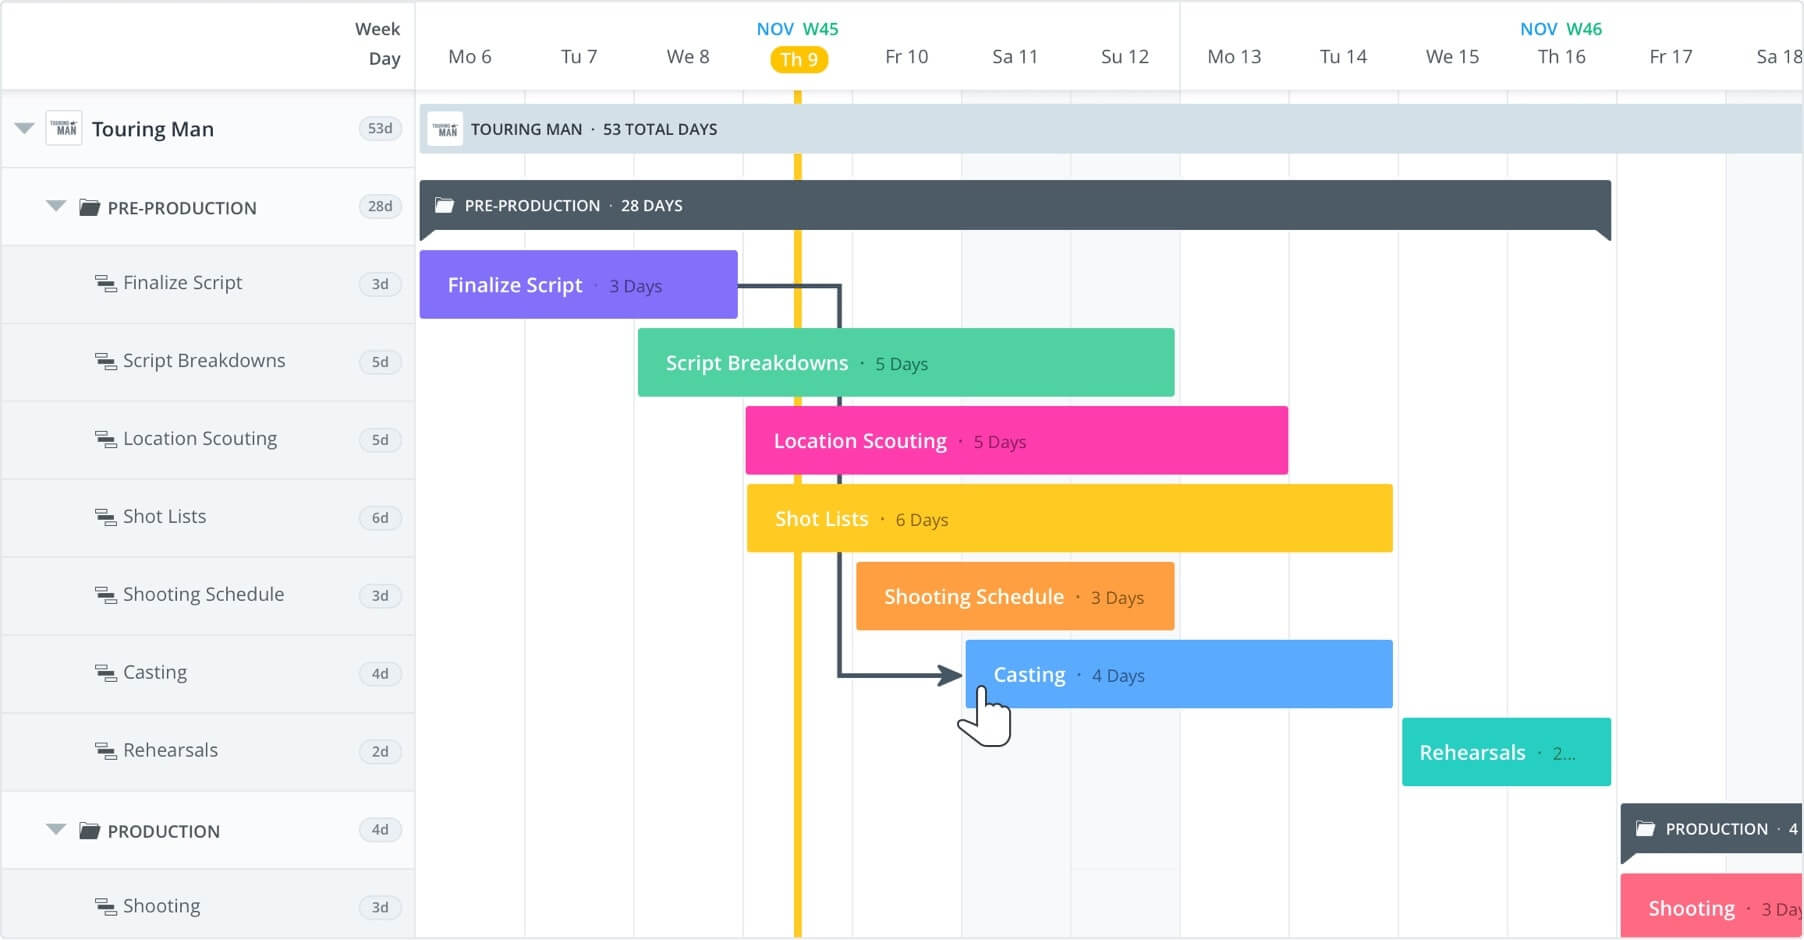
An online chart tool like this allows an individual to view:
The structure of online timeline creators enables viewers to see the relationships between tasks.
The chart also displays how each task has progressed and what resources you’ve used.
Ultimately a Gantt chart shows what has to be done and when.
Okay, you may be asking yourself what’s all the fuss about an online chart tool? Why should I download a free Gantt chart template?
A Gantt chart is vital for any project manager.
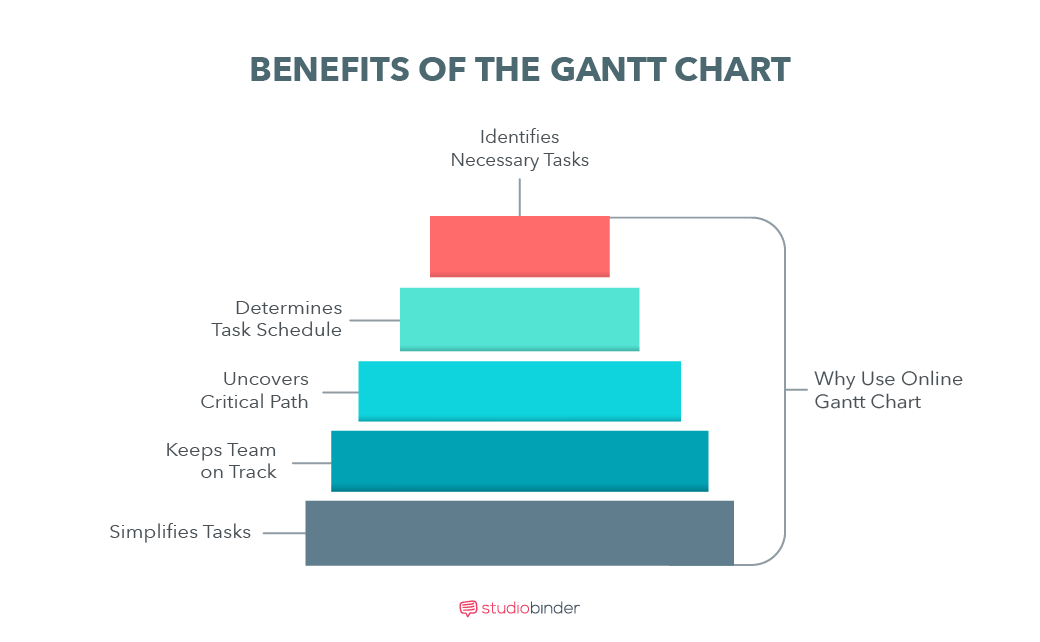
The chart helps to improve the visibility of complex projects and keeps team members on schedule.
Here are some important reasons why project management software is beneficial:
One thing that can complicate a project is a lack of clarity.
Rather than simply diving into a project with no direction, project planning tools like a Gantt creator enables users to thoroughly contemplate each task on a project timeline.
This process allows users to better define the overall scope and objective of the project.
There’s nothing worse than having confusion about when tasks are due.
The entire production process can go off the rails if objectives are not prioritized appropriately.
An online timeline creator combats this confusion by utilizing dependencies.
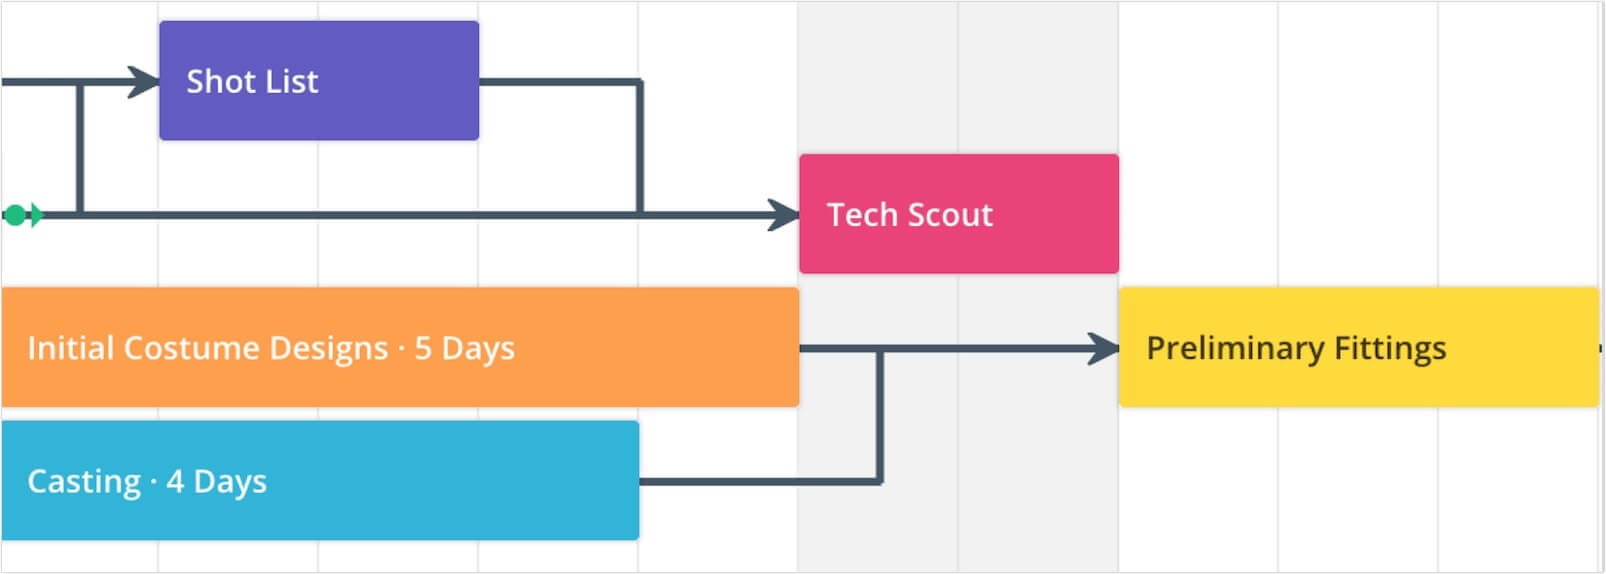
Dependencies are the relationships of the preceding tasks (Predecessors) to the succeeding tasks (Successors).
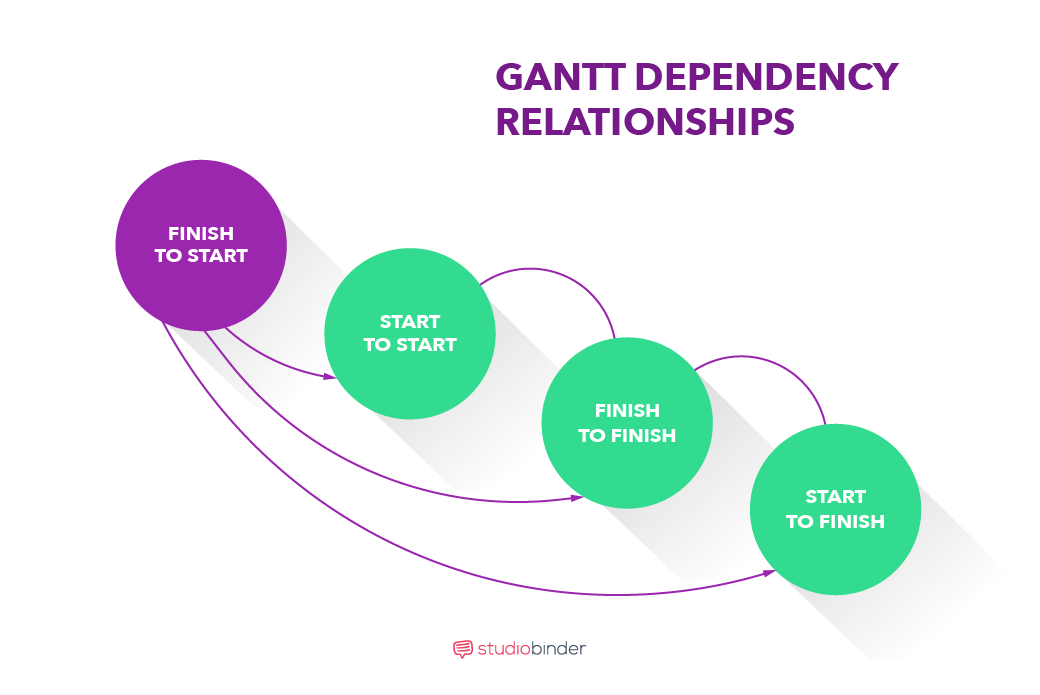
There are four types of dependency relationships within an online chart tool:
It’s possible for tasks to have multiple preceding and succeeding tasks.
The most common of these dependencies is finish to start.
Adding these dependencies to a Gantt chart greatly improves the prioritization of workflow.
The Gantt online chart tool also allows a user to identify the critical path.
The critical path is the longest sequence of activities that must be finished in order for a project to meet its due date.
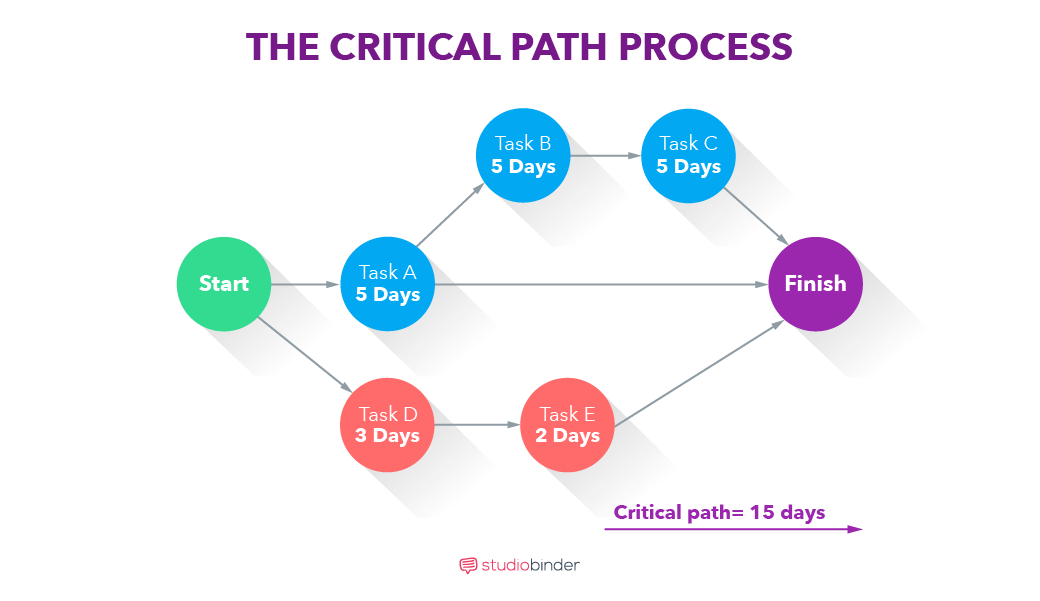
Through the critical path, a project manager can identify the most important tasks of a timeline.
This is vital because if just one task in the critical path is incomplete, it can delay the entire project.
Once you have determined the critical path using the Gantt chart creator, you can properly assess the time frames of each task.
Identifying the critical path with the online chart tool is essential in meeting project milestones and due dates.
Often, time is of the essence in projects.
Unnecessary meetings regarding status updates can stall workflow significantly.
The visual nature of online timeline creators like Gantt charts allows team members to see the progress of tasks in real-time.
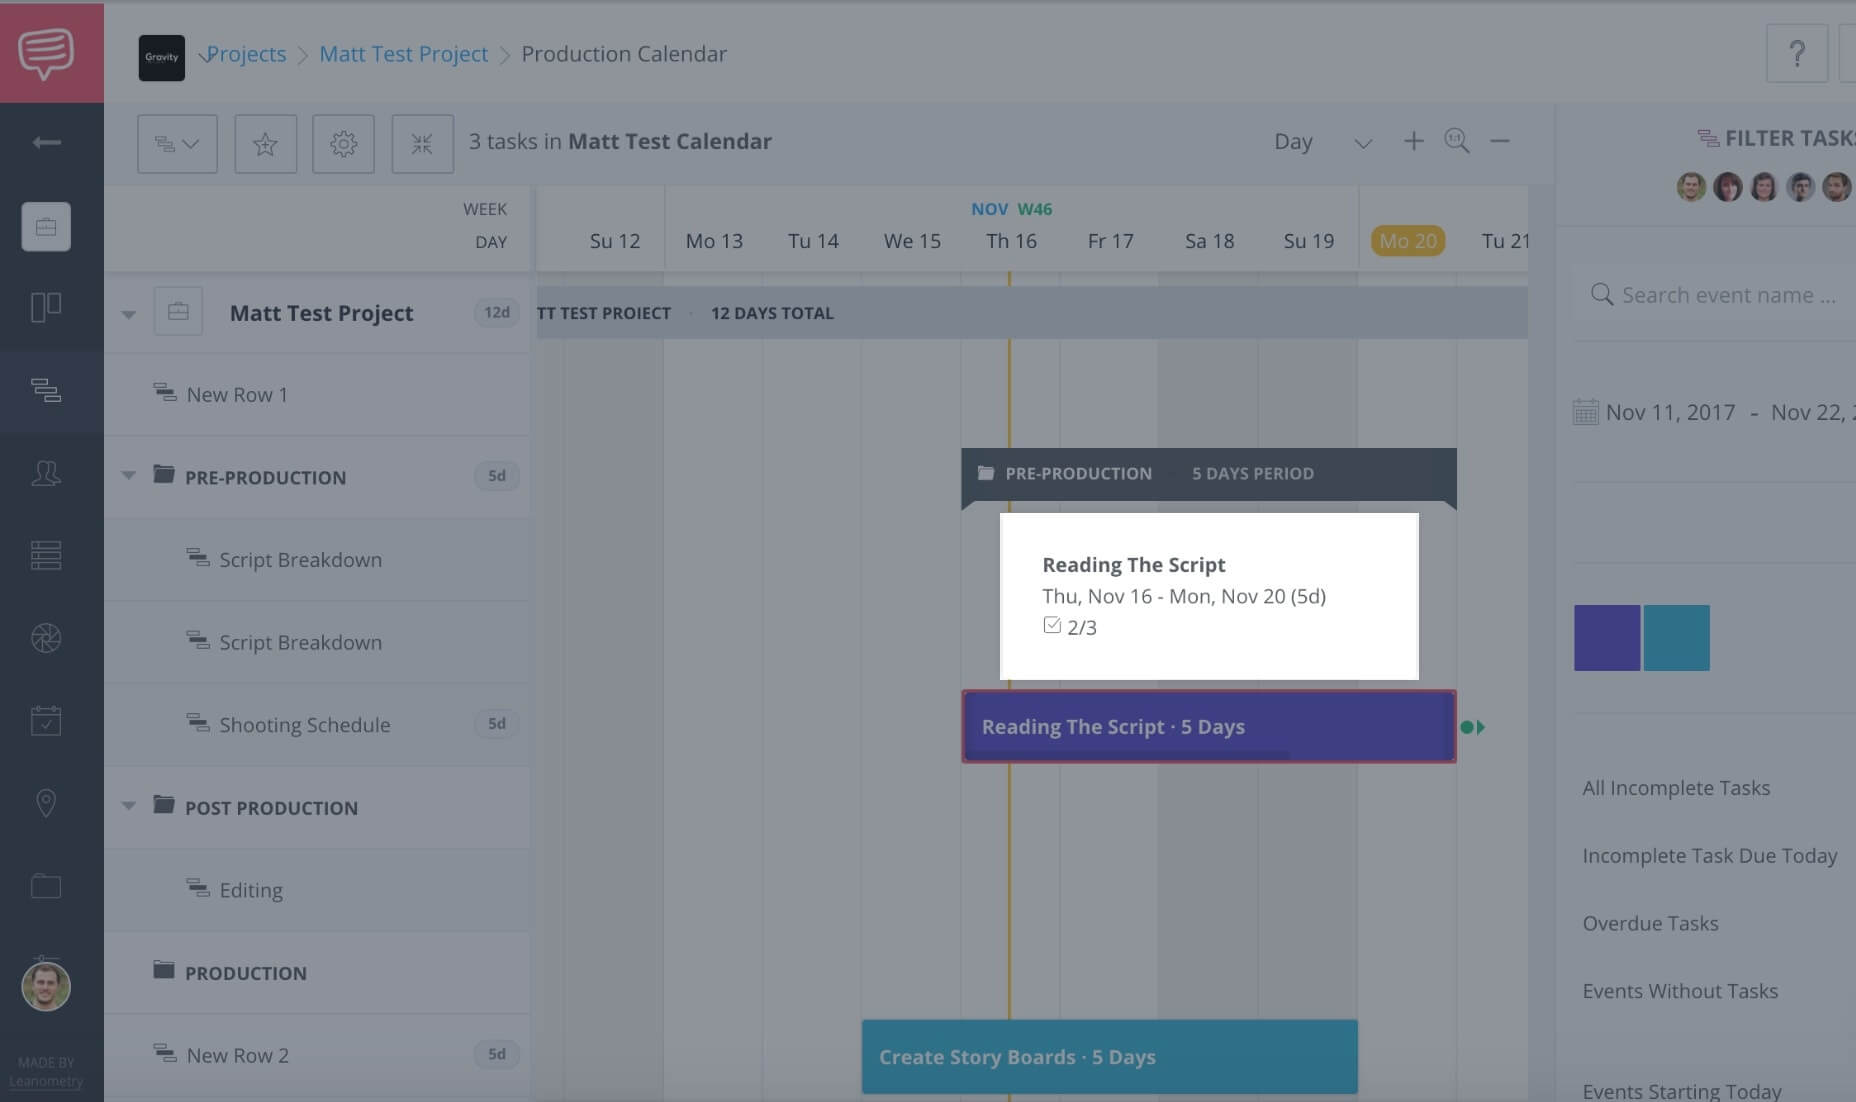
As in this StudioBinder example, the online Gantt chart tool allows team members to accurately communicate their progress in a concise and effective manner.
Let’s face it, projects can become chaotic.
With hundreds of tasks to manage and keep track of, it’s easy for a team to lose focus.
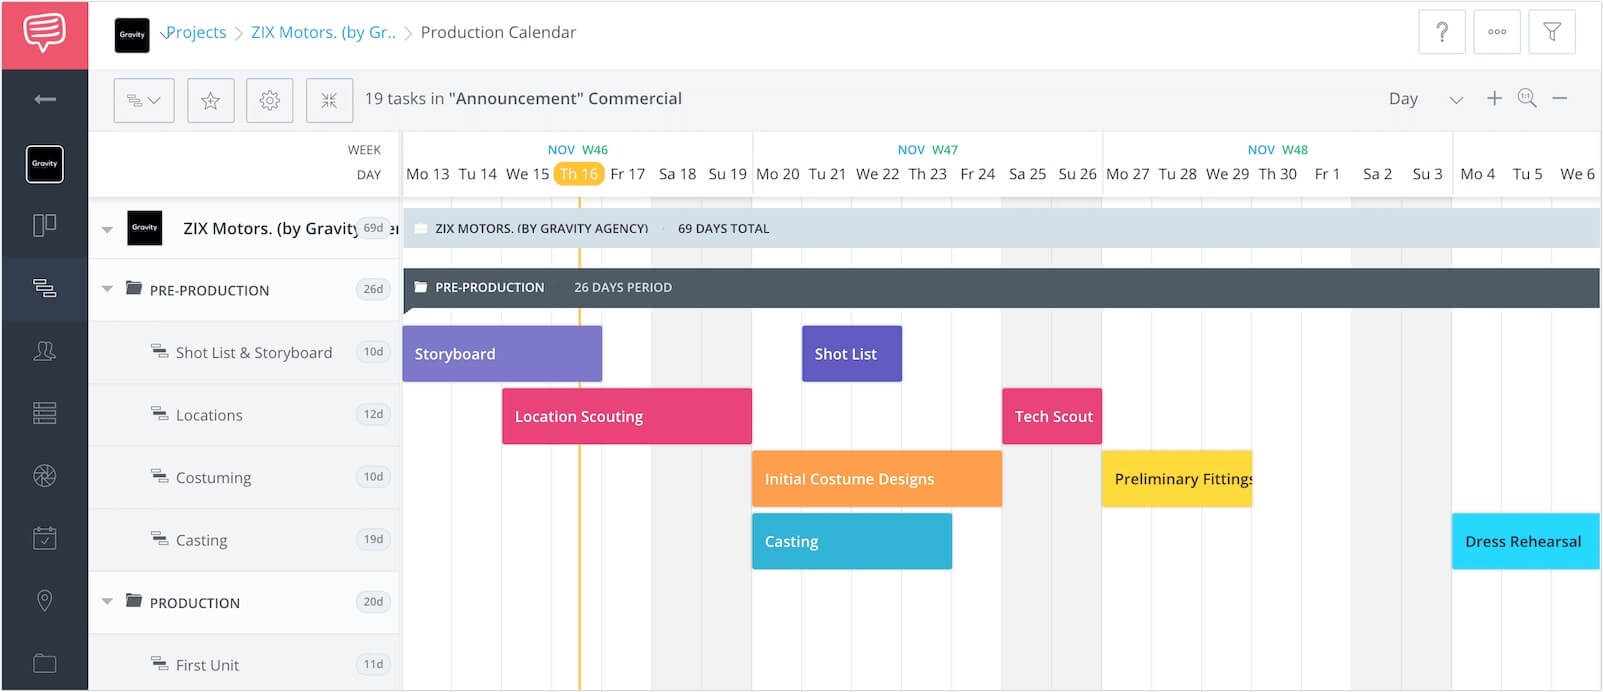
Rather than presenting a hard-to-read list, Gantt chart creators use their visual advantages in simplifying a project timeline.
It is the visual makeup of this online chart tool that allows you to digest information easier.
Many people are familiar with creating a simple Gantt chart in Microsoft Excel, and there are certainly many free Gantt chart templates out there you can use.
But the Gantt chart maker in Excel is limiting for a variety of reasons. It can be difficult to collaborate, for example.
Gantt chart online software, however, permits users to edit tasks simultaneously.
As soon as a user completes a task, adds a comment or attaches a file, the online Gantt chart generator immediately updates in real time.
This process is far more effective in communicating with team members the progress of events and tasks.
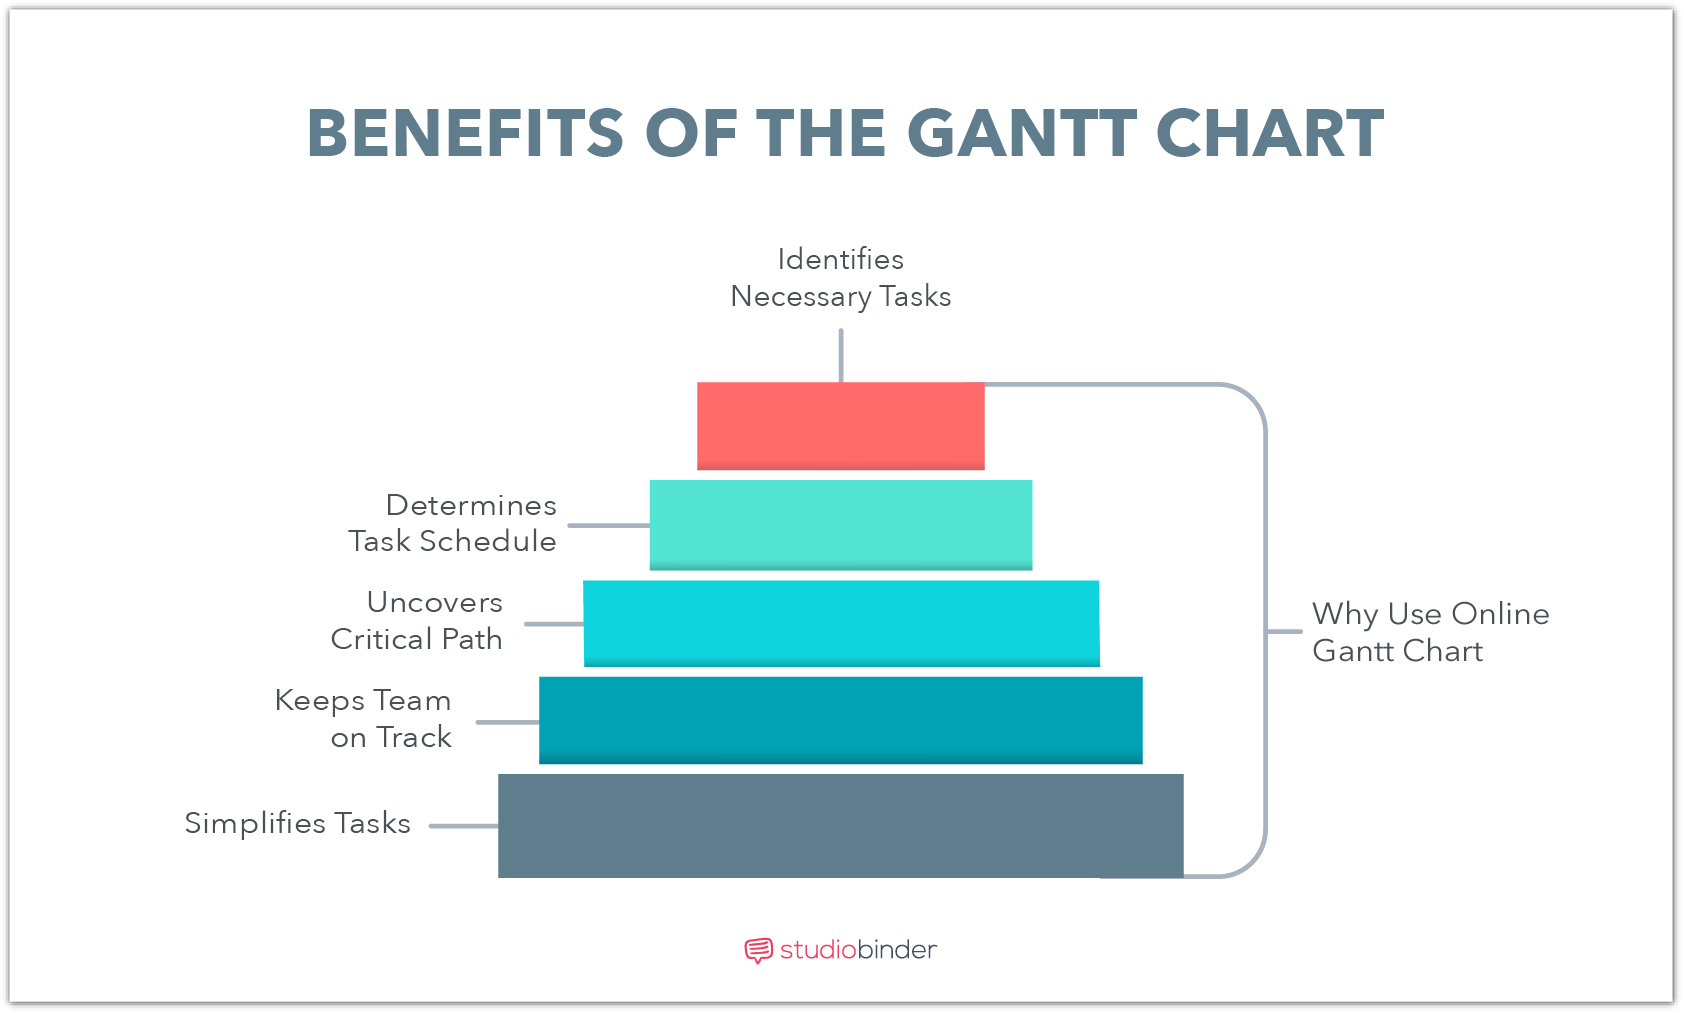
Here some of the major benefits of online Gantt chart software vs. free Gantt chart templates:
Like the best project planning tools, online Gantt chart software is effective for helping to visualize tasks.
Because of its structure and functionality, it is ideal for a number of professionals including:
Although traditionally Gantt charts were the tools of project managers, the convenience and accessibility afforded by free online Gantt chart software have allowed almost anyone to create one.
Alright, now time for the nitty-gritty.
Using StudioBinder as an example, here are the steps in creating an online Gantt chart.
To begin creating an online Gantt chart, log into the project management software and look for the create new project button.
In StudioBinder, this is located in the upper right corner as “+ New Project.”

This section acts as your Gantt chart generator.
Once there, you will be able to fill out the project name and project type.
In this case, the selections include scripted narrative, unscripted video, and photography.
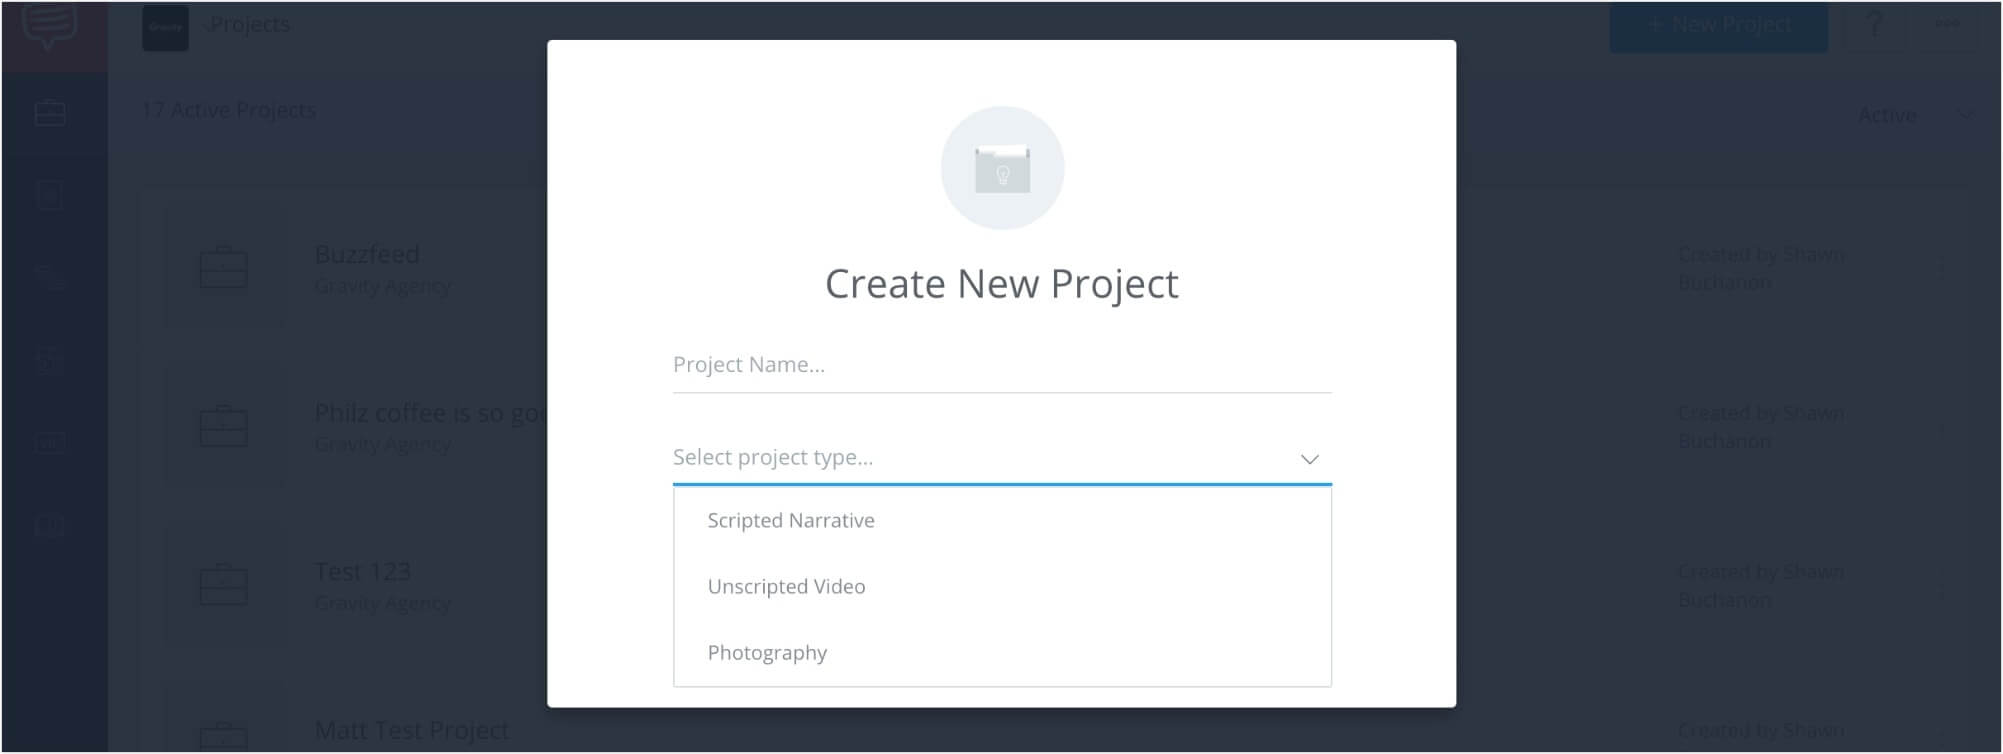
When you’ve made your selections, click create, and a production timeline will generate.
Now that your online timeline creator has created your production timeline, the next step is to add groups to your online Gantt chart.
These groups will be the stages of production involved in your project. In film production, for example, these might include Pre-Production, Production, and Post-Production.
StudioBinder organizes groups on the far left side of the timeline.
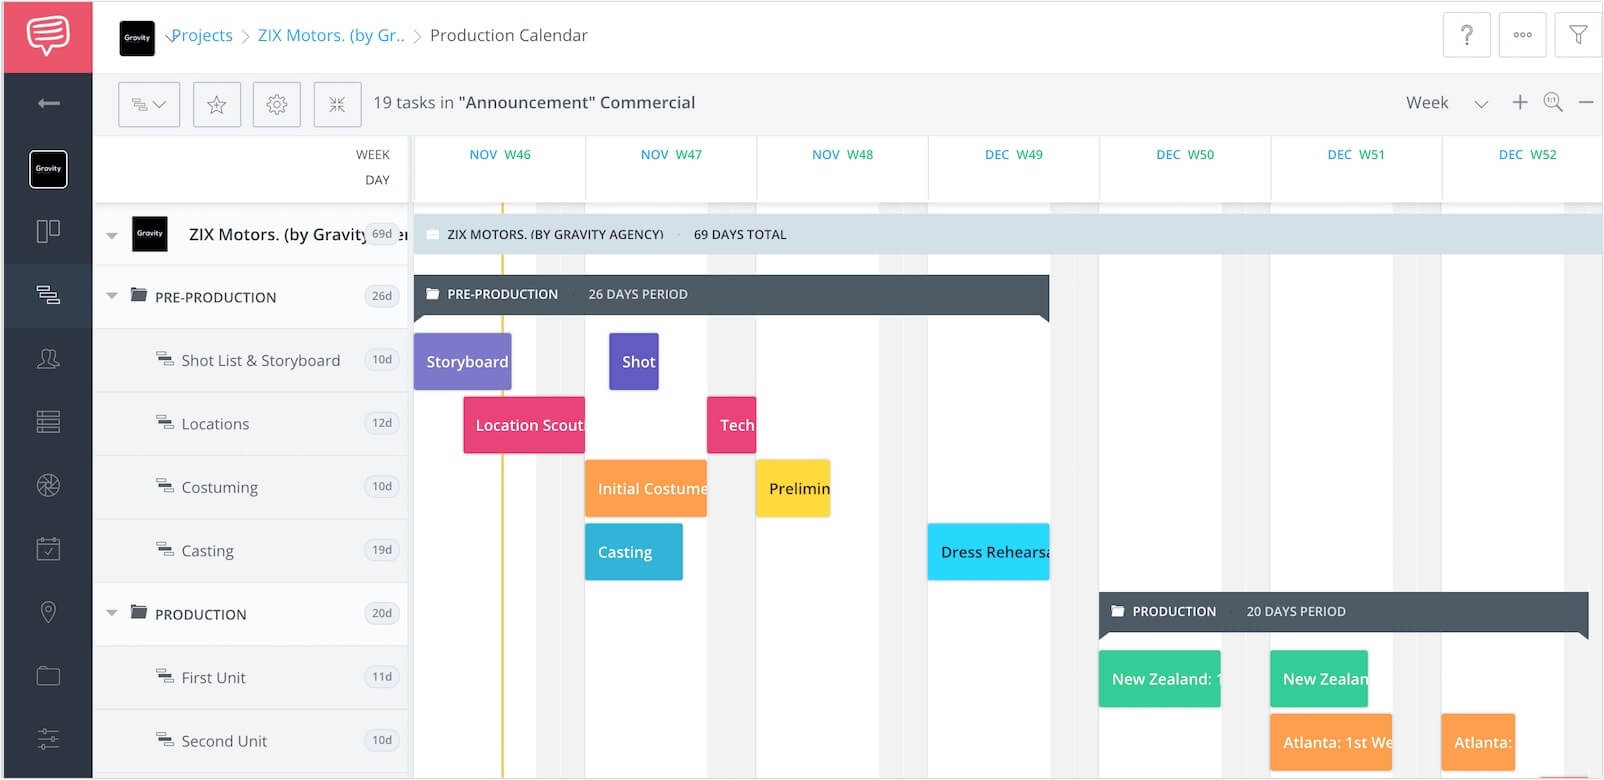
Using the project planning tools provided, team members then have the ability to add new groups and rows.
Rows are the sub-elements that each phase of production controls (Locations, Casting etc.), and where events and tasks will be placed into.
After you’ve created groups and rows it’s time to add events to the online Gantt chart.

In StudioBinder, events correspond to their appropriate row elements.
In the example above, the Costuming row contains events for Initial Costume Designs and the Preliminary Fitting.
To create an event, click to the right of the row and drag the cursor across the timeline.
The Gantt chart generator will then display a new event block on the timeline.
Once the new event block appears, you will then have the ability to name the event, and continue with creating tasks and due dates.
Now that you’ve created the event has, it’s important to determine what the tasks for the particular event will be.
In the StudioBinder example below, the event is “Reading the Script,” and the tasks specify what that will entail.
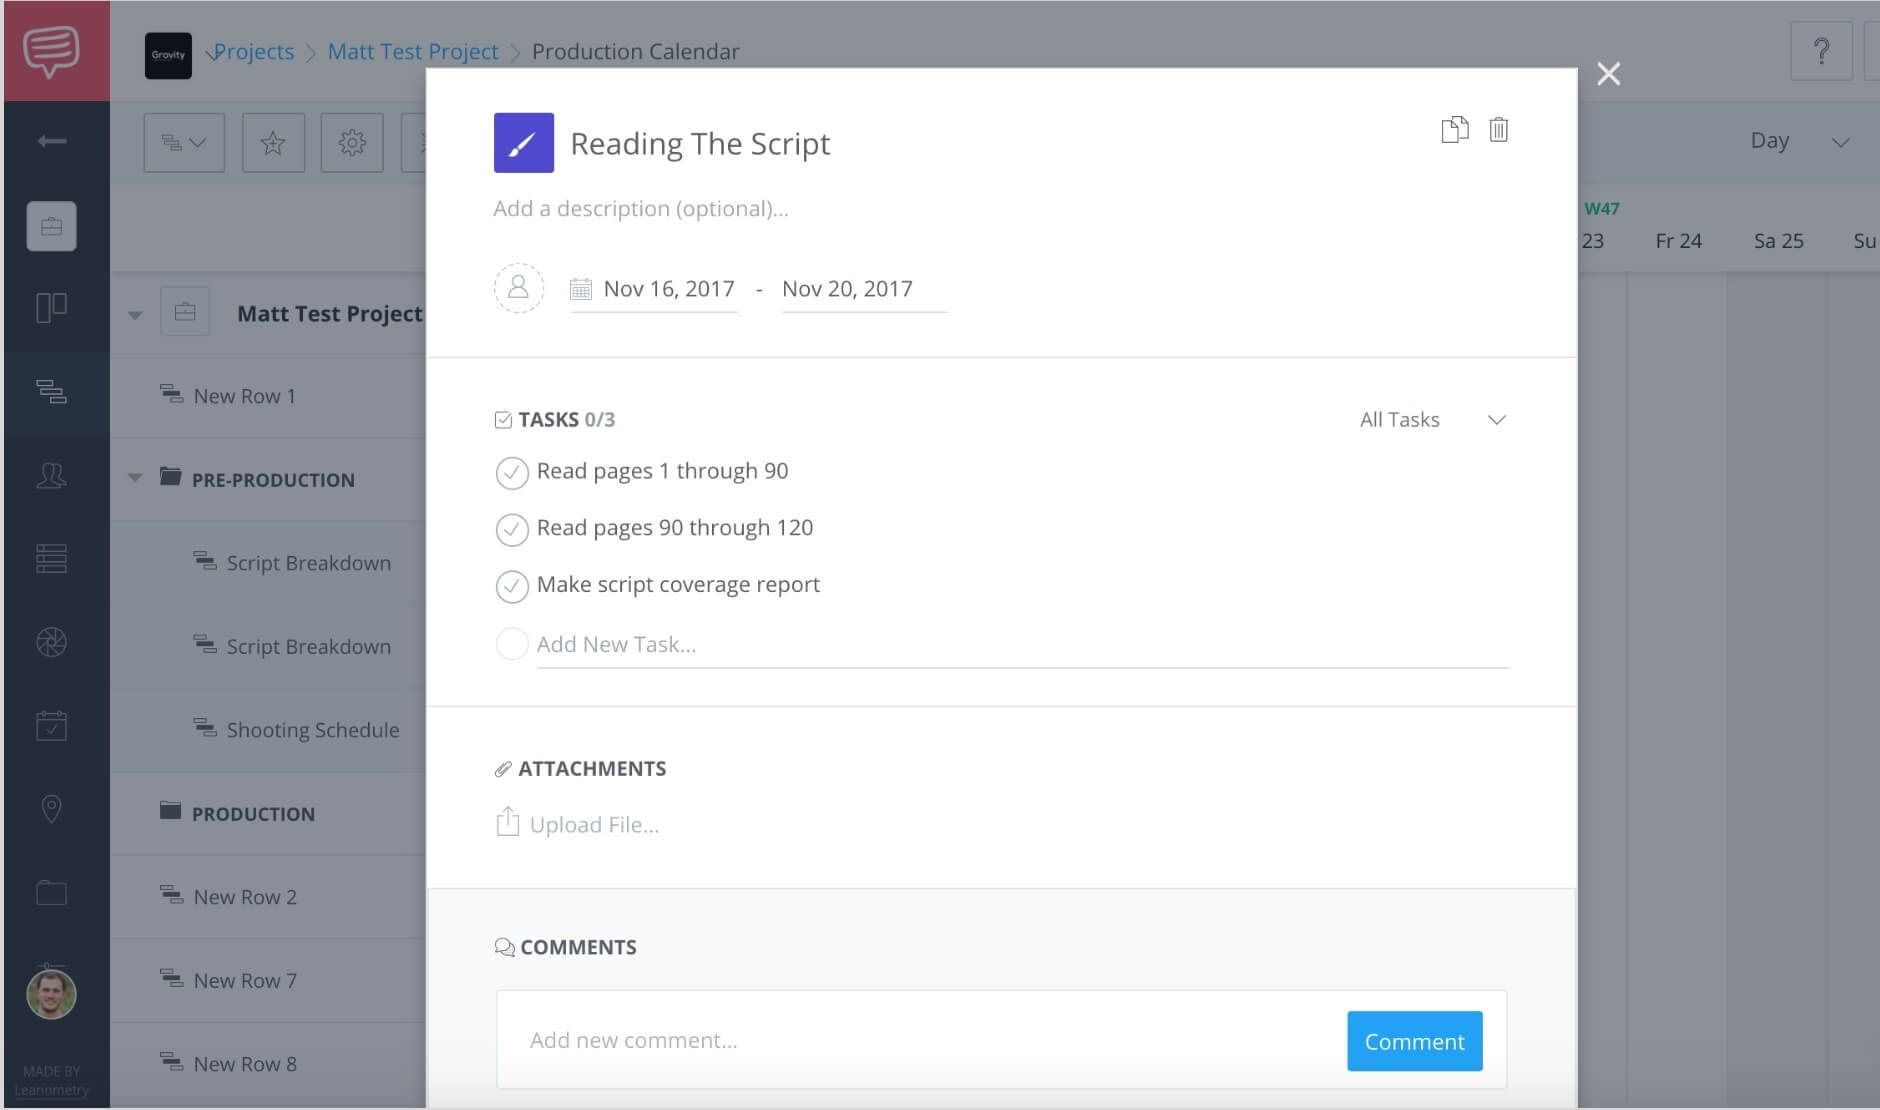
In this case, the tasks of reading and script coverage need to be completed.
Users can click on the check marks to update the rest of the team what tasks have been completed and which are still outstanding.
This is another important benefit of online project management software.
It is also important to make sure that every event has been designated a due date.
In StudioBinder’s online Gantt chart tool, this is located directly above the tasks section.
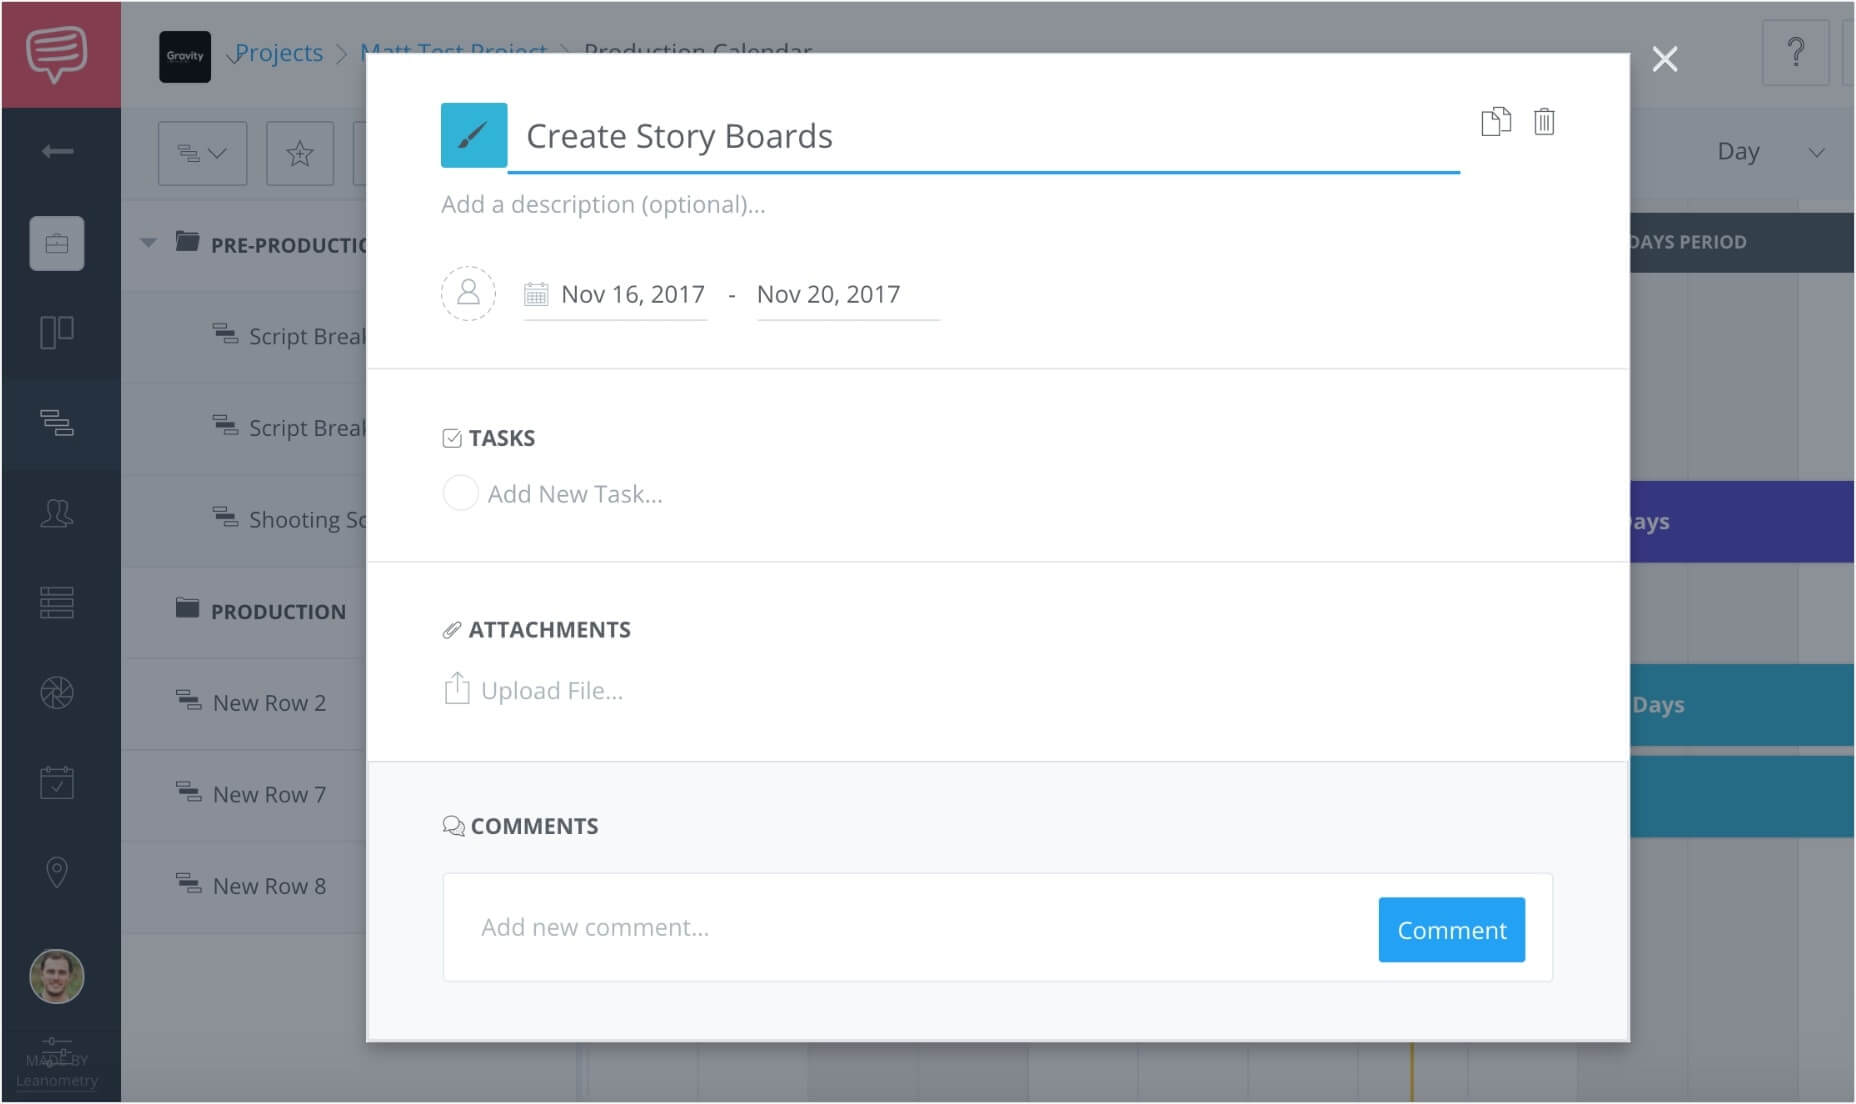
Once a date has been specified, it will then display on event’s block in the project timeline.
Here, we see that creating storyboards will take five days to complete.

Project planning tools such as this allow the entire team to easily identify the start and end dates for an event.
Of course, you can’t just create events without assigning them to specific team members.
Another perk of online project management software is that you can add multiple team members to certain tasks.
In StudioBinder, member avatars will appear next to the date range section.
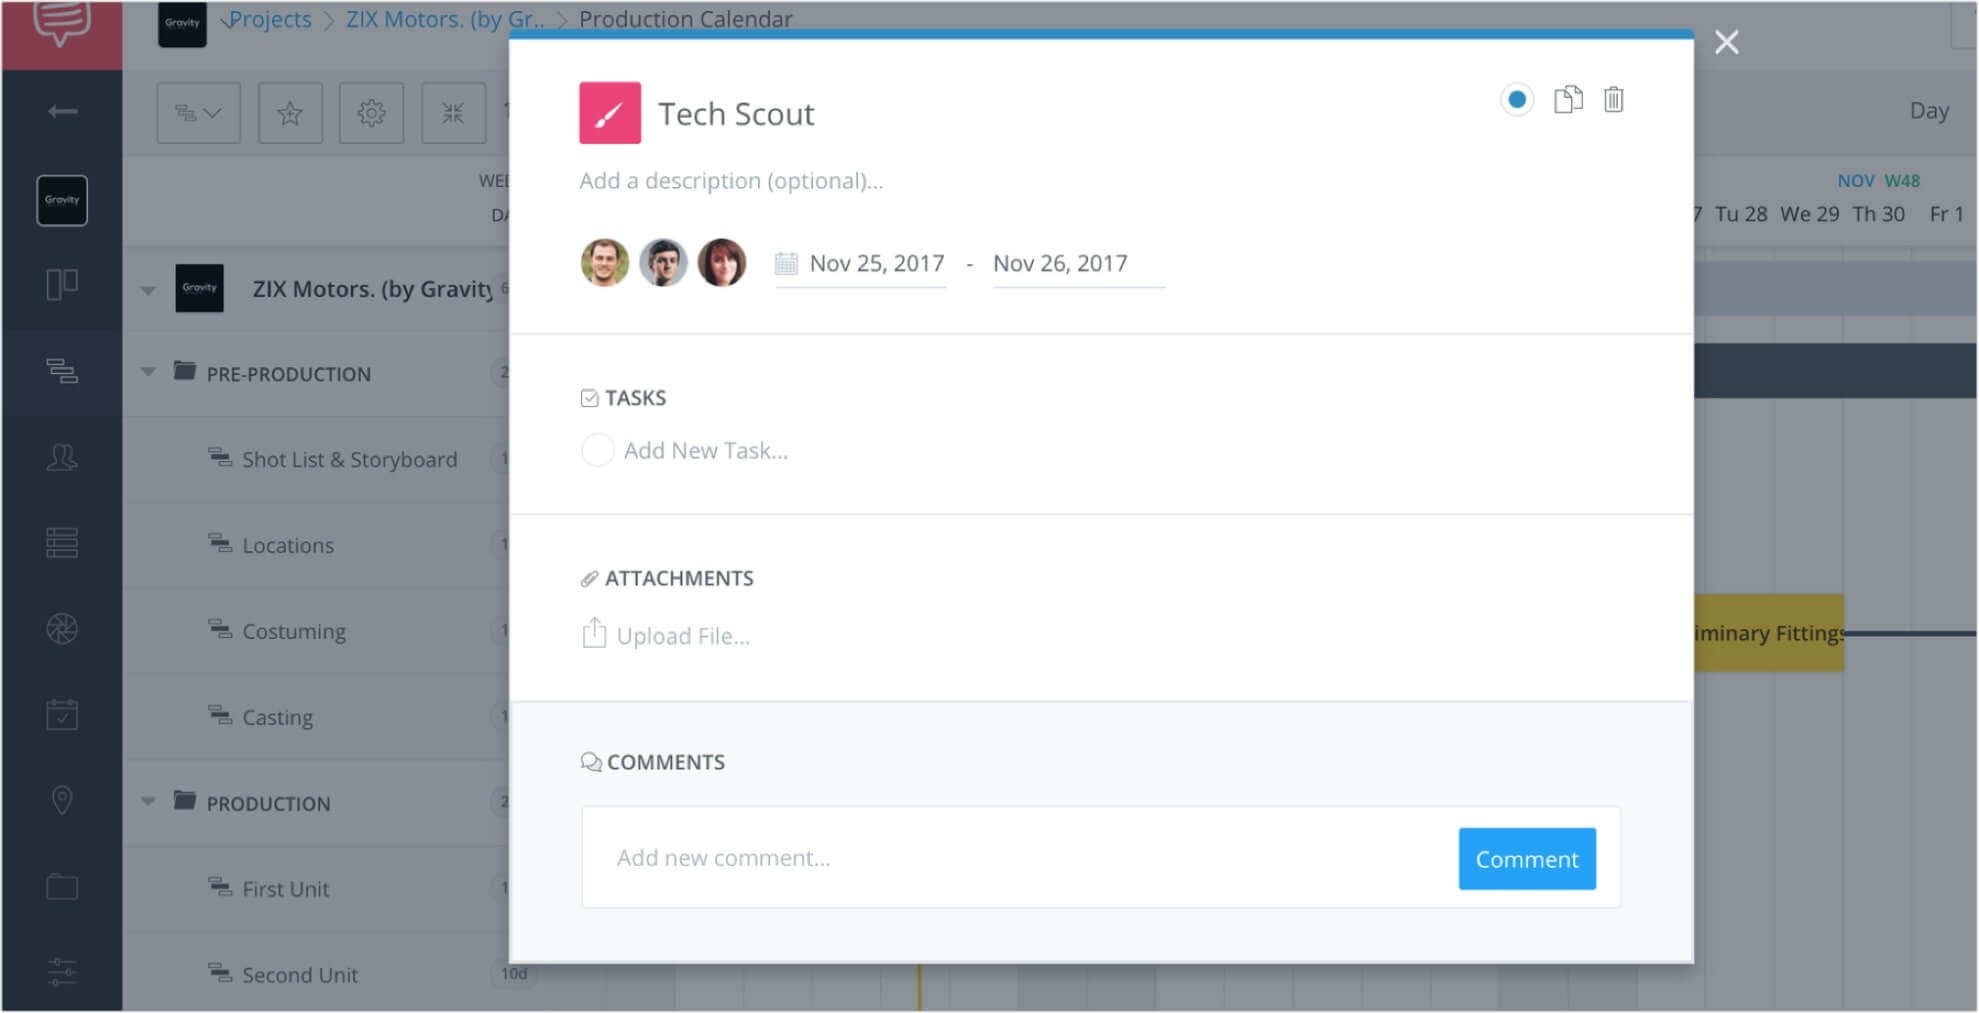
Here, tasks can be easily assigned or re-assigned depending upon member availability.
Once an individual has been assigned to the event, their name will appear in the event bar.
What’s great about online project management software is how customizable it is.
In the StudioBinder example below, people and events can be represented by different colors within the online Gantt chart.
Project planning tools such as these enable team members to easily determine who is responsible for each task.
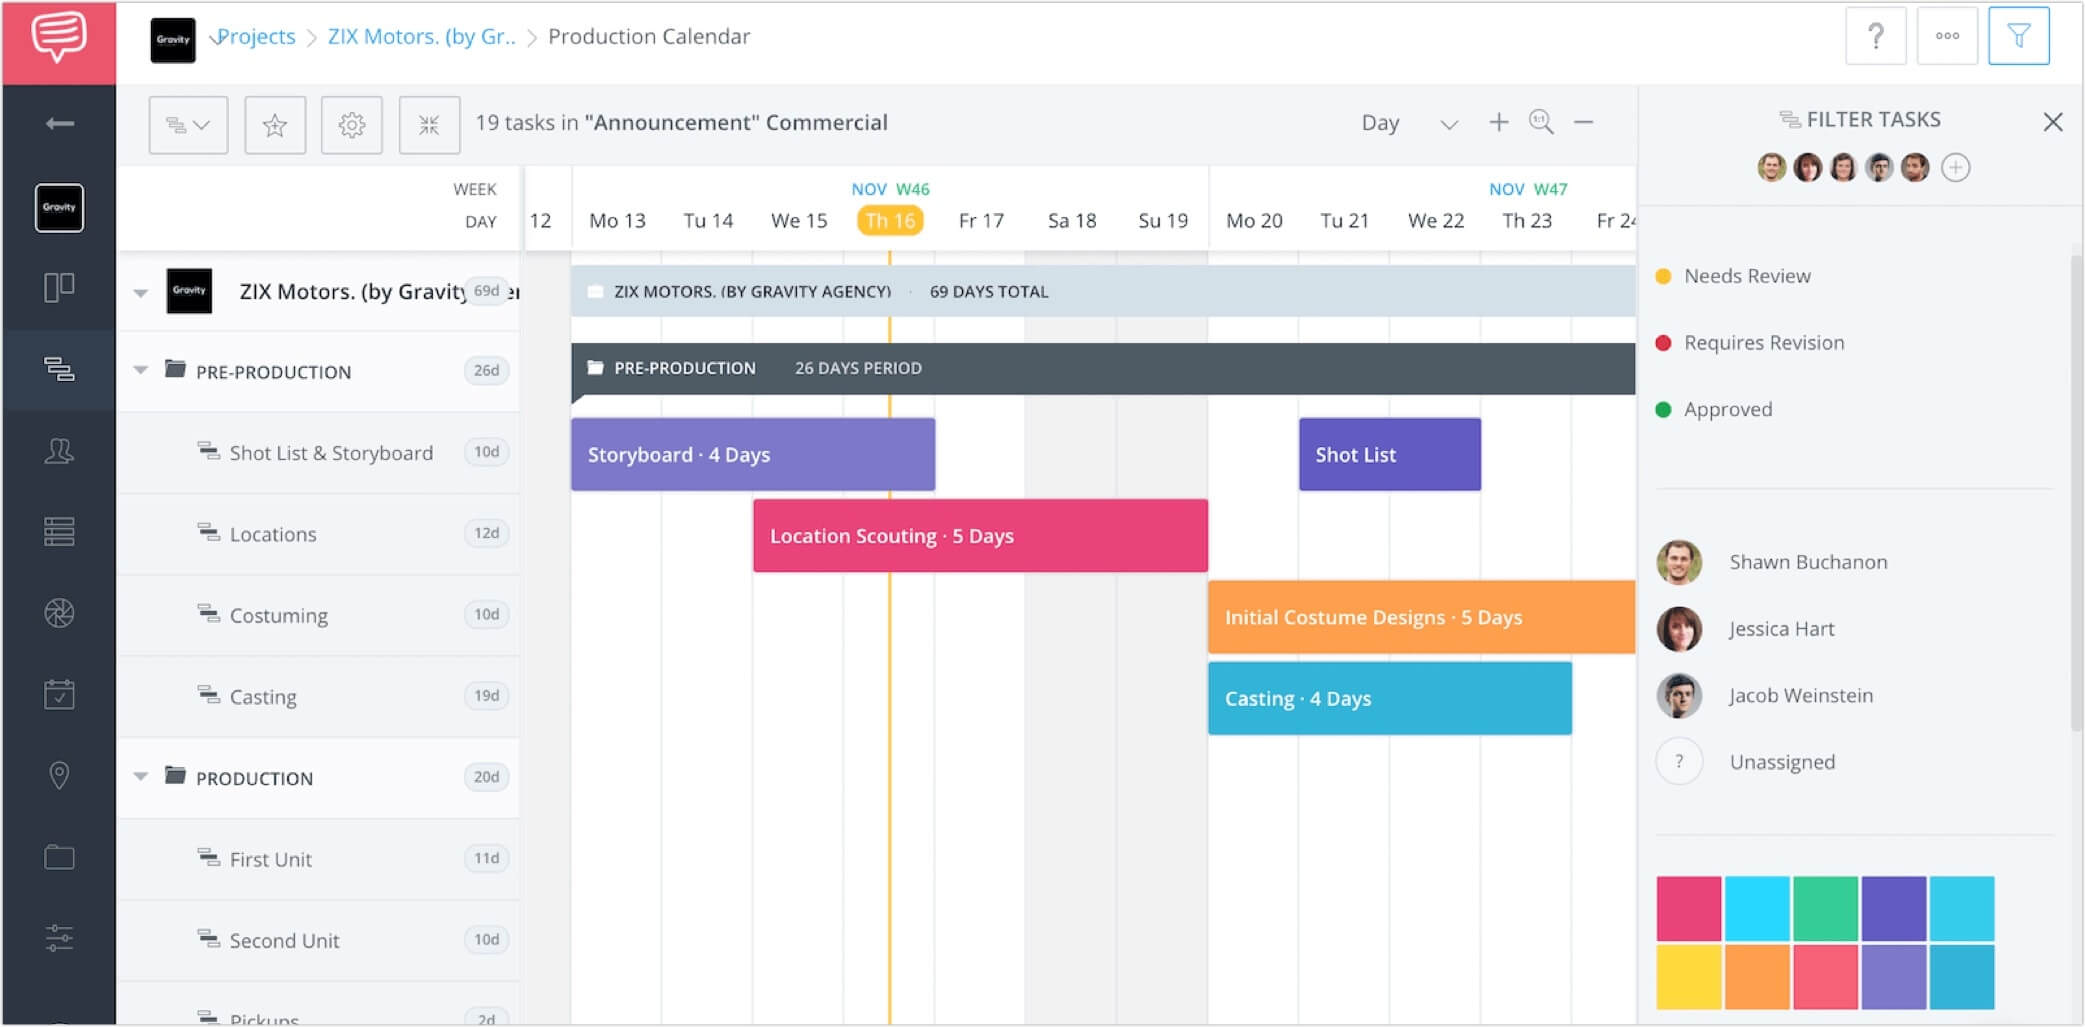
To access this color option, simply choose the desired row on the far left of the screen (Locations, Costuming, etc.) and click edit row.
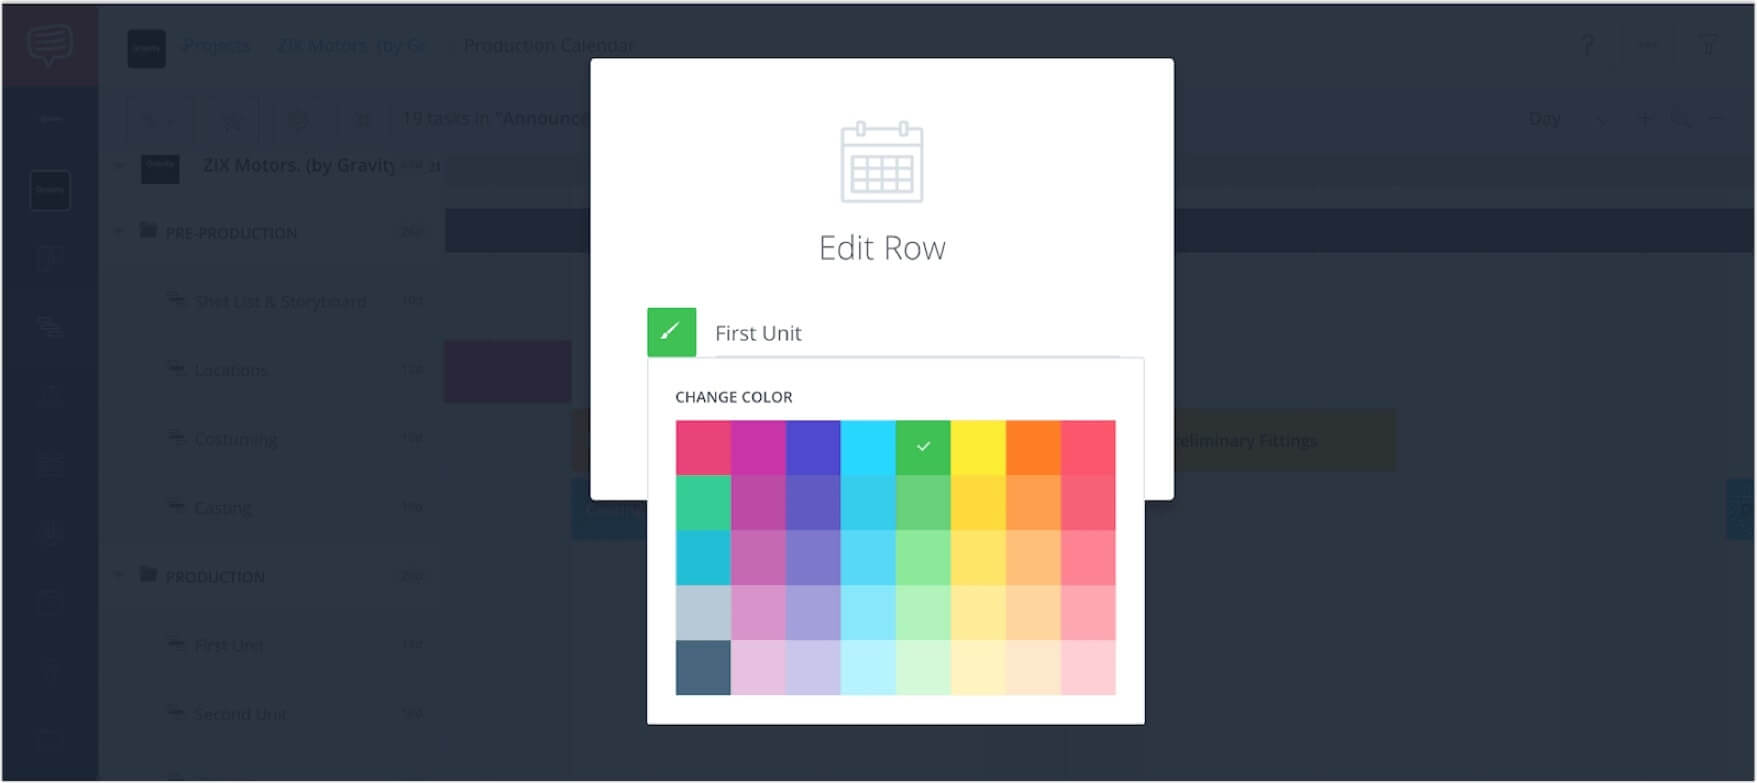
This will then allow you to change the color of the row, and subsequently the color of the events.
Again, this function shows the comprehensive nature of online project management software.
It used to be that in a Gantt chart created in Excel, the ability to create additional notes for a task was almost nonexistent.
The online Gantt chart, however, enables users to add comments and attach files that support the tasks at hand.
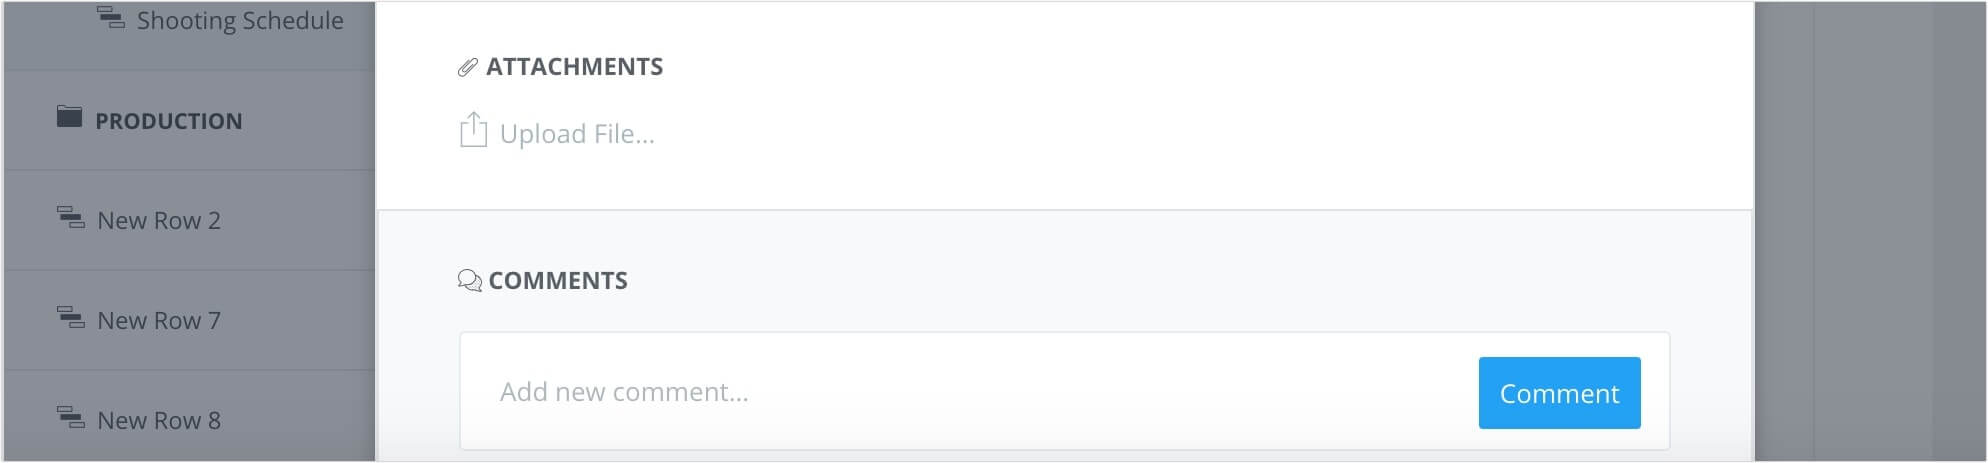
In this StudioBinder example, team members can comment on and attach files that relate to the progress of the event.
Information then collapses conveniently when the window closes and is clearly presented when re-opened.
When discussing project planning tools, this is definitely an essential function for any team.
The question arises of whether online Gantt software is secure or not?
Rest assured, most companies provide high-level security and encryption with their online project management software, and have methods in place for effective data recovery.
The online Gantt chart is an extremely helpful tool for project managers. Besides managing complex information, the project planning tools such as these enhance team coherency and productivity.
Churchill's wartime compatriot Dwight Eisenhower once said, “Plans are worthless. Planning is essential.”
Using online project management software will greatly improve a project’s chances for success.
Still curious? Free online gantt chart software is only the beginning. Learn more about great pre-production tools such as storyboard software or sign-up today and try our production calendar builder for free!
此内容由惯性聚合(RSS阅读器)自动聚合整理,仅供阅读参考。 原文来自 — 版权归原作者所有。