







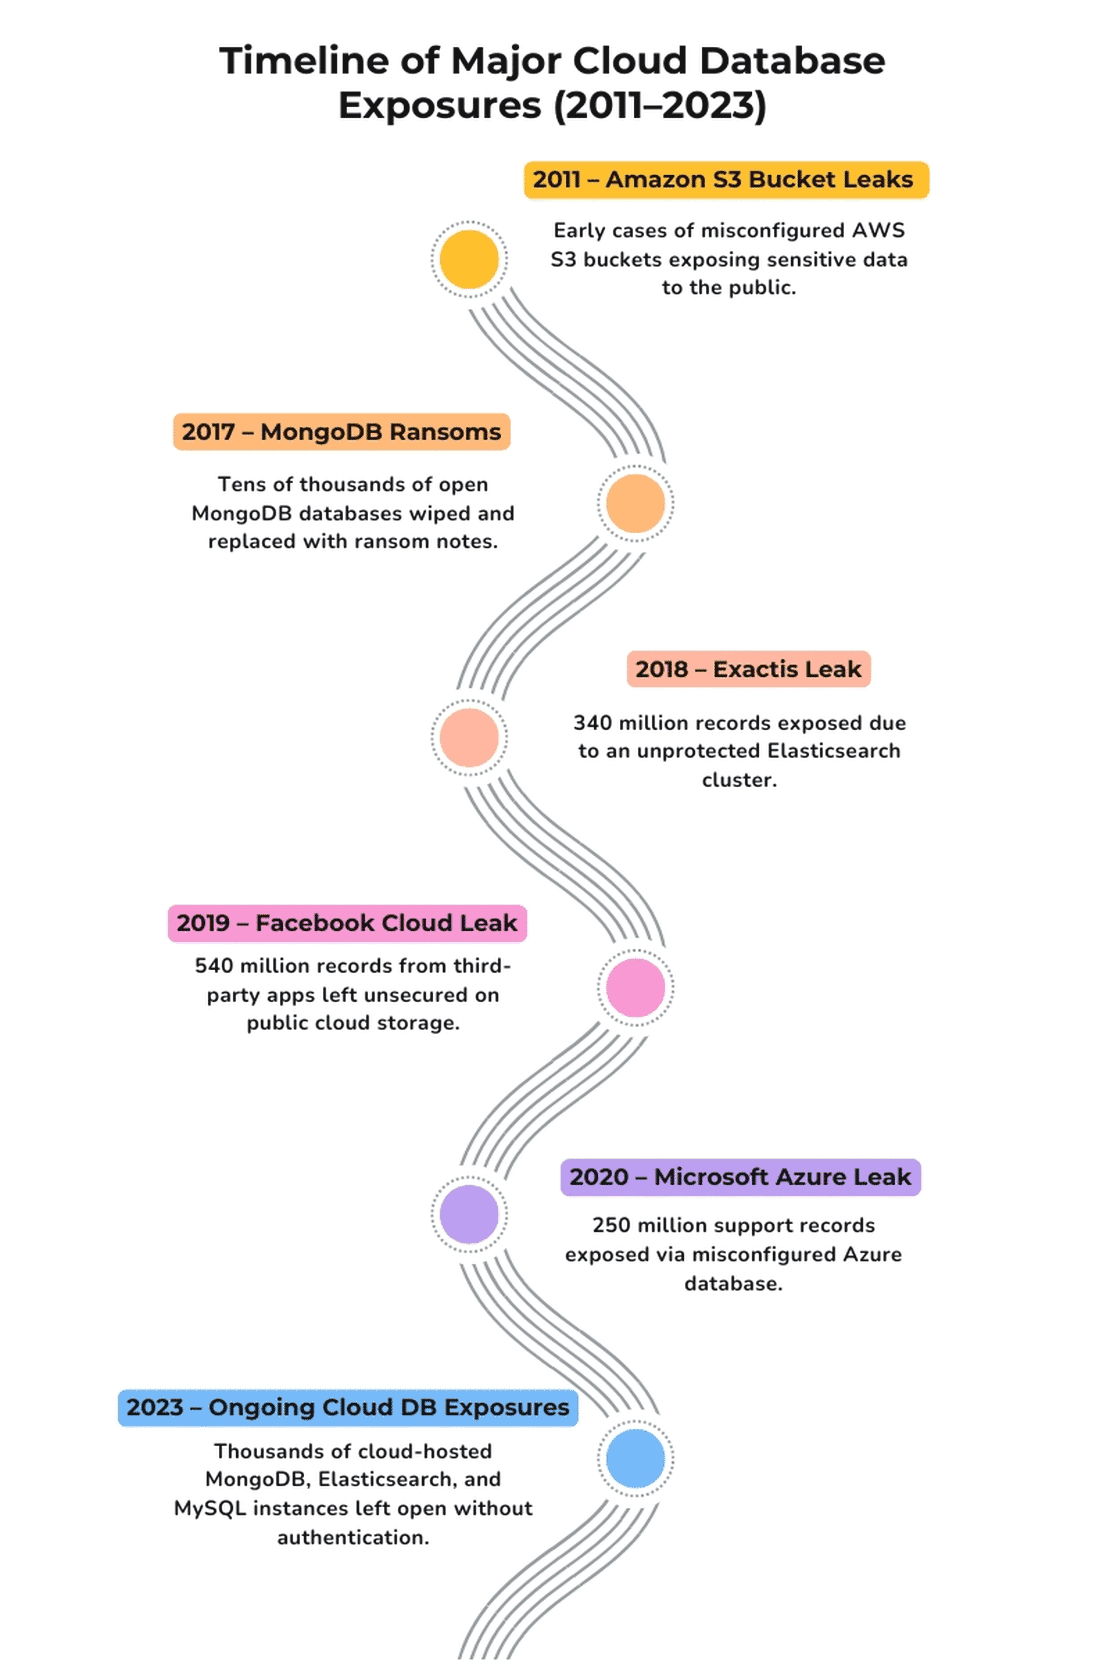
In one of my earlier articles about the largest data breaches in history, I kept running into the same theme again and again - Exposed Databases. Whether it was billions of social media credentials leaking online, or government systems left wide open, many of the large breaches weren’t caused by some crazy hack. Instead they were caused by something far simpler - Databases sitting on the internet with no authentication, no encryption, and no one watching.
Recommended Reading
The Largest Data Breach Ever? How Hackers Stole 16 Billion Credentials
That stuck with me. If so many incidents could be traced back to something as simple as misconfigured databases, I couldn’t help but think - How common is this problem today? Is it just some unlucky cases that made headlines or is there a much larger iceberg beneath the surface.
This question led me down this rabbit hole. I wanted to see how many of the exposed databases on the internet are secure and how many of them are misconfigured. Using Netlas, a platform that continuously scans internet facing systems, I decided to conduct a research.
So let’s get into the depth of this research and answer the question.
For this research, I decided to focus on six of the most widely used database technologies:
These databases power everything from startups to Fortune 500 companies, and together they are the backbone of most of the modern internet. Each of these systems has its own strengths, but they also share a common weakness - when left exposed to the internet without proper configuration, they can leak massive amounts of sensitive information.
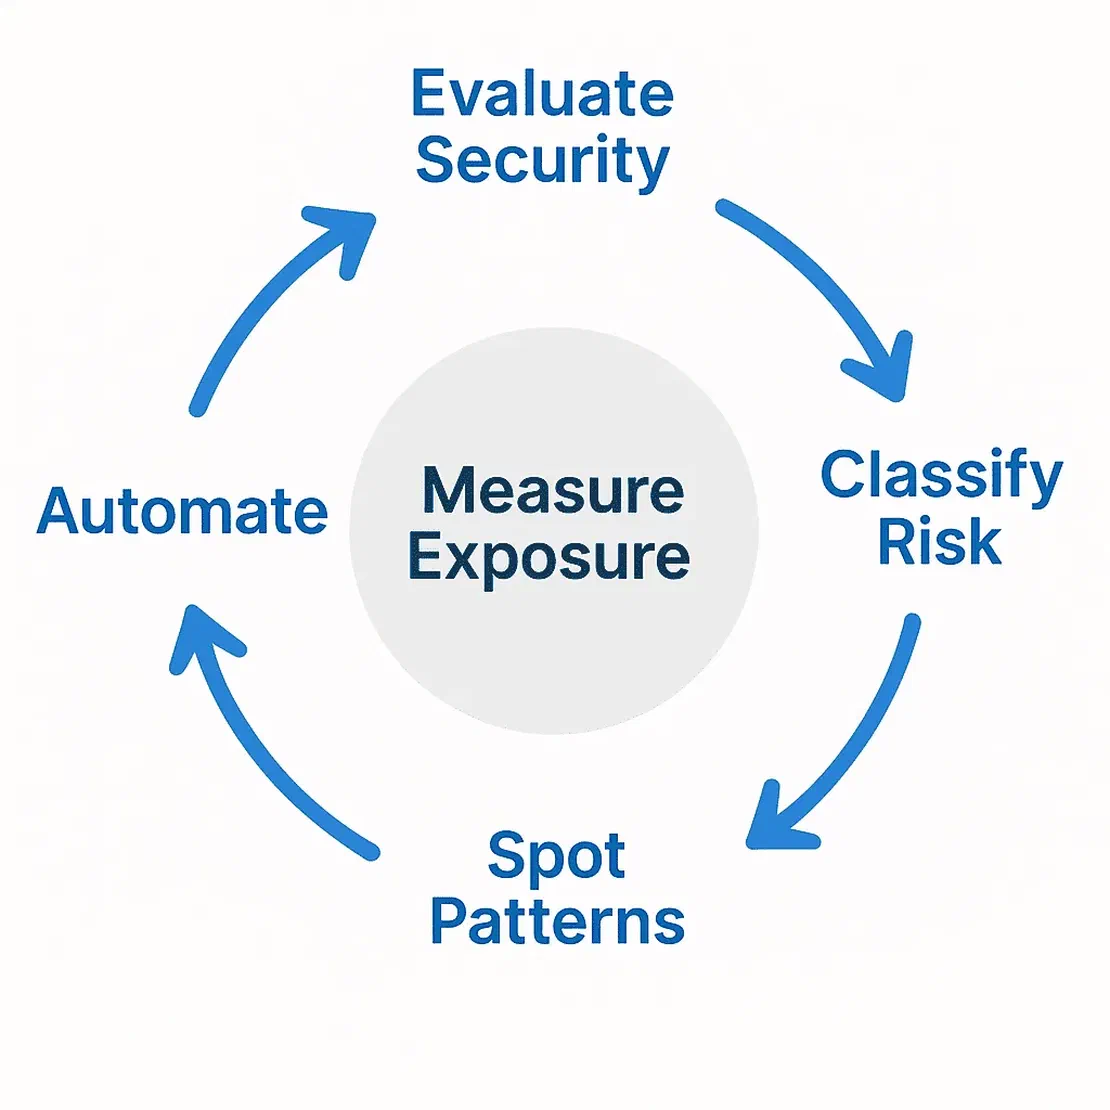
Now talking about the objectives of my research, simple yet ambitious:
To carry out this investigation at scale, I needed more than just curiosity, I needed visibility into the global internet. That’s where Netlas came in.
If you are reading this article, you probably know about Netlas by now, but if you don’t - Netlas is like Google for the internet’s exposed assets.
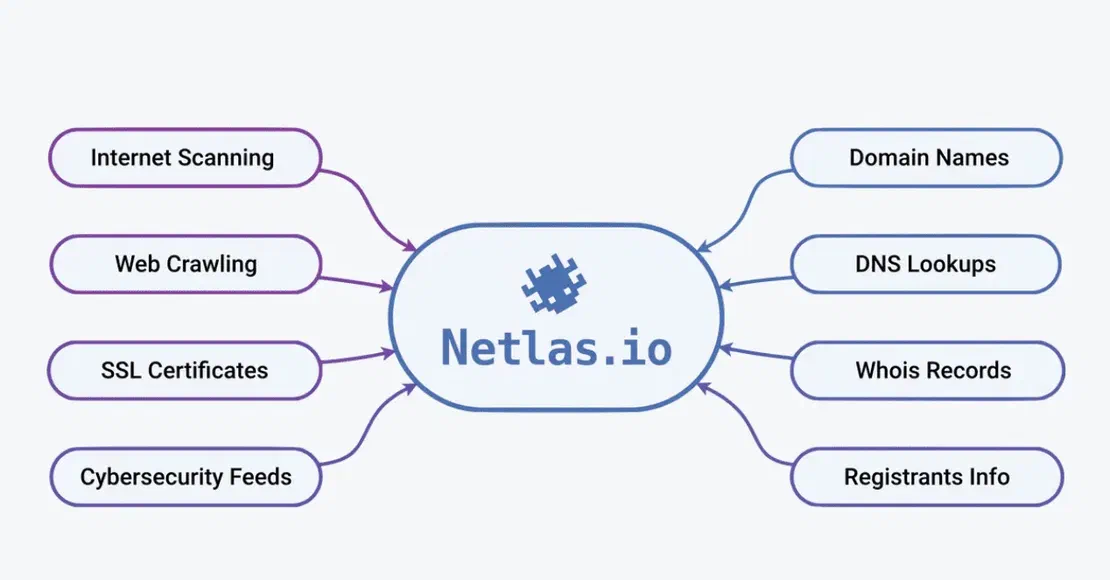
It continuously scans the global internet for IPs, ports, domains, WHOIS records, DNS data, etc, and organizes all of it into a structured, searchable index. At the time of writing, Netlas tracks:
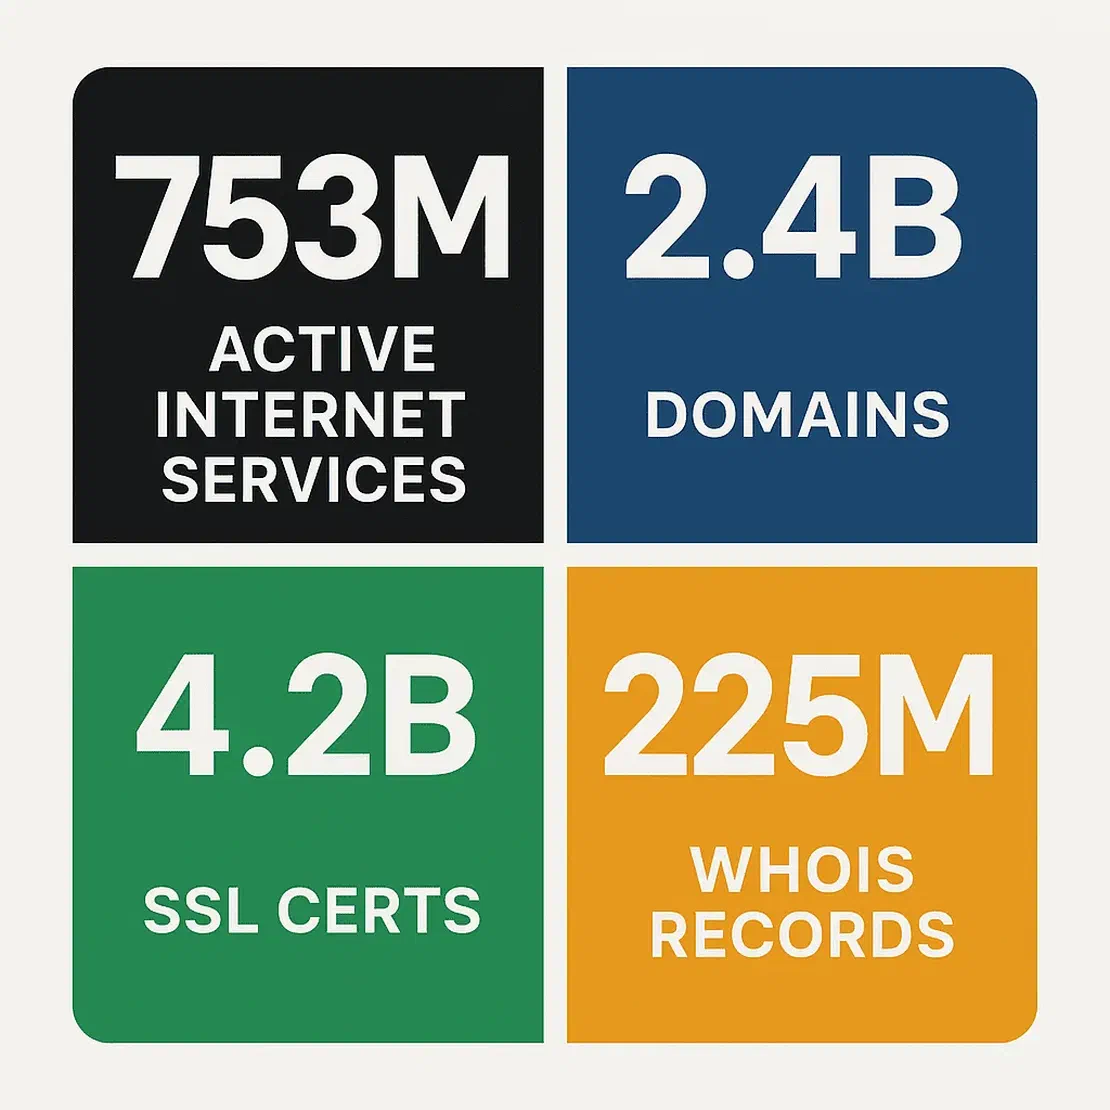
Why Netlas was perfect for this research
I needed three things to make this research possible: scale, detail and automation.
The Dataset I Worked With
Using Netlas’s API and datastore, I collected results for six database systems: MongoDB, Elasticsearch, MySQL, MSSQL, Oracle, and PostgreSQL.
But working with a dataset of this scale was just the start. The real challenge was figuring out how to turn this data into meaningful insights. I wanted to measure how it was exposed, which controls it failed, and how much risk it posed. But to get there I needed a structured approach, This is where the research methodology comes in.
Once I had the raw dataset in hand, the next step was to transform it into something meaningful. Collecting three million+ exposed database sounds impressive, but numbers alone aren’t always enough. What matters is understanding how securing or insecure those databases really are. To do that, I broke the research down into a few key steps:
The first challenge was of course to find the exposed databases. Netlas allows very specific searches using its query language, so I could easily pull:
protocol:mongodb -> to get mongoDB instances.protocol:"mysql" OR "mongodb" -> to get MySQL & MongoDB instances.Each query returned raw JSON or CSV records that described the exposed service in detail like IP address, port, banners, flags, versions, geolocation, and much more. Instead of manually taking the data, Netlas gave me a really easy way to collect the evidence I needed.
The exact query I used was:

protocol:"mysql" OR protocol:"oracle" OR protocol:"mongodb" OR protocol:"mssql" OR protocol:"postgres" OR protocol:"elasticsearch"Every database type speaks its own language. MongoDB returns fields like is_master, while MySQL provides capability_flag, and Elasticsearch exposes cluster_state, to compare them side by side, I needed to create a common schema.
This is where my Python tool came in. It automatically:
Now that I had the data ready to be tested, I needed to define some security controls for each type of database.
This was the heart of the research. Once I had millions of records normalised into a single schema, the next question was “What exactly am I checking for?”
A database being online doesn’t necessarily mean it’s insecure. To separate the dangerous exposures from the harmless ones, I needed a checklist - a set of security controls tailored to each datatype.
I didn’t invent these controls from thin air, each one came from established guidance like CIS Benchmarks, NIST, ISO, but adapted into a form I could actually test at scale through Netlas data.
Here are the controls I implemented for each database:
A “control” in this study means a specific check (e.g., authentication, TLS, error verbosity) that determines how secure or exposed a database is.
Although the main focus of this research is really about looking at each control in isolation, seeing how often authentication fails, how often version info leaks, I realized that for the readers it might be easier to digest if there is a single label that captures the overall picture.
Of course, I want to be clear upfront: risk labels are an approximation. Giving something a “Critical” or “Low” tag based purely on network banners is not the same as a full security assessment. But it helps highlight broad patterns across millions of records.
Risk labels are not penetration tests, they’re simplified indicators that highlight broad patterns at scale.
To get there, I implemented two simple approaches:
This method was intentionally simple. It doesn’t capture the nuance that some controls are far more important than others
I also tried a weighted scoring system.
Controls were assigned weights based on their severity:
This score isn’t mapped directly to any label, but it gives a numeric risk index that can be compared across instances.
These models are not perfect risk assessments, they are just rule based simplifications. For example, a database could fail just two controls but if one is authentication, the real-world impact is massive. That is why in this article, the main focus remains on per control fail/pass rates to see which misconfigurations are actually happening at scale. The labels are just to provide contextual summaries, not security ratings.
When I first started collecting raw Netlas data, I quickly realised that there was no way I could handle millions of JSON records by hand. I needed something that could stream through the data, normalise it, apply controls and then give out the results, all without me touching a single row.
That’s how the idea of building a tool for this was born.
At first, I wrote small test scripts like demo.py to query a few hundred rows and see what the raw banners looked like. This was mostly for exploration, I wanted to see what JSON looked like for all the different databases and what fields I could use as evidence in my security controls.
But as soon as I scaled up to tens of thousands of rows, I realised that I couldn’t just write one-off code for each database. I needed a proper pipeline, That’s when I split the project into three key parts:
I built individual “control” scripts inside controls/ folder, one for each database type. Each module contains:
The real brain of the project is processor.py. This script is responsible for:
This meant that no matter what database type Netlas gave me, I could push it through a single standard workflow and get structured results back.
Finally, all of this came together in the stream_runner.py script, the automation engine of the project. This is the script I ran for the 3.2 million dataset.
Here’s what it does:
One of my goals wasn’t just to finish my research but to make the process reproducible and transparent. That is why I released the tool under the Netlas Github Organization as Netlas-Studies.
Firstly you can go to netlas-studies and clone the repository by:
git clone https://github.com/netlas-io/netlas-studies
and then run:
pip install -r requirements.txt
For using the tool, you will also need a Netlas account, Upon creating an account with Netlas you will find an API key in your profile which will be used to run the tool.
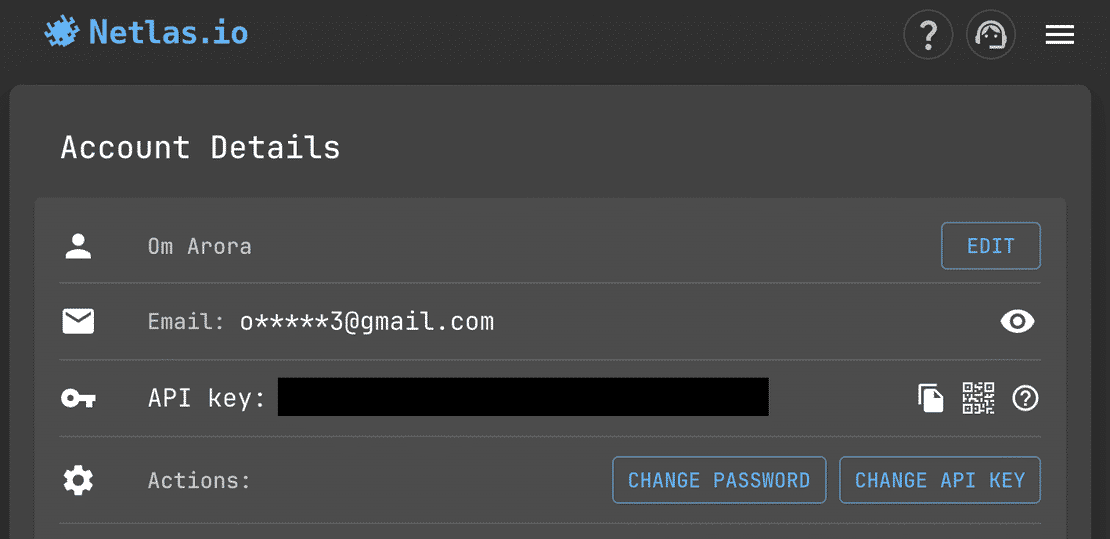
Anyone with a Netlas API key can run a single command like this:
python3 stream_runner.py \
  --query '(protocol:"mysql" OR protocol:"postgres")' \
  --size 100 \
  --token YOUR_NETLAS_API_KEY \
  --out ./results
And they will get exactly what I got:
This makes the project useful for the wider community.
Once the automation pipeline was in place, the real excitement began. I pointed my tool at Netlas with the “all databases” query and let it run. Over the course of a few hours, millions of database instances streamed in, each one normalised, tested, and scored automatically.
What I got back wasn’t just a giant 20GB CSV, it was a snapshot of how exposed databases look on the internet right now.
To keep the tour sane, I will start with the widest view (Who’s out there and how many), then go service by service, then down to specific controls, countries, providers, and time.
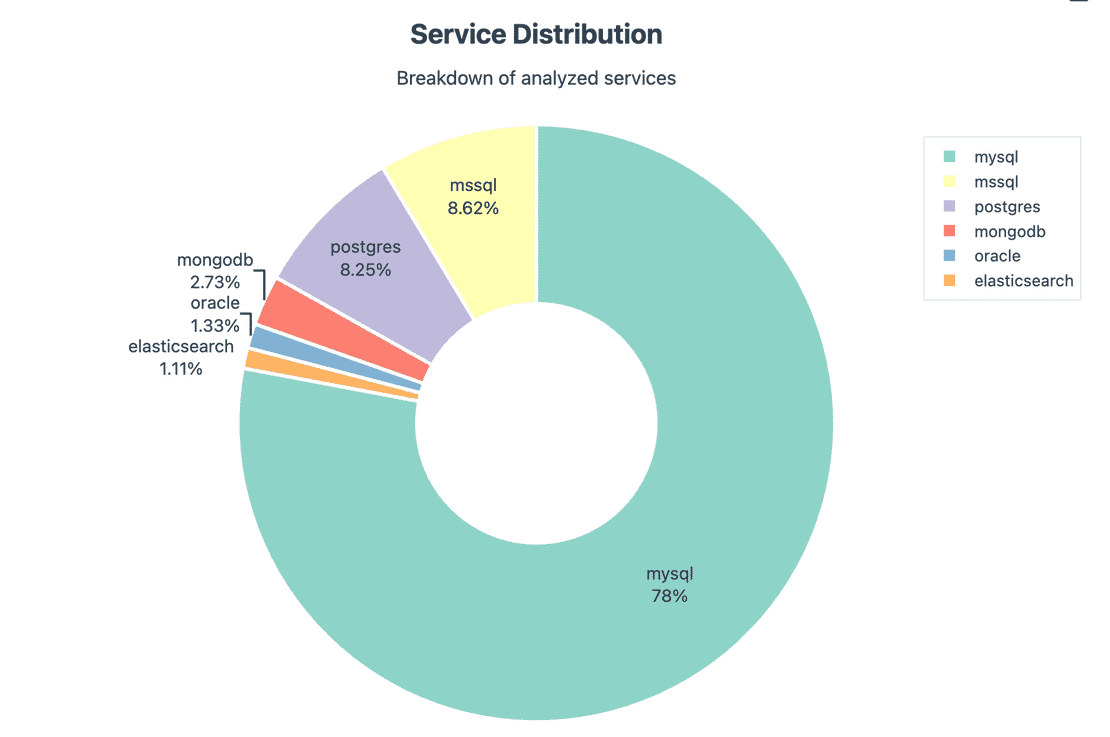
Before talking about risk, let’s understand the composition. The dataset is not uniform:
This matters, because when you later see the global risk figures, remember they’re weighted by who shows up the most.
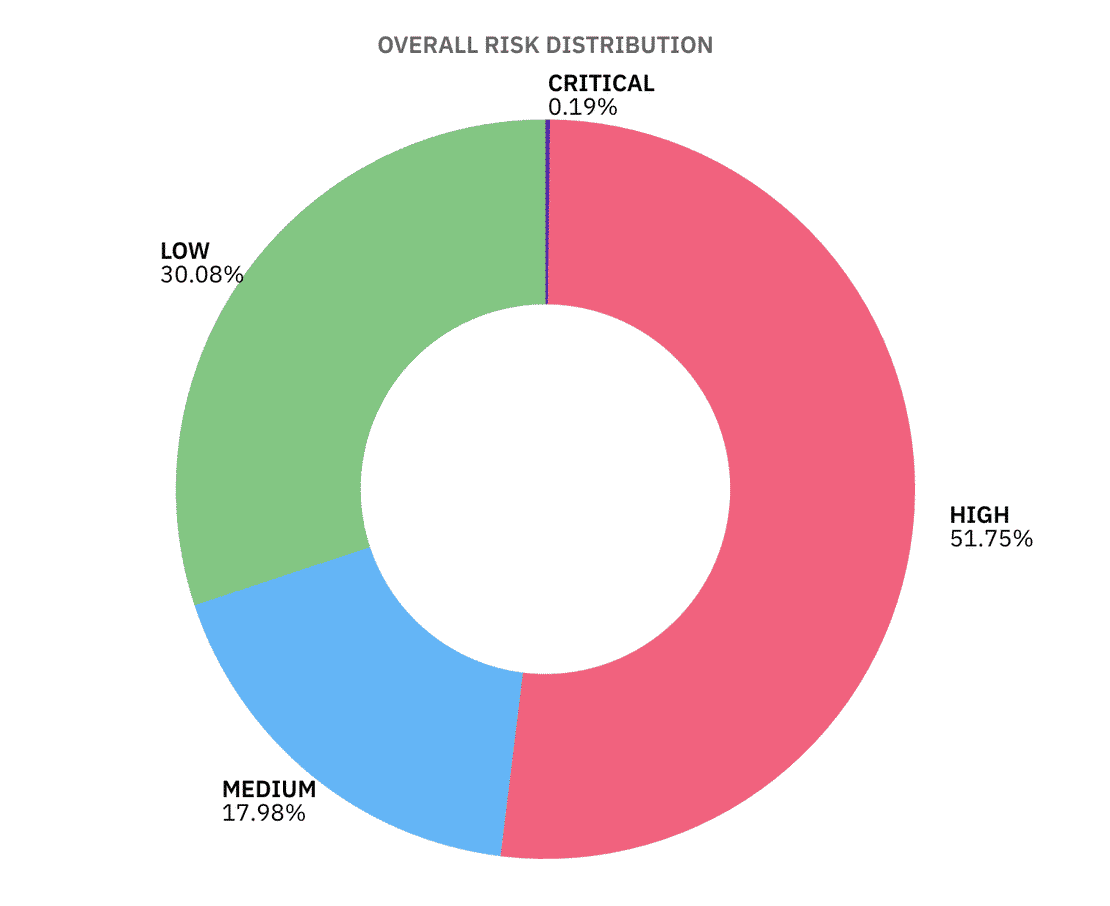
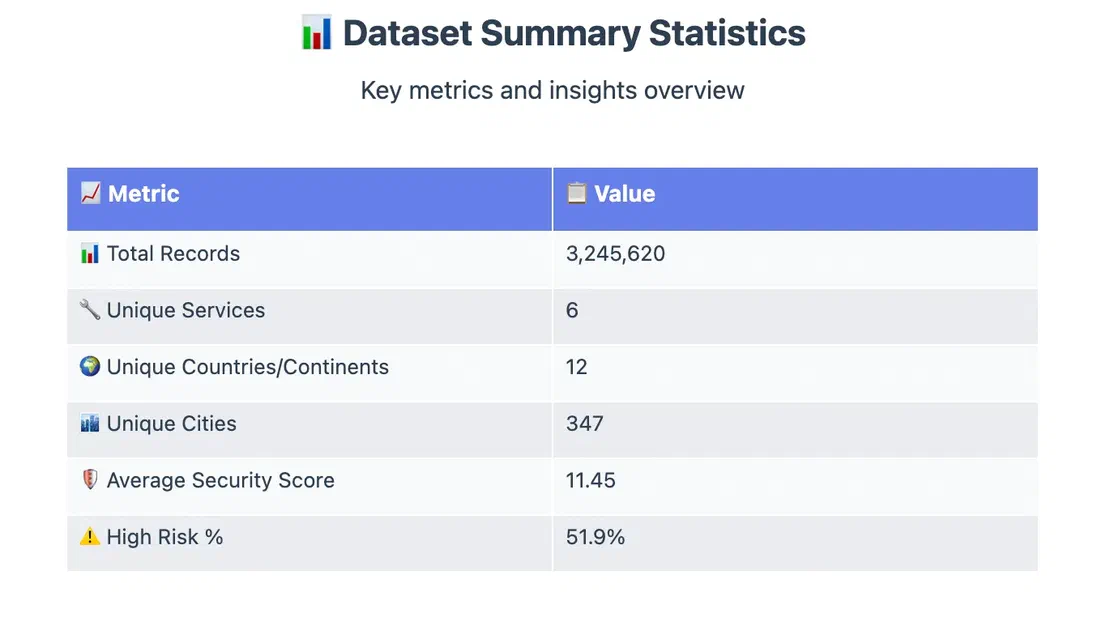
According to our simple risk assessment model, out of 3.25M+ internet-facing instances, 51.75% land in HIGH risk, 17.98% in MEDIUM, 30.08% in low and just 0.19% in CRITICAL, since our risk model had a condition where if more than 90% of the controls failed, it will be considered as CRITICAL, the critical percentage is low.
So many High risk instances are due to problems like missing TLS, noisy banners, default ports, etc, all the small things add up to exploitable surface area at scale.
But there are few things to keep in mind:
High risk doesn’t always mean “hacked tomorrow”, but it does mean attackers see you as low-hanging fruit.
Now let us have a look at the Fail count distribution.
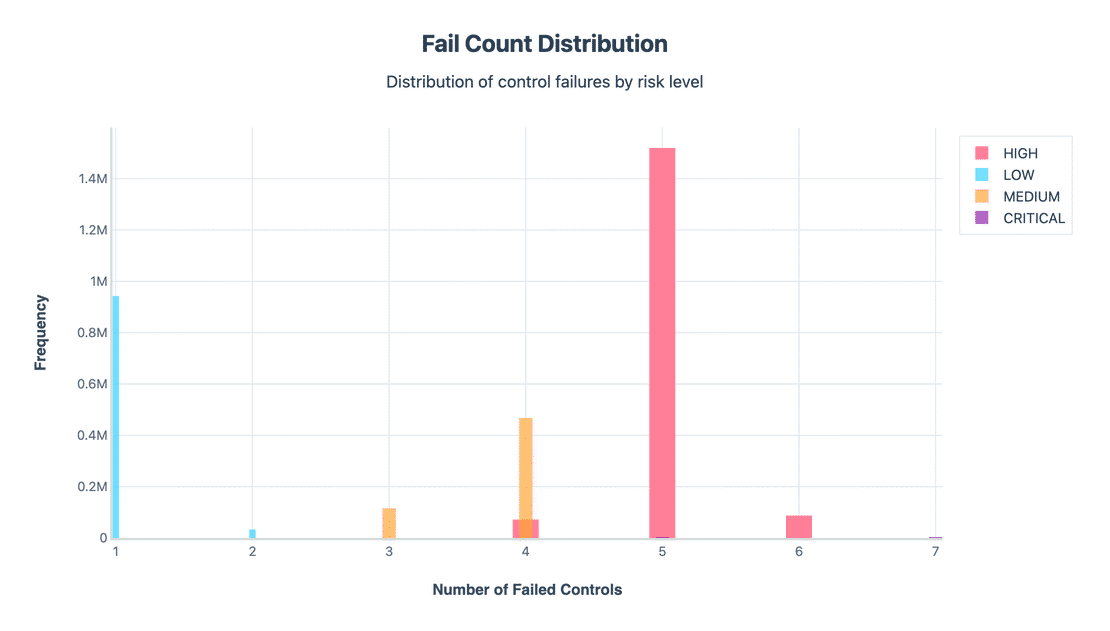
The distribution of failed controls shows a clear staircase:
Now Let’s see the Risk levels by service
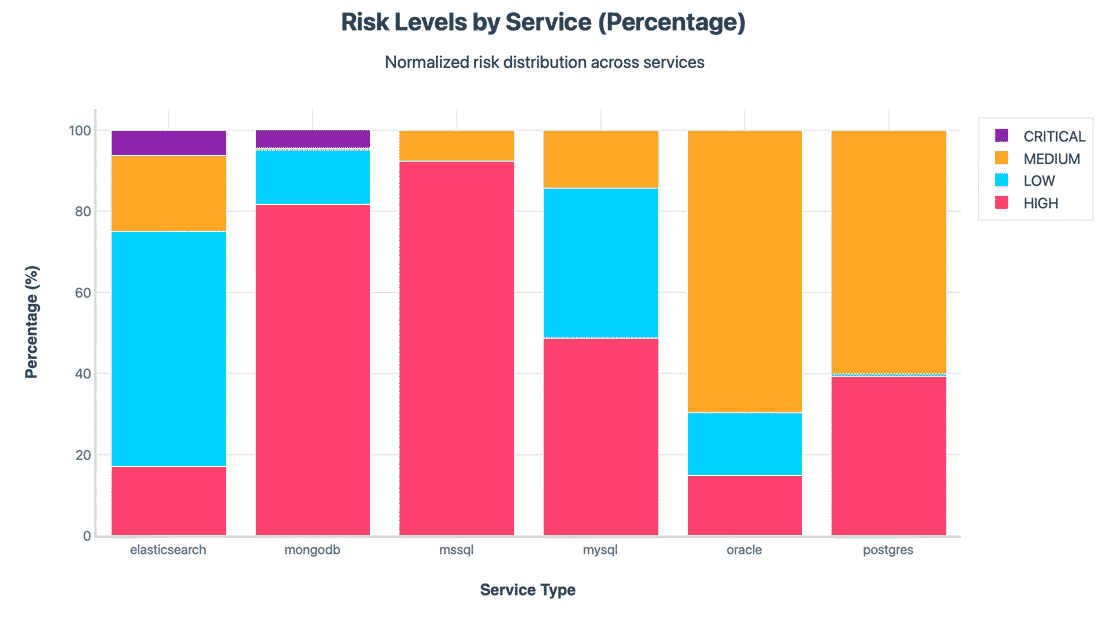
The above chart dominates each database family to 100% so you can compare shape, A few clear patterns are:
These will make more sense once we look at the per control fails and pass rate.
Up to this point, we have looked at the global picture of how the risk spreads across all databases. But each database type has its own story. To really understand the problem, we need to go one layer deeper:
Below, I break down each of the six databases one by one, using the same controls defined earlier and visualizing their failure pattern.
Elasticsearch has long been a frequent source of exposure incidents because of its open by default behaviour. In this dataset, I identified 36,142 Elasticsearch instances directly exposed to the internet.
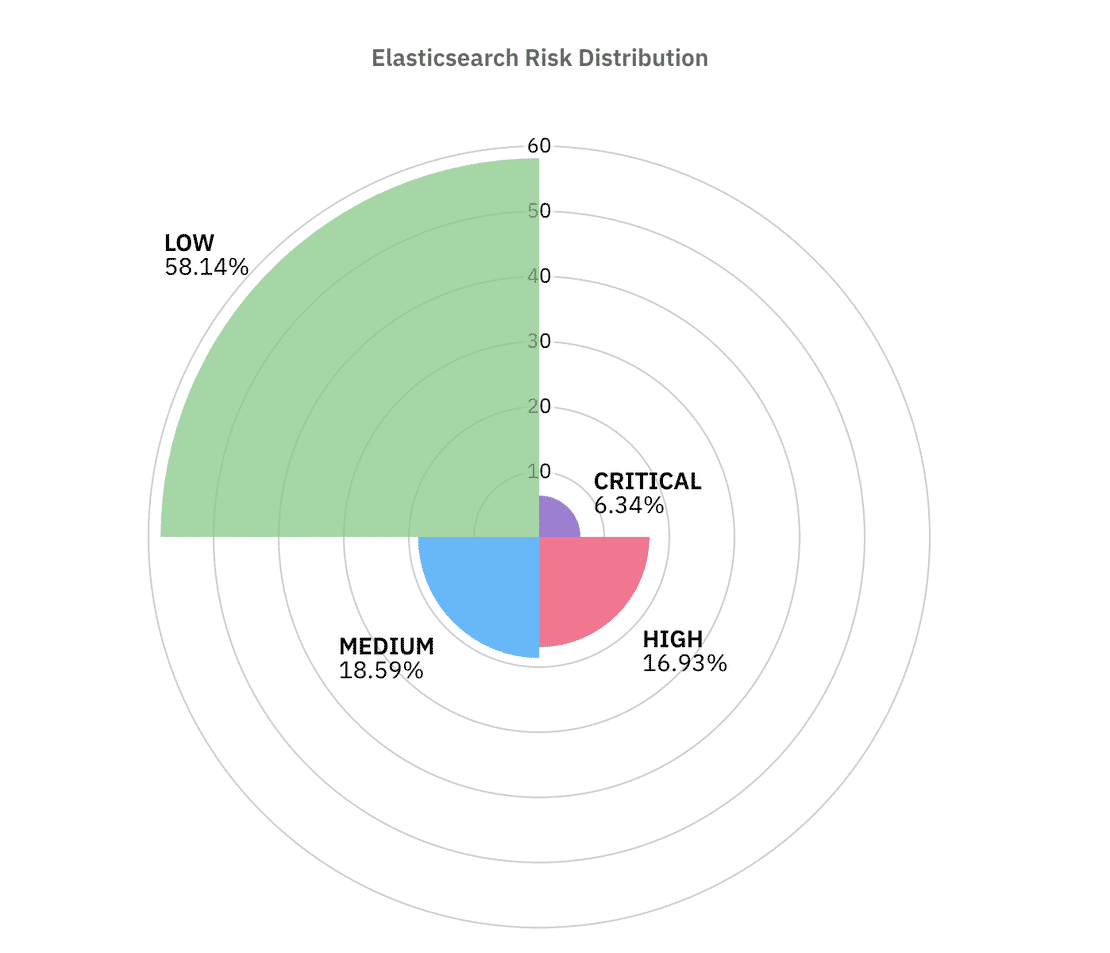
As we can see from the above graph, over 58% of the instances passed most of the controls but the remaining ~42% of the instances lie in the similar ranges.
Now let us see the various controls analysis and figure out the top factors leading to this risk distribution, First let us look at the authentication Stats -
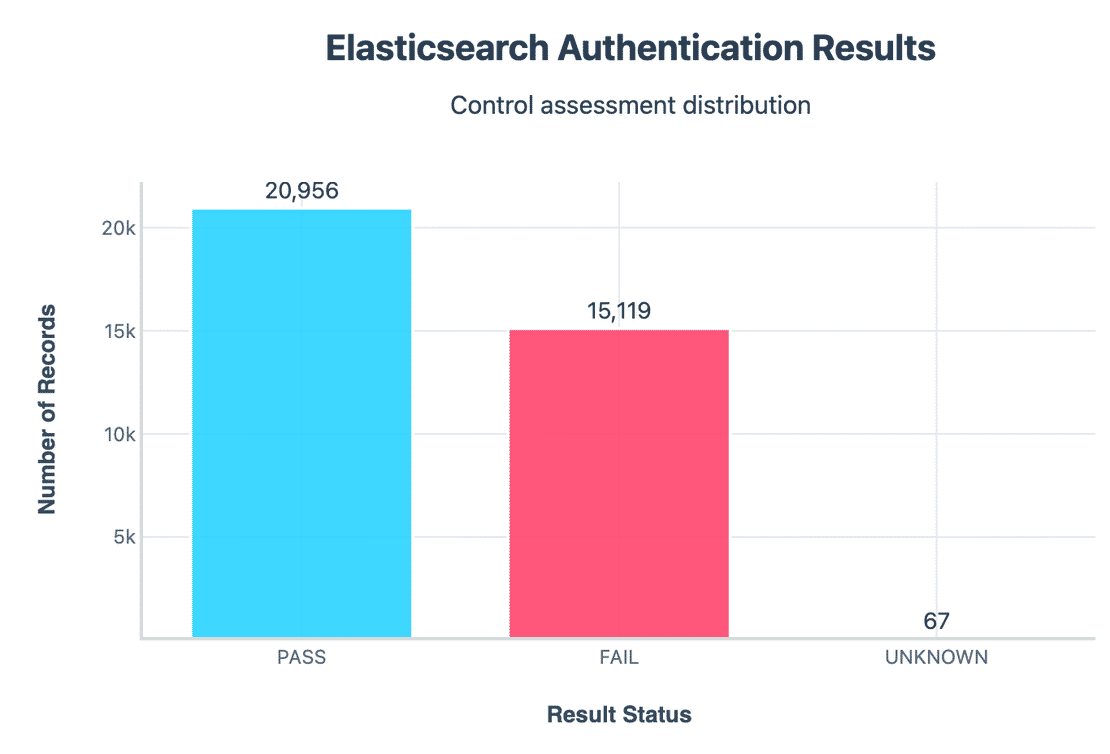
Out of all the instances, around 21k (58%) passed authentication and over 15k (41.8%) failed authentication. This means anyone on the internet could directly query sensitive endpoints without needing credentials. Because the older versions shipped with authentication off by default and many admins never fixed it. This is one of the biggest contributors to “Critical Classification”.
Another big contributor is the TLS Control -
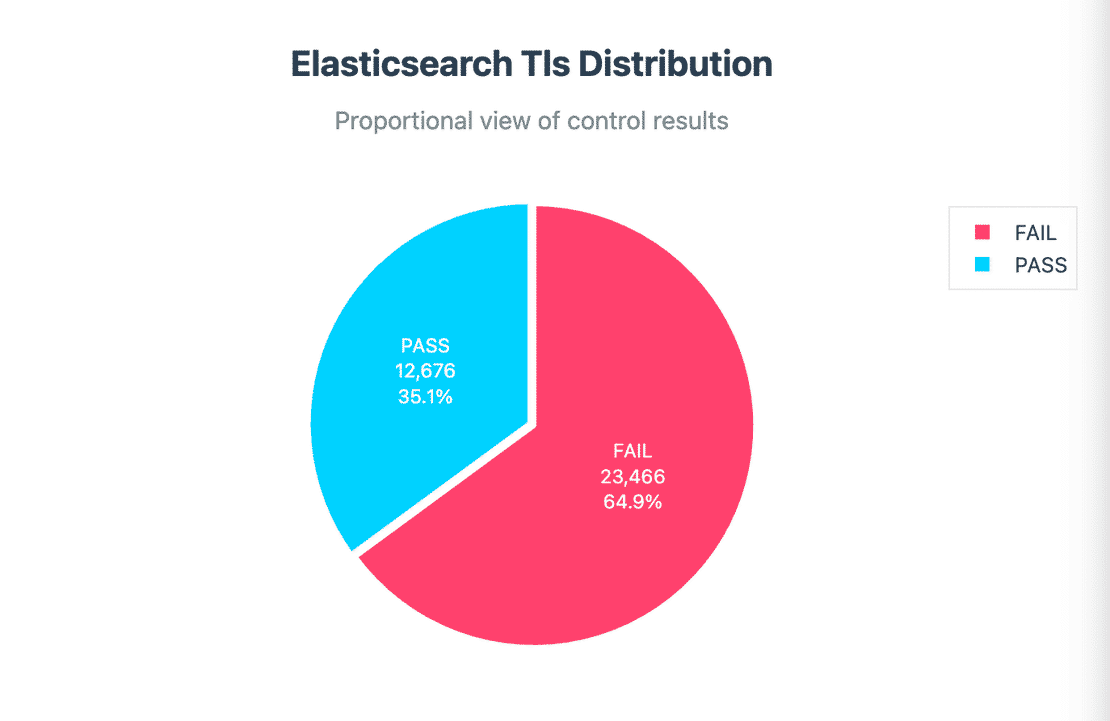
23,466 clusters did not use TLS, meaning all data exchanged between client and the cluster travels in plaintext. Since TLS requires extra setup and certificates, many organizations skip it, but when those same clusters are exposed to the internet, they become high risk targets.
Here are some more stats for the other 4 controls:
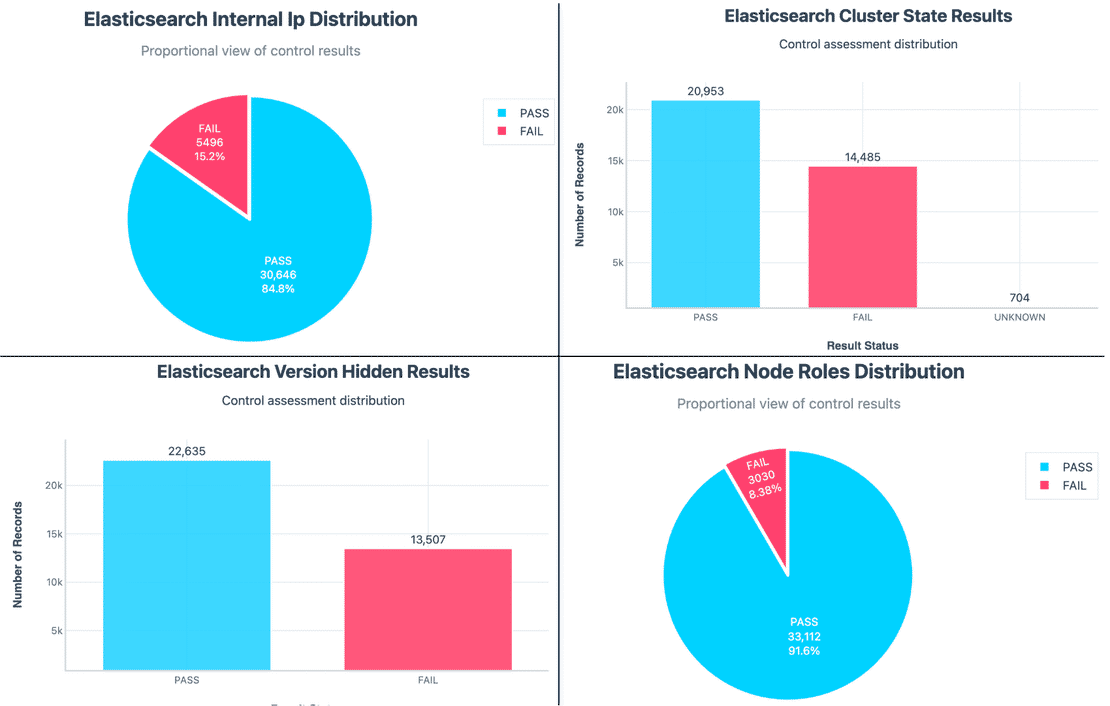
When we put these controls together, the risk posture makes more sense. The 6.34% Critical cases are mostly clusters with no authentication, no TLS, and most of the other controls. The bulk of ‘High’ cases are clusters that failed a mix of version hiding, TLS and node controls, meanwhile, the Low category isn’t perfectly secure, it just means they only passed enough controls to avoid being in the other category.
Let’s now look at MongoDB, another database with a history of misconfigurations.
MongoDB has always been at the center of exposed database incidents. From ransom notes left on open clusters to massive credential leaks, it has a long history of misconfigurations. In this dataset, I identified 88,565 MongoDB instances exposed to the internet.
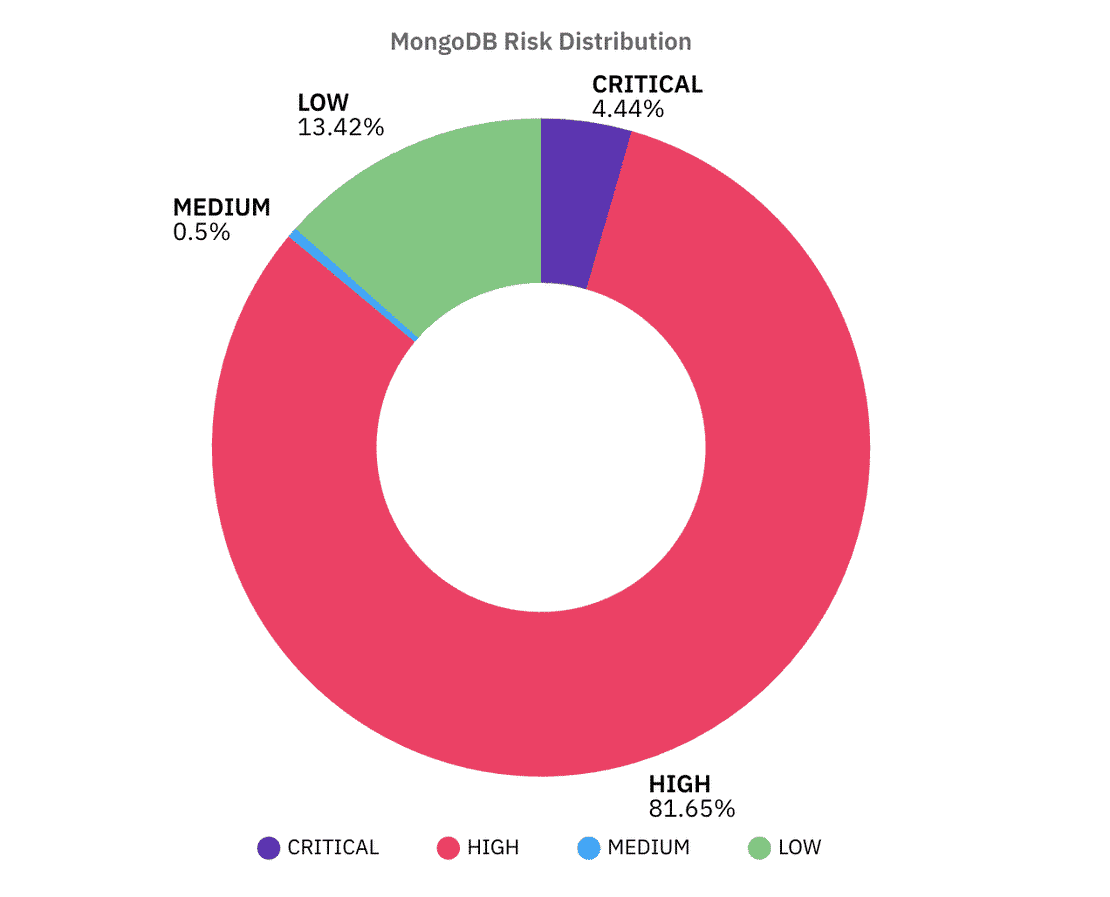
The overall risk distribution looks alarming:
But Let us see the reason behind that and understand how each control leads up to this score.
Let’s first start with Authentication, just as a heads up we didn’t have a clean way to directly test whether authentication was enabled or disabled. So instead we used a simple rule:
With this method, every single MongoDB instance in our dataset got marked as a failure for authentication, As this rule is not the actual representation of the authentication mechanism, let’s not take that into consideration here.
Let us see some other controls like Admin DB exposure.
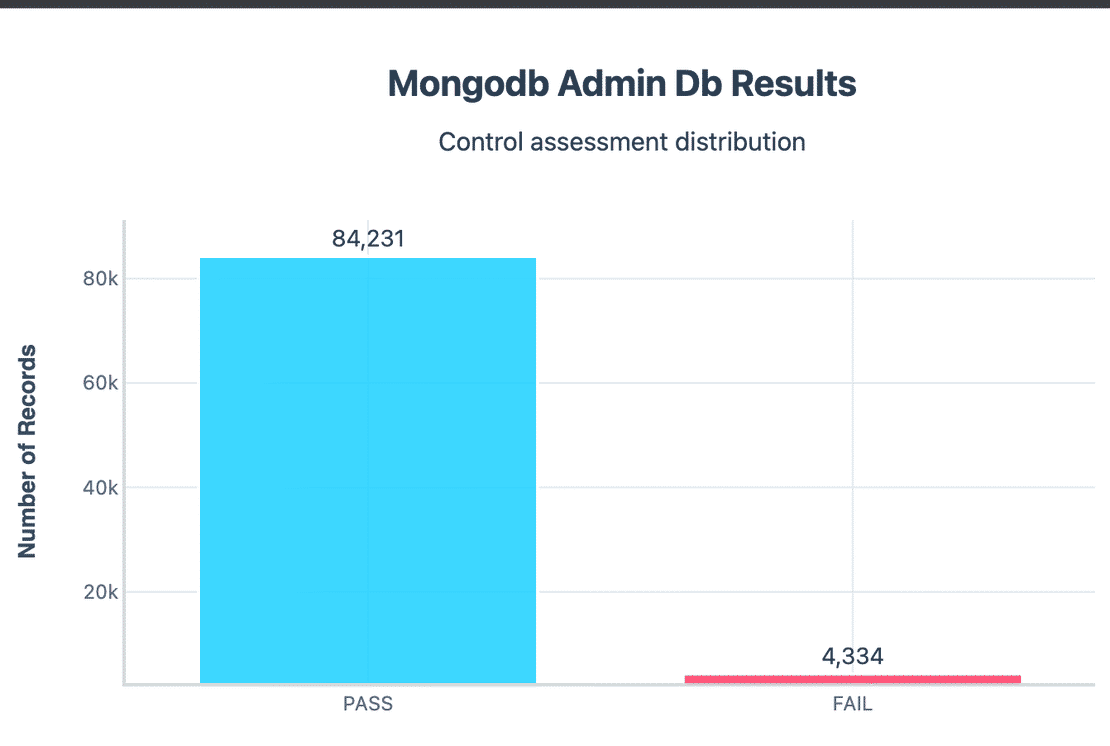
Around 4,334 instances had their sensitive admin/test databases directly exposed. This means metadata and privileged functions were accessible without restriction.
Version Disclosure:
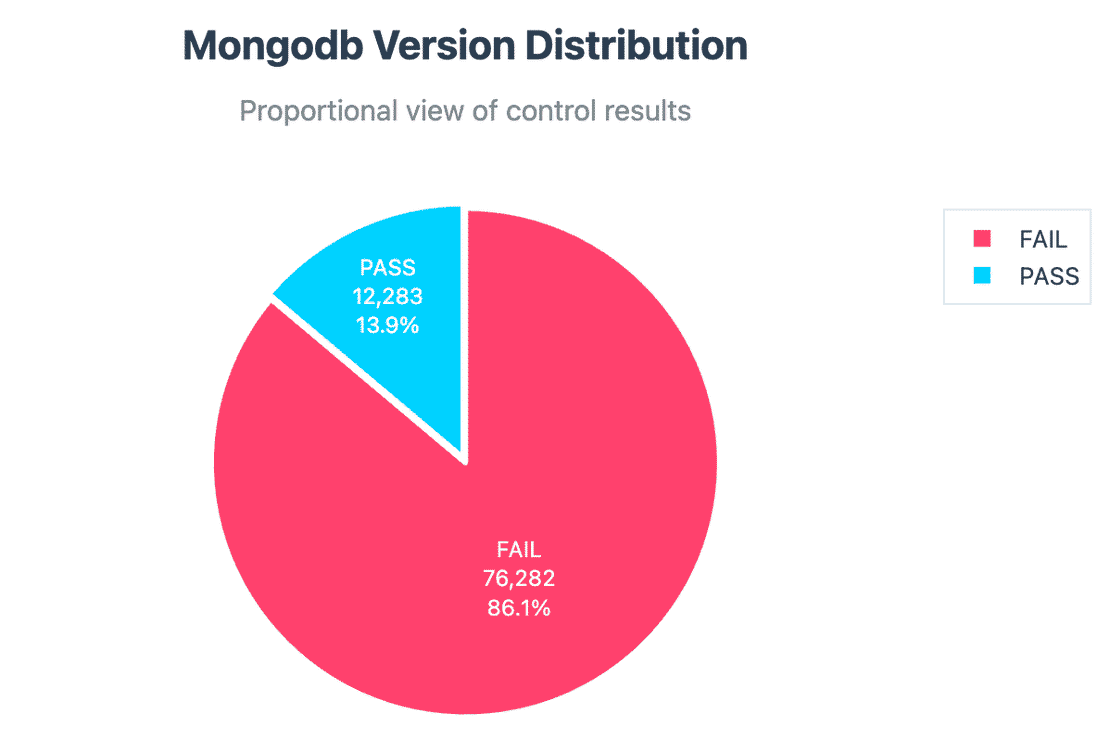
76k+ instances disclosed their exact MongoDB version. While version info alone isn’t always dangerous, paired with other failed controls can make it be.
Build Info Exposure:
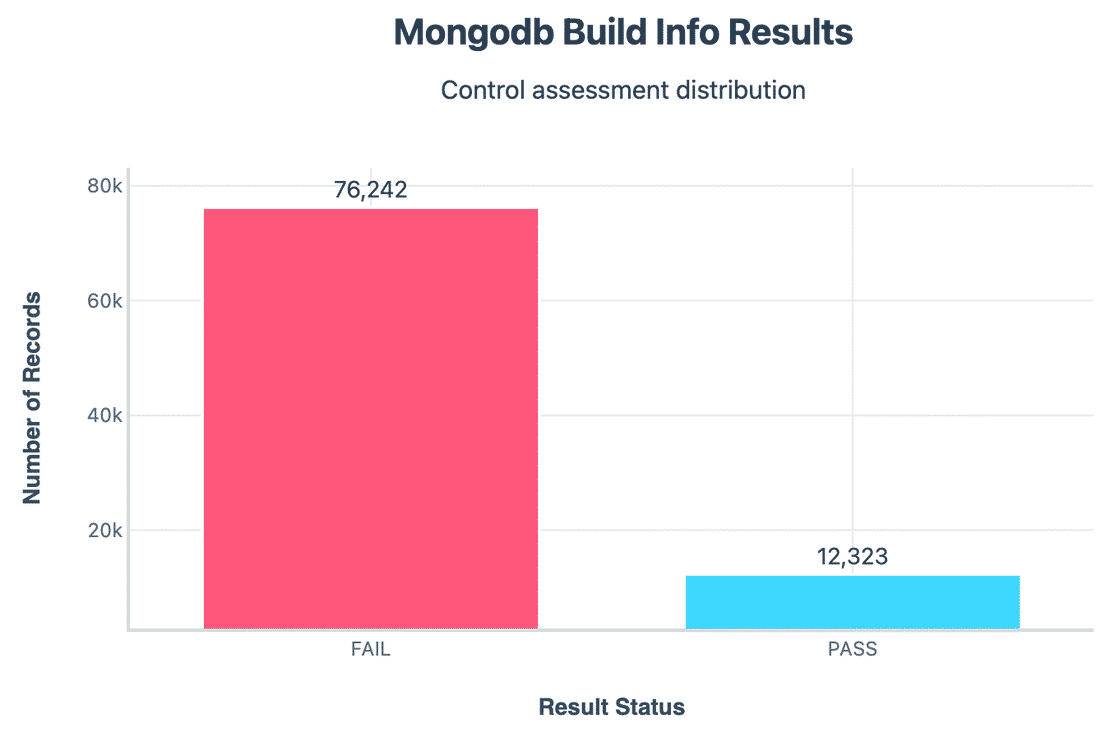
Similar to version, 76k+ clusters exposed full build information. These often leak unnecessary metadata and further reduce the effort needed for reconnaissance.
So, In summary, when it comes to MongoDB, defining controls was harder compared to other databases. Many of the things we tested are tricky because of how MongoDB’s handshake works.
That’s why in our dataset we ended up flagging a huge majority of instances as High, The important thing to note is that while the exact percentage may not perfectly reveal the truth, these patterns are still meaningful - exposed MongoDB servers tend to reveal more information than they should.
Let’s move on to the next database, the largest one.
MySQL is one of the oldest and most widely used databases in the world. From wordpress blogs to SaaS platforms, it shows up everywhere.
In this dataset, I found over 2.53 million MySQL instances exposed to the internet, by far the largest among all database types.
With 2.53M exposed instances, MySQL is the single biggest contributor to global exposure.
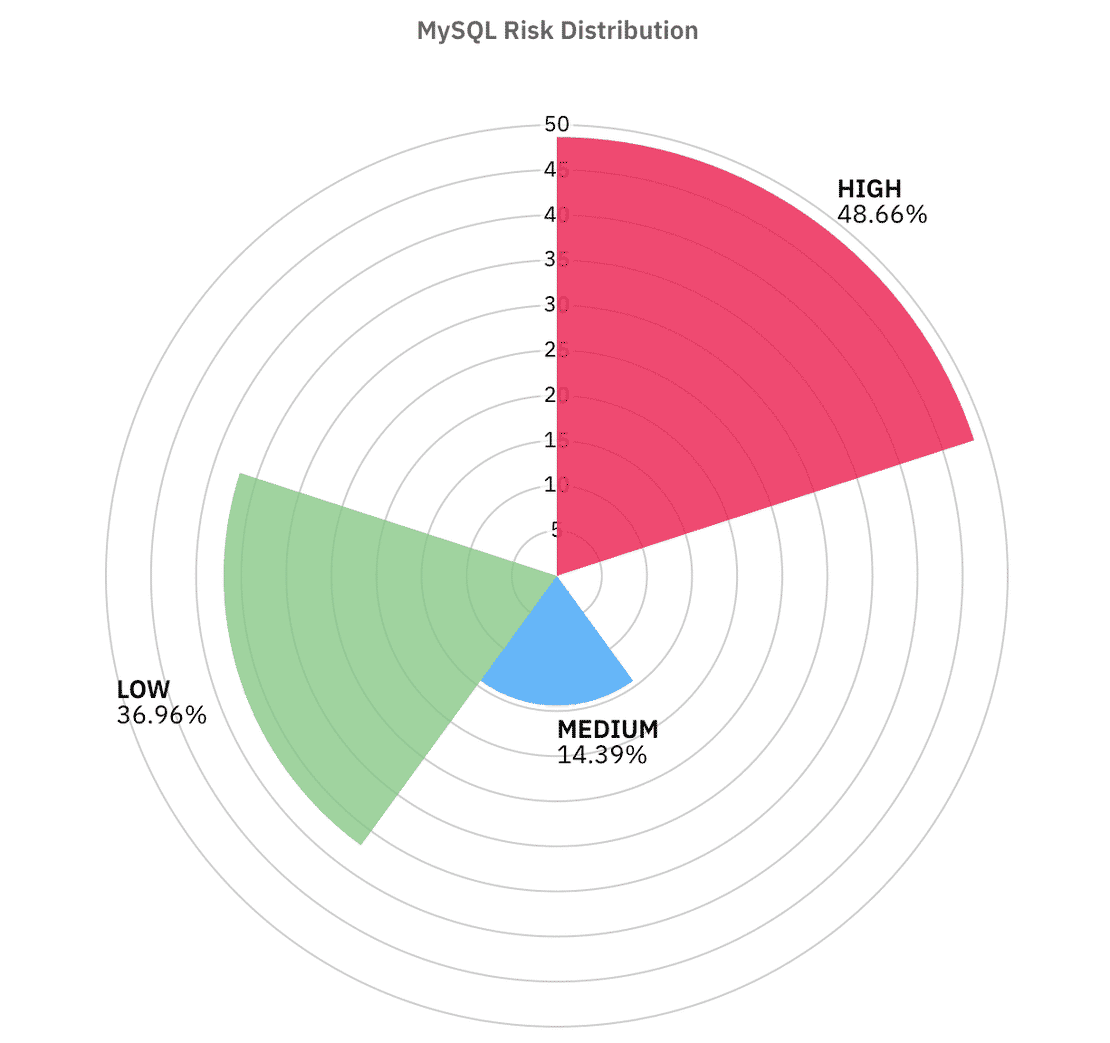
Looking at the risk distribution:
Let’s break it down control by control and see which failures are most common, and why they matter.
Let’s start with Authentication again -
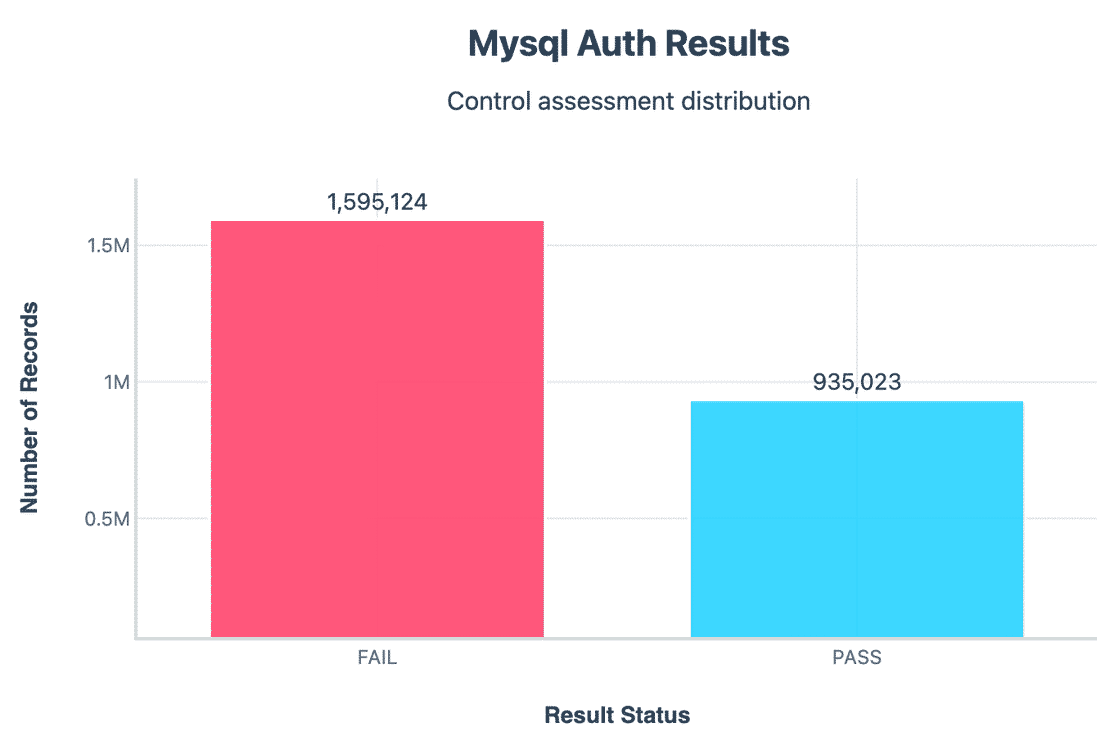
MySQL supports password based authentication, but our evidence showed that over 1.59M servers failed this control. This doesn’t always mean no password at all, but that all exposed metadata suggested weak or missing authentication.
Now let us have a look at TLS enforcement.
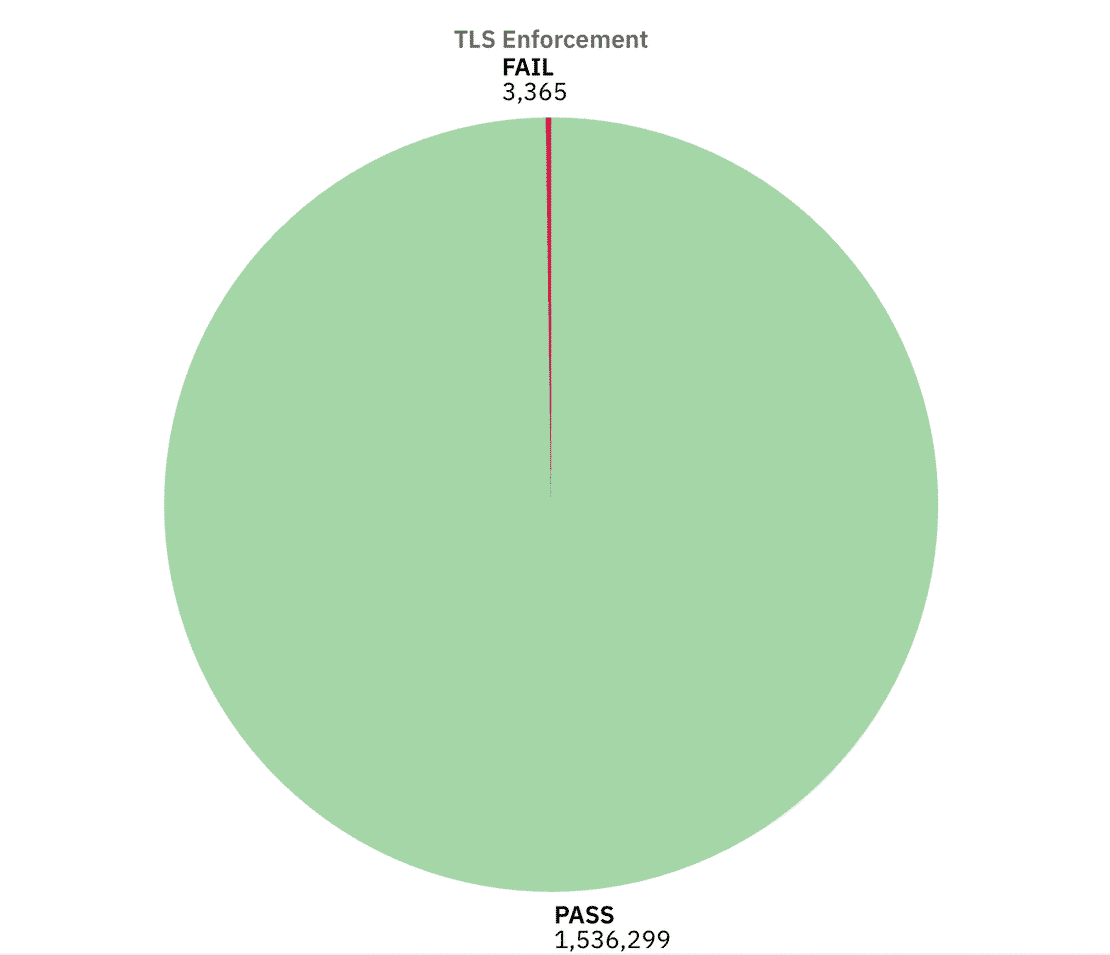
In this case the results were more positive, around 1.53M servers passed TLS checks, meaning they advertised support for encrypted transport. Only ~3.3k instances failed. However Around 1.7M came back as “NA” where the scan didn’t reveal a clear answer.
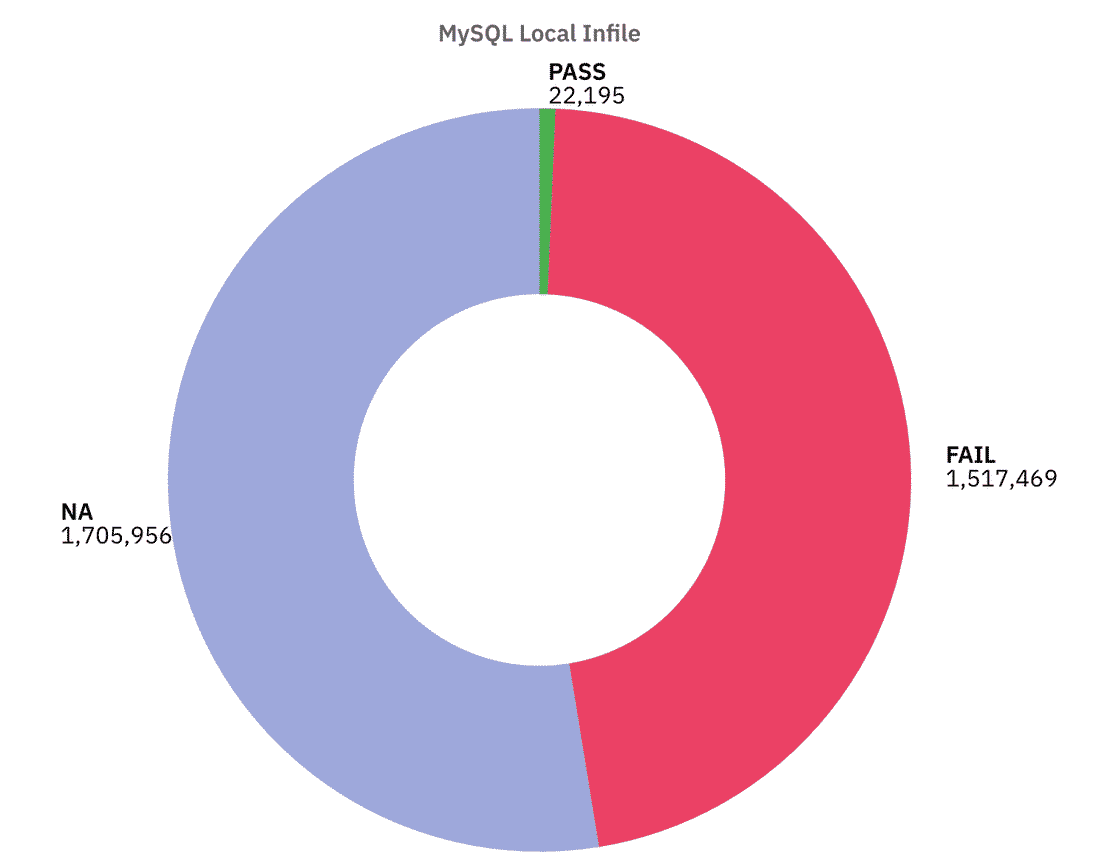
This one is especially worrying. About 1.51M servers had LOCAL INFILE enabled, and around 1.7M returned NA, this allows attackers to trick the server into reading files from disk or loading remote data.
Here are the stats of other controls excluding the NA’s -
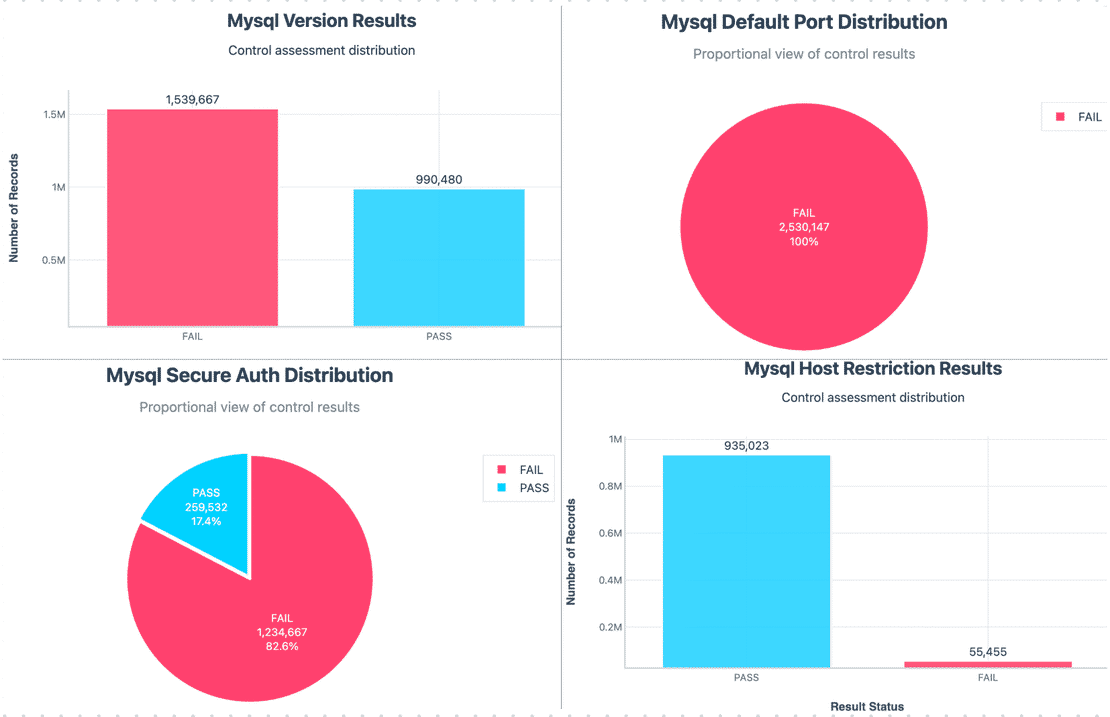
Overall, MySQL’s results weren’t too bad, but its still concerning. Many servers do have TLS enabled, which is a good sign. However, this is outweighed by version disclosures, use of default ports, LOCAL INFILE feature, etc. That is why nearly half of the MySQL instances ended up classified as High risk in our model.
Now let’s move on to the next database type which is MSSQL.
MSSQL is widely used in enterprise environments. Because of its adoption in critical industries, exposed Servers can be really dangerous, attackers can pivot from these databases into entire enterprise networks.
In our dataset, I identified 279,854 MSSQL instances directly exposed.
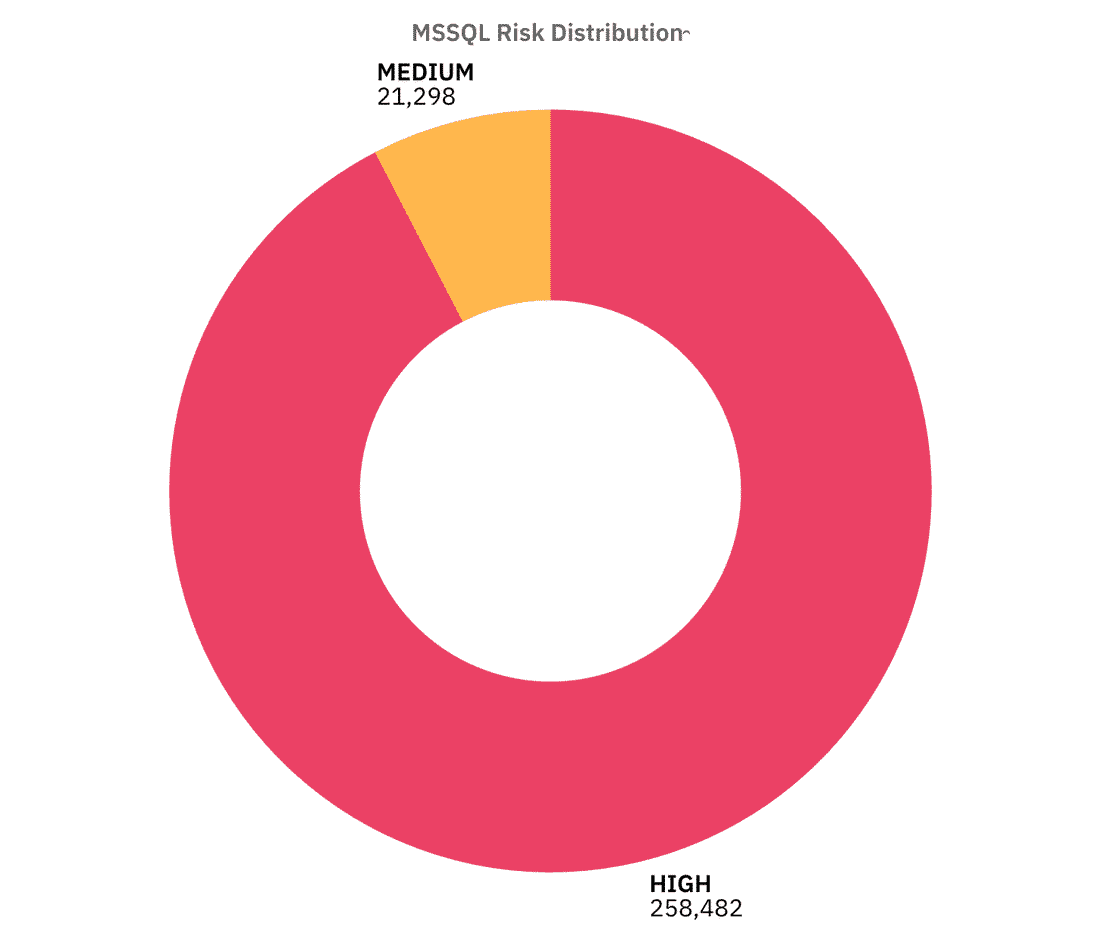
The Risk distribution shows that the majority of exposed MSSQL servers fall into High Risk, Let’s break down the controls to understand why -
Authentication:
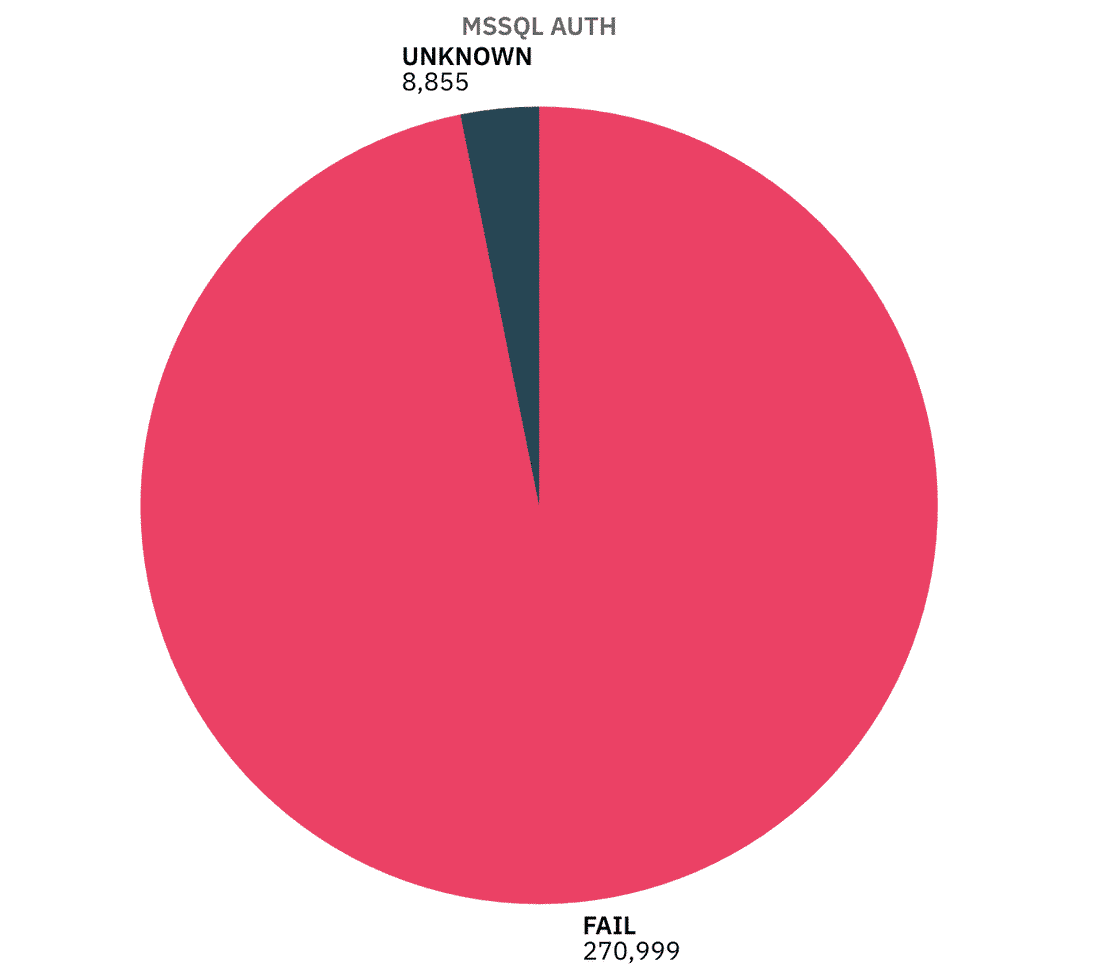
Unfortunately, almost all MSSQL servers failed the authentication test. This suggests that they provided some kind of banner or protocol response without requiring credentials. While this doesn’t necessarily mean anyone can query the database, it does show that these servers expose too much information.
Encryption Mode
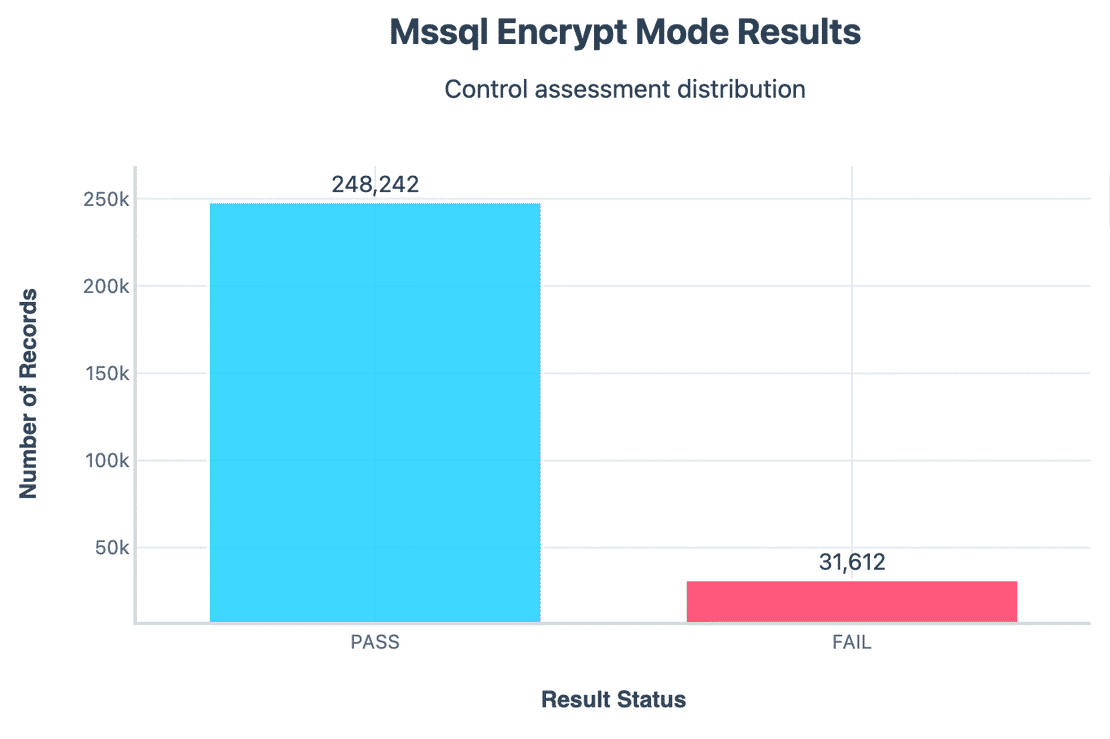
Roughly 31k servers did not enforce encryption.
Certificate Validity & Trust
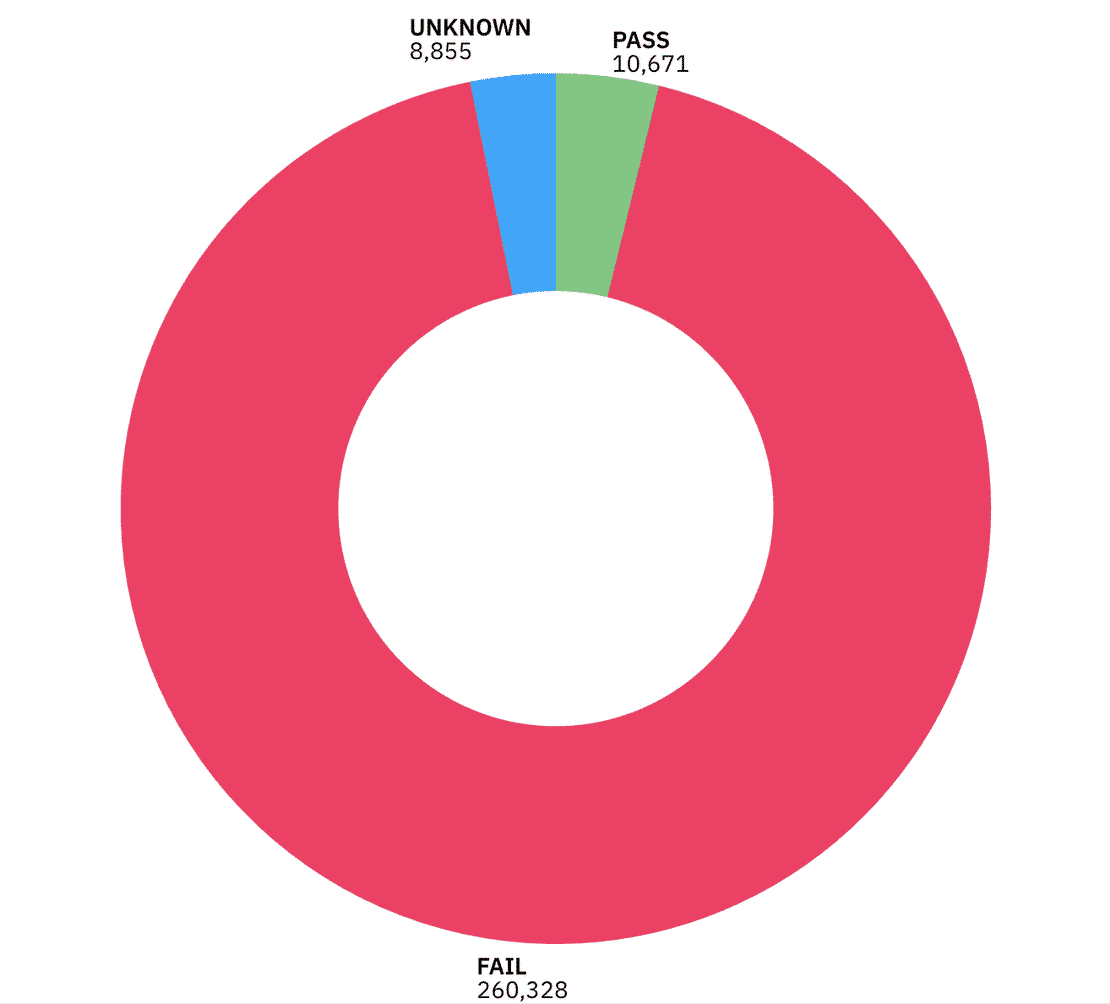
Most of the certificates we observed were either expired, self-signed, or not trusted by standard CAs. 260k instances failed the certificate validity check.
Protocol Version
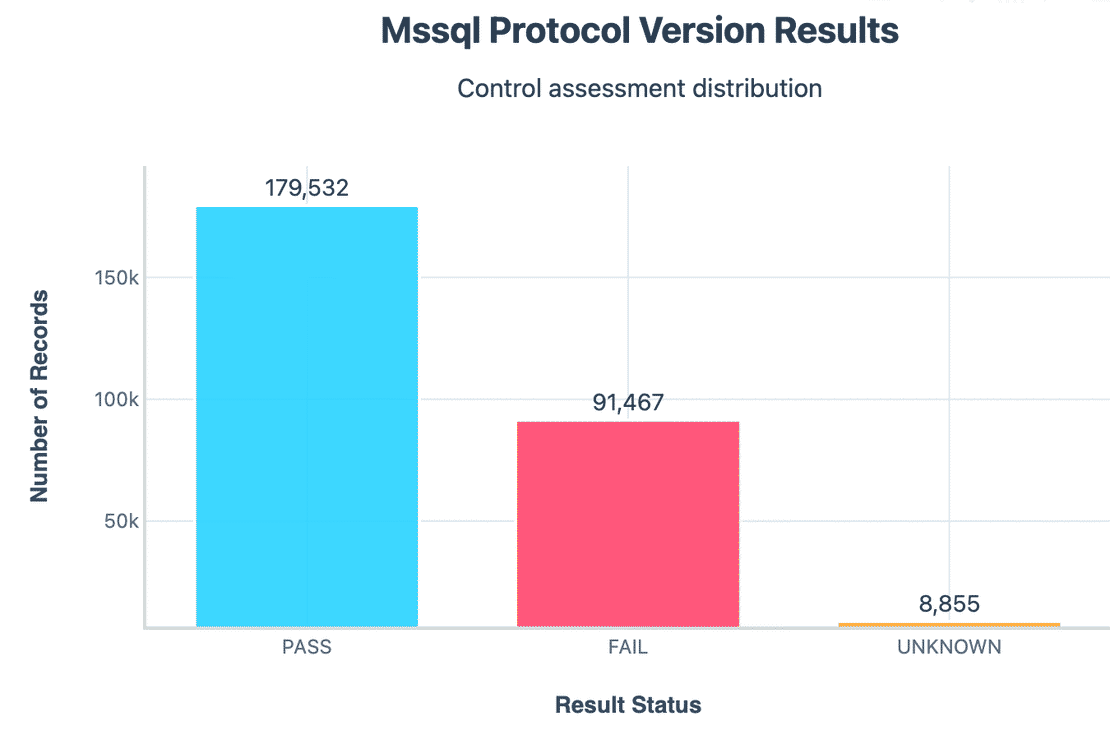
A large portion of servers still accepted older TDS protocol versions. Outdated protocol support can carry legacy vulnerabilities.
So in summary, Almost all instances leaked version banners, sat on default port, while a majority had invalid or untrusted certificates combined with weak encryption and authentication, this is why most of the MSSQL instances landed heavily in the High Risk category.
Now let’s move on to PostgreSQL.
PostgreSQL is widely preferred for its reliability and advanced features. its used for web apps, analytics, and large scale platforms. In this dataset, I identified 267,871 PostgreSQL instances.
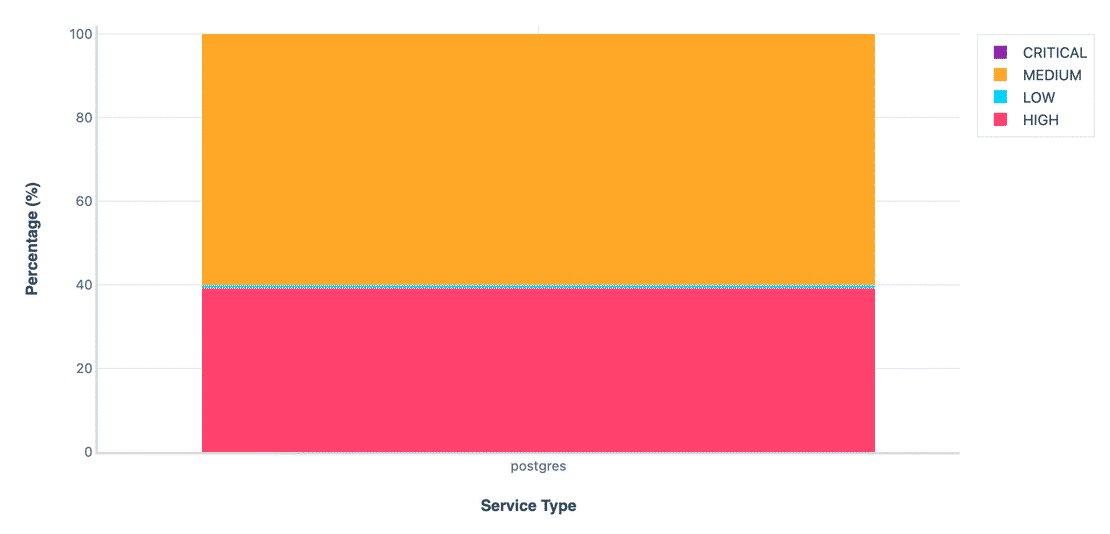
The overall distribution shows that majority of the instances fall in the Medium risk category with a decent amount of instances in the High category as well. Let’s walk through each control in detail -
Authentication:
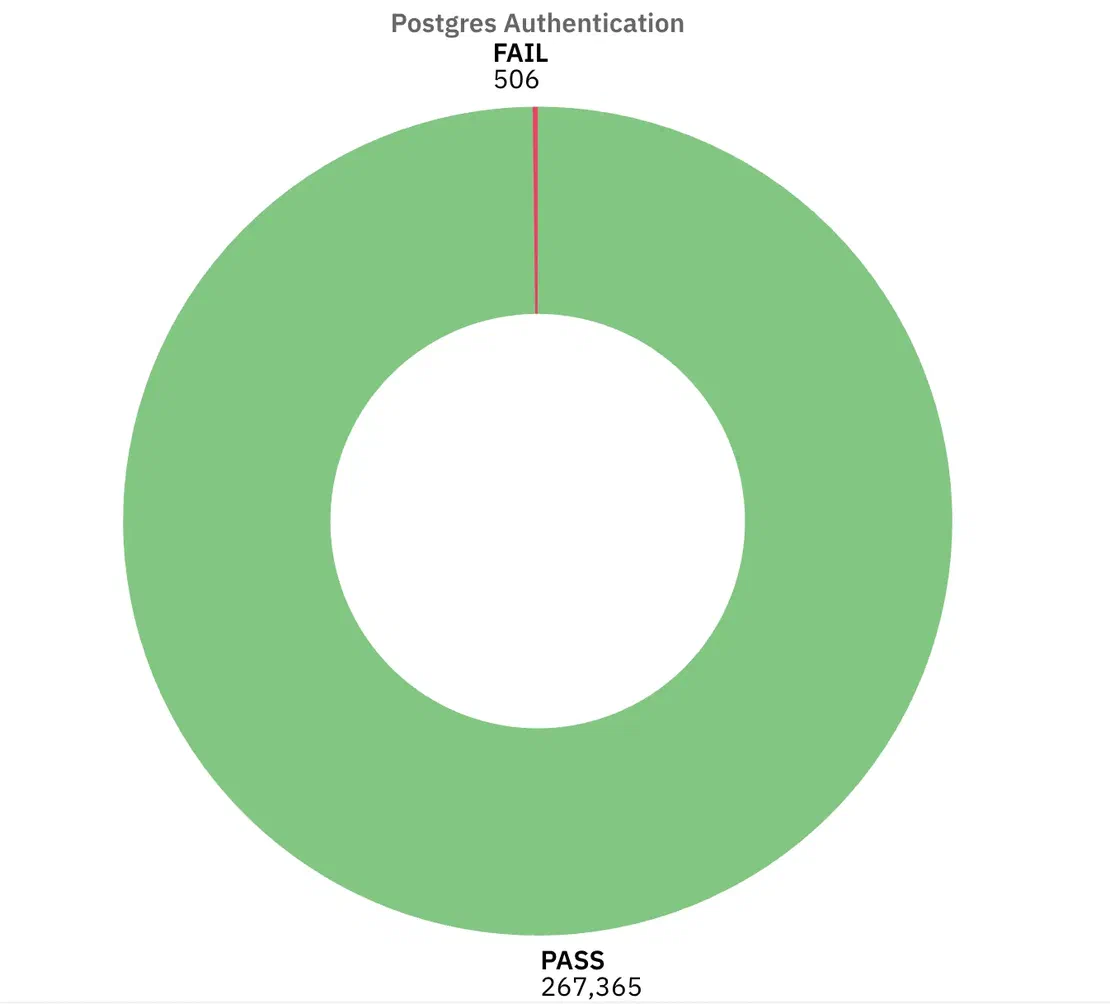
Almost all the instances required authentication in some form, only 506 instances failed this control. That’s actually encouraging compared to the other services.
TLS Enforcement:
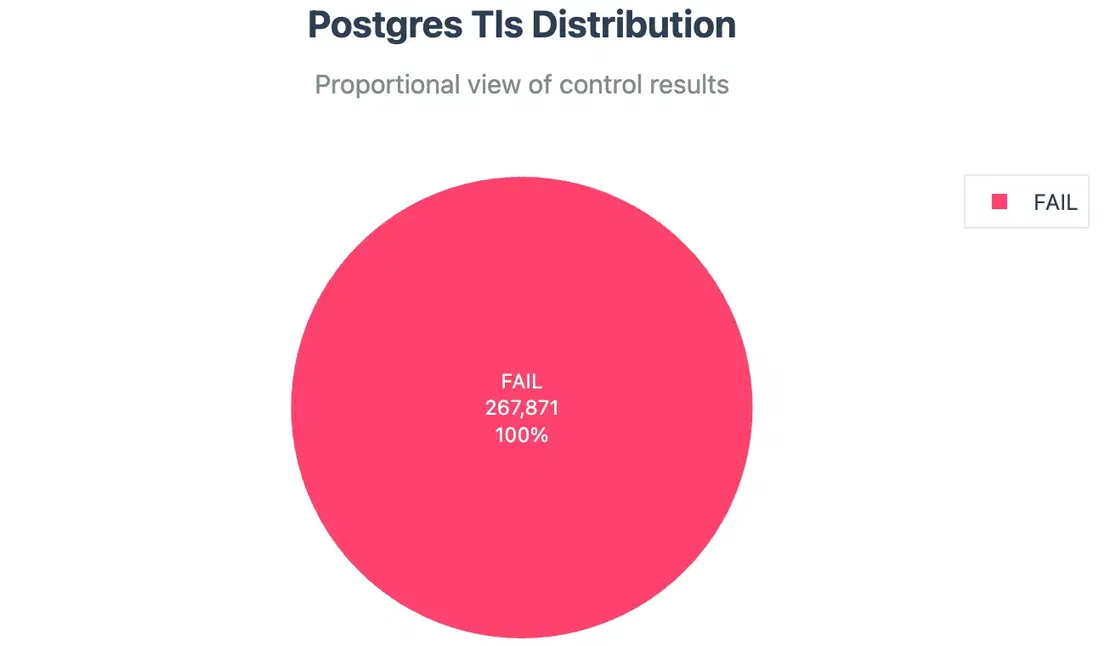
Unfortunately, every single PostgreSQL instance failed this control, this is one of the largest contributor in the High risk bucket.
Protocol Restriction:
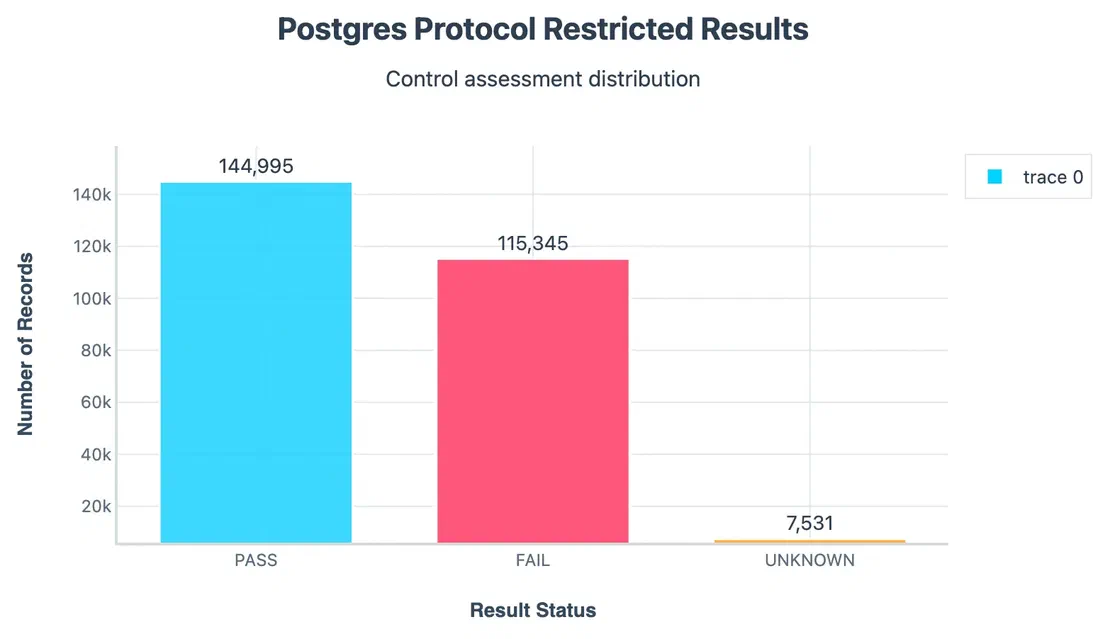
Postgres supports different protocol versions, and insecure ones should be disabled. Yet 115k instances failed this test and about 145k passed.
And the other controls such as Default port usage, Error verbosity and version disclosure consisted of majorly failures. Combining that with the TLS enforcement and protocol restriction explains the risk distribution.
Let’s move on to the next and the last one - Oracle.
Oracle databases are not as frequently exposed to the public internet compared to others, but when they are, they usually belong to large enterprises, governments, or critical services which makes any exposure highly concerning
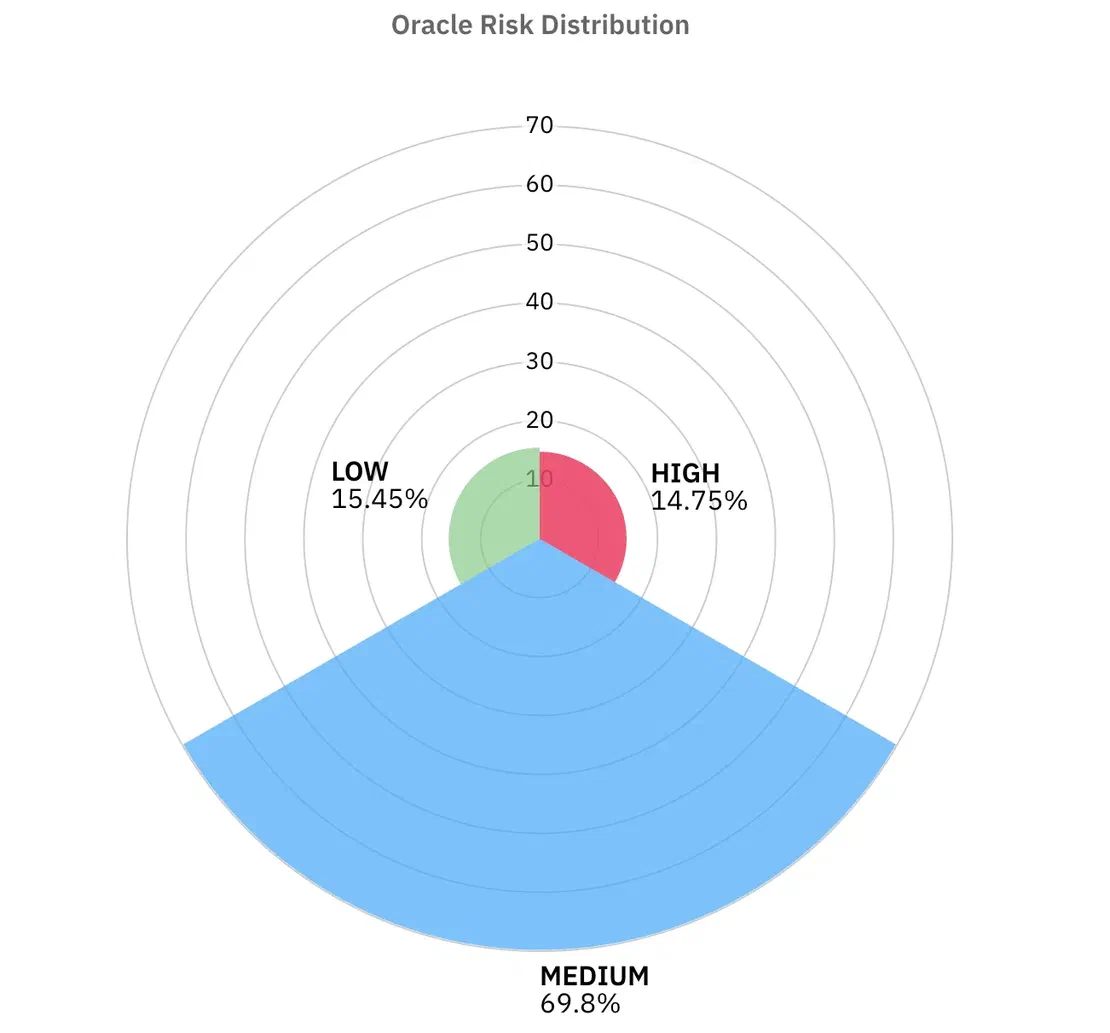
The risk distribution looks very different from the other databases:
Let’s breakdown each control one by one.
Authentication:
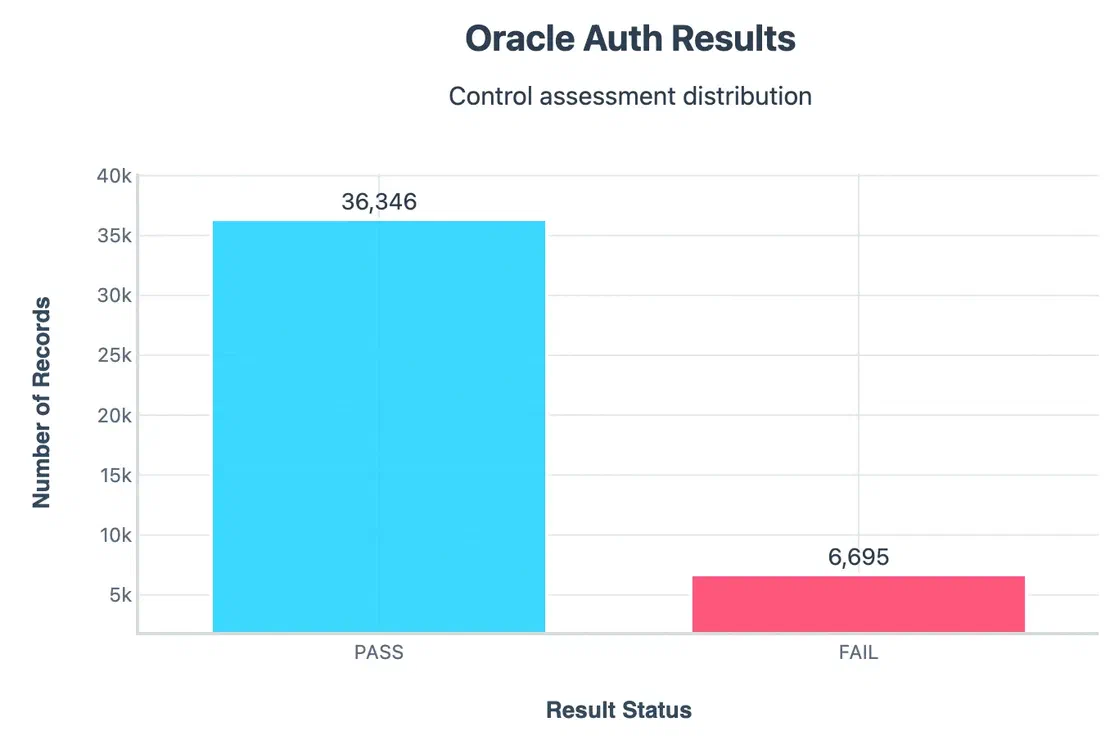
Around 36k servers passed authentication by refusing connection, but 6.6k servers failed, although most of the instances passed, even this ~15% failure rate is worrying.
Version Disclosure:
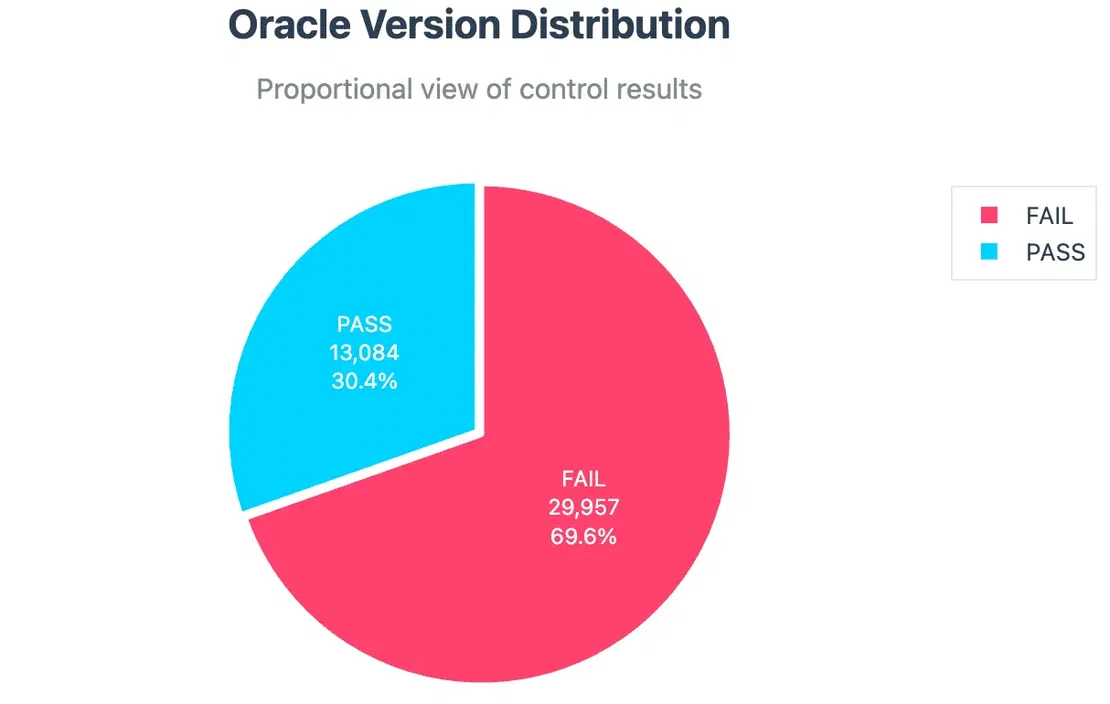
Listener Services Exposure:
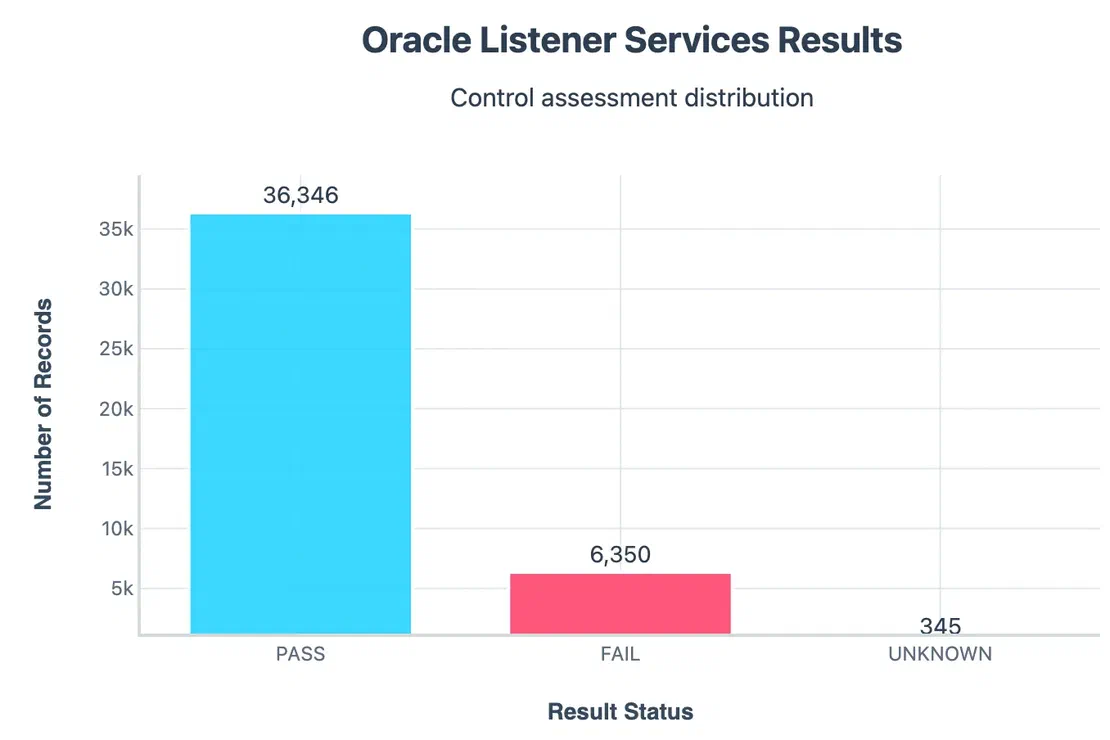
And other controls like Default Port, Error verbosity, Encryption enforcement came out to be majorly fails.
So, in summary, the risk patterns show that admins are at least enabling authentication, but failing at other small controls like leaking version, verbose errors, and skipping encryption. This is why most servers cluster in the Medium risk bucket.
Percentages are approximate, based on what banners and metadata revealed. They should be read as trends, not exact counts.
| Database | Total Instances | Risk Distribution Approx (Critical / High / Medium / Low) | Top Failing Controls |
|---|---|---|---|
| Elasticsearch | 36,142 | 6.3% / 16.9% / 18.6% / 58.1% | Authentication, TLS, Cluster State Access, Version Disclosure |
| MongoDB | 88,565 | 4.4% / 81.6% / 0.5% / 13.4% | Authentication (method issue), Version Disclosure, Build Info, Admin DB |
| MySQL | 2,530,147 | 0% / 48.7% / 14.4% / 36.9% | Auth Enforcement, Local Infile, Default Ports, Host Restrictions |
| MSSQL | 279,854 | ~1% / 81.65% / 7.61% / ~0% | Auth Enforcement, Certificate Trust/Validity, Version Disclosure, Protocol Version |
| PostgreSQL | 267,871 | ~0% / 39.28% / 60.14% / ~0% | TLS Enforcement, Error Verbosity, Version Disclosure, Default Port |
| Oracle | 43,041 | ~0% / 14.8% / 69.8% / 15.5% | Version Disclosure, Error Verbosity, Encryption Enforcement, Default Port |
Once we broke down the risk posture of each database service individually, the next step was to zoom out again and see what patterns hold true across the whole dataset. Looking beyond individual technologies, certain themes emerged around hosting providers, geography, etc.
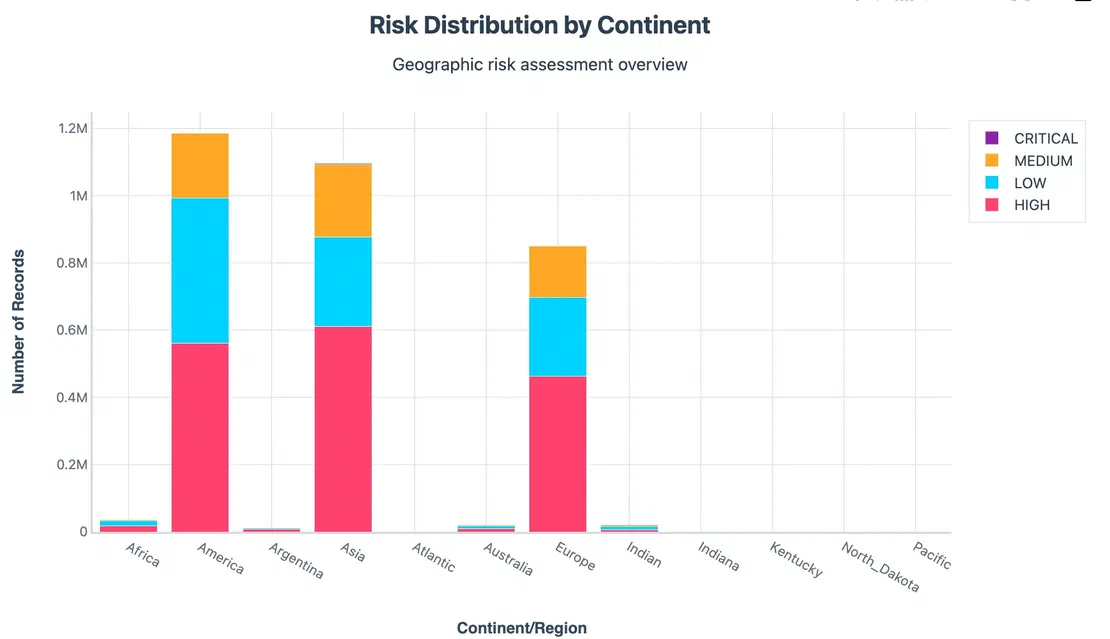
I started by mapping exposures across continents. Unsurprisingly, North America and Asia dominated in sheer numbers, followed by Europe.
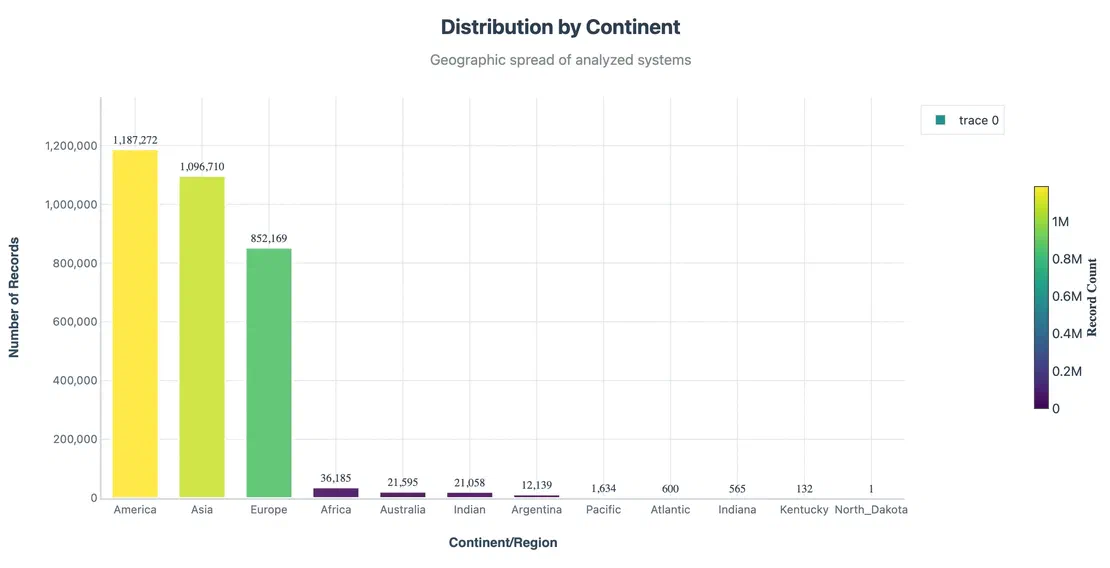
But raw volume isn’t the whole story. When we normalised by risk level:
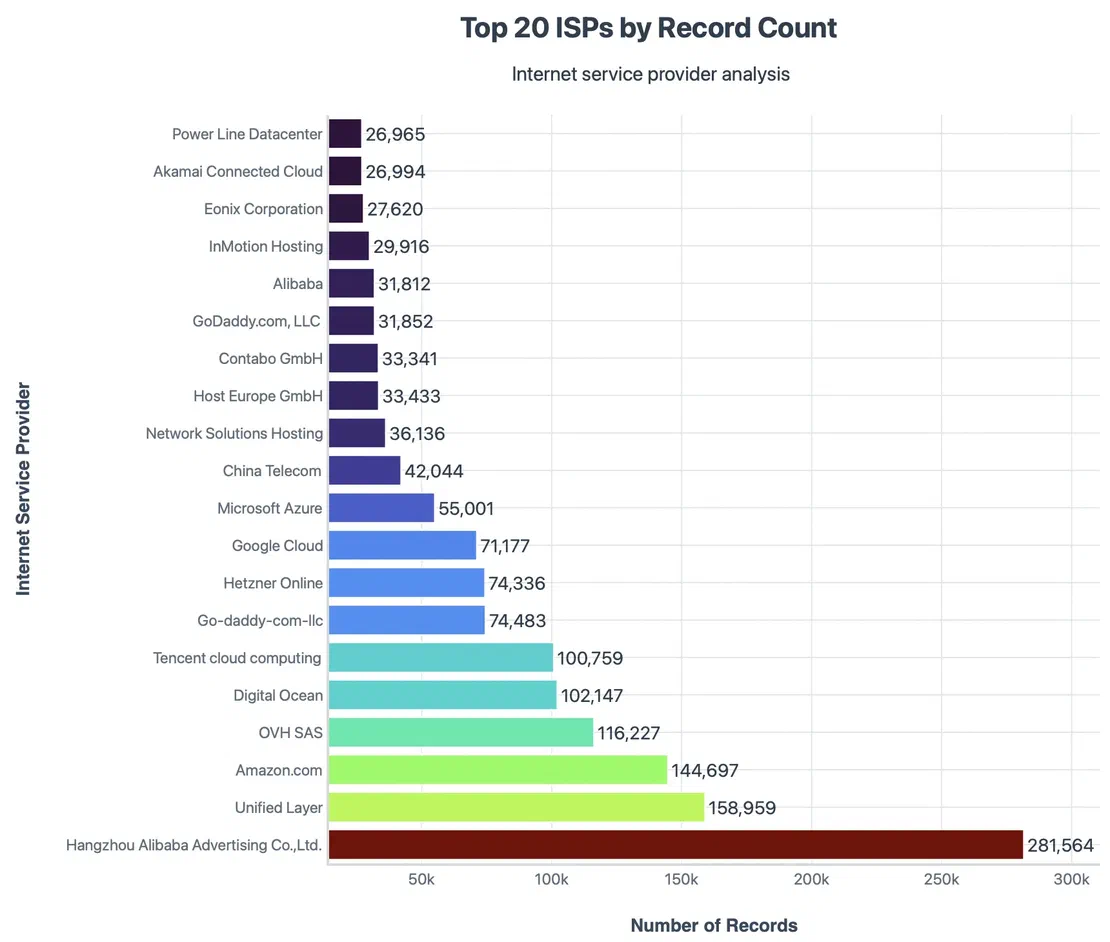
When grouped by ISP’s, these were the Top 20 ISPs by Record Count -
And at last, this is the final short summary of all the 3M records -
So far, we have seen how exposed databases manifest across services, providers and geographies. But How do we fix this?
Here are the key takeaways for each database type:
Elasticsearch
MongoDB
MySQL
LOCAL INFILE unless absolutely needed.MSSQL
PostgreSQL
Oracle
Configuration is only one piece of the puzzle. Long term fixes require:
When I first set out on this research, the question was simple: are exposed databases still a major problem in 2025, or are we mostly past it?
Using Netlas data, I analysed over 3.2 million exposed instances across six of the most widely used databases and
This tells us something important: the issue is not a lack of knowledge, but a lack of consistent practice. Organisations already know these basics, yet they remain undone at scale.
However, this research also shows that progress is possible. Many instances did pass certain controls, like TLS adoption is growing, authentication is often enforced on newer deployments. These are good signs.
Performing this kind of test has limitations:
That’s why I always frame this study as evidence of patterns, not a definitive count. It’s a lens, not an x-ray.
This study never attempted exploitation. All findings are passive observations and real-world risk could be higher or lower than indicated.
At its core, this research shows that the internet still suffers from old mistakes in new times. None of the controls we tested were advanced, they were the basics, and yet, across many systems, those basics are still broken.
The lesson is not that databases are unsafe, but that operational discipline is inconsistent.
Even small mistakes add up, and when multiplied by millions, they become a global security problem.

Book Your Netlas Demo
Chat with our team to explore how the Netlas platform can support your security research and threat analysis.
此内容由惯性聚合(RSS阅读器)自动聚合整理,仅供阅读参考。 原文来自 — 版权归原作者所有。